
 Open Access Article
 This Open Access Article is licensed under a
 Creative Commons Attribution 3.0 Unported Licence
Structural and dynamic studies of substrate binding in porous metal–organic frameworks
Timothy L.
Easun
 a,
Florian
Moreau
b,
Yong
Yan
b,
Sihai
Yang
*b and
Martin
Schröder
*bc
a,
Florian
Moreau
b,
Yong
Yan
b,
Sihai
Yang
*b and
Martin
Schröder
*bc
aSchool of Chemistry, Cardiff University, Cardiff, CF10 3XQ, UK
bSchool of Chemistry, University of Manchester, Oxford Road, Manchester M19 3PL, UK. E-mail: Sihai.Yang@manchester.ac.uk; M.Schroder@manchester.ac.uk
cNikolaev Institute of Inorganic Chemistry, Siberian Branch of the Russian Academy of Sciences, 3 Ac. Lavrentiev Ave., Novosibirsk 630090, Russian Federation
First published on 29th November 2016
Abstract
Porous metal–organic frameworks (MOFs) are the subject of considerable research interest because of their high porosity and capability of specific binding to small molecules, thus underpinning a wide range of materials functions such as gas adsorption, separation, drug delivery, catalysis, and sensing. MOFs, constructed by the designed assembly of metal ions and functional organic linkers, are an emerging class of porous materials with extended porous structures containing periodic binding sites. MOFs thus provide a new platform for the study of the chemistry and reactivity of small molecules in confined pores using advanced diffraction and spectroscopic techniques. In this review, we focus on recent progress in experimental investigations on the crystallographic, dynamic and kinetic aspects of substrate binding within porous MOFs. In particular, we focus on studies on host–guest interactions involving open metal sites or pendant functional groups in the pore as the primary binding sites for guest molecules.
 Timothy L. Easun | Timothy Easun was awarded his MSci from Nottingham University and PhD from Sheffield University. Dr Easun is currently a Royal Society University Research Fellow in the School of Chemistry at Cardiff University. His research focuses on the control of nanoscale flow of molecules within porous materials using photochemistry both as probe and actuator to make nanofluidic devices. |
 Florian Moreau | Florian Moreau obtained his MSc from the Université de Versailles-Saint Quentin en Yvelines, France (2008) and his PhD from the Université de Rennes 1, France (2011). He is currently a postdoctoral fellow at the University of Manchester with Professor Schröder where his current work is focused on the design and synthesis of highly connected, functionalised MOFs and the study of framework dynamics and gas-host interactions. |
 Yong Yan | Yong Yan, born in 1984, obtained his BSc from Lanzhou University in 2006 and PhD from University of Nottingham in 2011. He continued as a postdoctoral researcher with Professor Schröder focusing on structural characterisation of MOFs using various techniques such as synchrotron X-ray and neutron scattering techniques, as well as the discovery of new porous materials for various applications. |
 Sihai Yang | Sihai Yang received his BSc from Peking University in 2007 and PhD from University of Nottingham in 2011. He then joined as a senior research fellow/assistant professor in the School of Chemistry in University of Nottingham. He moved to University of Manchester as a Lecturer in 2015. His current research interests lie in the study of the “structure–function” relationships in porous materials. |
 Martin Schröder | Martin Schröder obtained his BSc from the University of Sheffield and PhD from Imperial College, London. He has held academic appointments at the University of Edinburgh and University of Nottingham. In 2015 he was appointed Vice-President and Dean of the Faculty of Engineering & Physical Sciences and Professor of Chemistry at the University of Manchester. His research lies in the area of coordination and supramolecular chemistry with specific focus on energy applications and clean technologies. |
1. Introduction
Porous metal–organic frameworks (MOFs) are assembled from metal ions or clusters which are bridged by functional organic molecules. These materials often adopt three-dimensional extended microporous or mesoporous framework structures incorporating nano- and meso-sized pores, yielding large and accessible internal surface areas. Over the past decade, these hybrid materials have received considerable attention due to their potential for gas storage and separation, catalysis, optical properties, sensing, substrate recognition and drug delivery.1,2 These important properties primarily rely on the selective recognition and binding of guest molecules by these functional materials.Within the field of gas storage, separation and purification, there is particular emphasis on optimising the interactions between MOF hosts and the adsorbed substrate molecules, leading to the discovery of new functional materials with higher storage capacities and stronger binding energies. For this reason, visualisation of the guest–host binding interactions involved in the gas adsorption applications is crucial to the understanding of how these materials function, and to identify important potential mechanisms for the sensing and discrimination of guest molecules.
The experimental investigations reviewed herein are three-fold. (i) The determination of the locations of guest molecules within porous MOFs by static crystallographic studies, typically by in situ diffraction experiments as a function of gas loading, gives key insights into the preferred binding sites within pores. (ii) The direct observation of the dynamics of these adsorbed/trapped/captured guest molecules within the host together with the change of the molecular motion of the MOF materials, typically by spectroscopic experiments, reveals the nature of these binding interactions. (iii) Studies on the diffusion of guest molecules within the pores and channels of porous MOFs by pulsed field gradient (PFG) NMR or quasi-elastic neutron scattering (QENS) experiments can afford important knowledge on the kinetics of gas loading, and such information is fundamental to optimise gas adsorption processes in industry. Computational modelling, including density function theory (DFT) and molecular dynamics (MD), linked to experimental data has played an important role in visualising molecular motions and diffusion within pores. A combination of these static, dynamic and kinetic approaches offers a comprehensive understanding of the guest–host binding processes that ultimately govern these materials properties.
However, gaining such insight by experiment is highly challenging for a number of reasons. Firstly, MOF materials with excellent gas sorption properties usually crystallise with large unit cells and inevitably incorporate huge structural voids and framework disorder, resulting in weak, broad and/or heavily-overlapped diffraction peaks, thereby raising the complexity of structure solution and refinement. To overcome this, synchrotron X-ray radiation is often used instead of conventional in-house instrumentation, because diffraction patterns obtained from a synchrotron radiation source have much improved resolution and data quality.
Secondly, these materials and adsorbed gas molecules typically contain many light atoms (e.g., H, D, Li, C, N, O) which have relatively small scattering lengths for X-rays and may be poorly located in X-ray diffraction experiments. Unlike X-ray experiments in which the scattering lengths are generally proportional to Z2 of the elements (i.e., heavy atoms with more electrons can scatter X-rays more effectively than light elements), neutrons interact with the nuclei of elements and the cross-section of each element is isotope-dependent and does not follow any particular rules. In general, light elements can have large cross-sections in terms of neutron scattering and therefore are more readily “seen” by neutrons (Table 1).3 Thus, neutron diffraction offers unique possibilities for determining key features of both the structural details of MOF materials and the precise locations of gas molecules within the pore cavities. Indeed, neutron diffraction is an excellent experimental method to observe D2 positions.
| Element | σ coherent (barn) | σ incoherent (barn) | σ total (barn) |
|---|---|---|---|
| σ coherent: bound coherent scattering cross section; σincoherent: bound incoherent scattering cross section; σtotal: total bound scattering cross section. 1 barn = 10−28 m2. | |||
| H | 1.7583 | 80.27 | 82.03 |
| D | 5.592 | 2.05 | 7.64 |
| C | 5.551 | 0.001 | 5.551 |
| N | 11.01 | 0.5 | 11.51 |
| O | 4.232 | 0.0008 | 4.232 |
| Cl | 11.5257 | 5.3 | 16.8 |
| S | 1.0186 | 0.007 | 1.026 |
| P | 3.307 | 0.005 | 3.312 |
| Li | 0.454 | 0.92 | 1.37 |
| Mg | 3.631 | 0.08 | 3.71 |
| Al | 1.495 | 0.0082 | 1.503 |
| V | 0.0184 | 5.08 | 5.1 |
| Fe | 11.22 | 0.4 | 11.62 |
| Co | 0.779 | 4.8 | 5.6 |
| Ni | 13.3 | 5.2 | 18.5 |
| Cu | 7.485 | 0.55 | 8.03 |
| Zn | 4.054 | 0.077 | 4.131 |
| Zr | 6.44 | 0.02 | 6.46 |
| Ag | 4.407 | 0.58 | 4.99 |
| In | 2.08 | 0.54 | 2.62 |
| La | 8.53 | 1.13 | 9.66 |
| Ba | 3.23 | 0.15 | 3.38 |
| Bi | 9.148 | 0.0084 | 9.156 |
Thirdly, the nature of these host–guest interactions is often based upon weak supramolecular mechanisms (e.g., hydrogen bonds, π⋯π interactions, van der Waals, electrostatic or dipole interactions). Such supramolecular interactions often involve hydrogen atoms and undergo dynamic processes. The dynamics of these interactions are difficult to probe directly by conventional spectroscopic experiments such as infrared (IR) or Raman spectroscopy, which are the most common methods for the study of molecular vibrations. Several examples of such studies are described in this review. Complementing optical spectroscopies, inelastic neutron scattering (INS) is a very powerful neutron spectroscopic technique to study atomic and molecular motions, including both the rotational and vibrational motions. In direct comparison to IR and Raman spectroscopy, INS has several major advantages:3
1. INS spectra are readily and accurately modelled
Measured INS intensities are related directly to the atomic displacement of the scattering atoms. Any complications arising from electro-optical parameters are thus avoided. Indeed, the band positions and intensities of most molecular systems can be accurately calculated using modern ab initio computational methods. Thus, the combination of INS and calculation can provide invaluable insights into the structure and dynamics of molecular systems. Also, the manipulation of an INS spectrum, e.g., subtracting a background, is straightforward.2. INS spectra are sensitive to hydrogen atom vibrations
The dipole (IR) and polarisability (Raman) changes required for vibrations to be observable by these techniques are highly dependent on electron density. Therefore IR and Raman techniques are often most sensitive to vibrations involving heavier atoms because of their higher electron count. This is not the case for INS. The neutron incoherent scattering cross section of the H atom is high, making it some ten times more visible than other atoms.3. INS spectra are not subject to the rules of optical selection
All vibrations are active in INS and, in principle, measureable. When scattered, a neutron transfers momentum to the atom, and INS measurements are not limited to observation at the Brillouin zone centre. Measured INS intensities are, thus, proportional to the concentration of the elements present in the sample being studied.4. Neutrons are penetrating, while photons are not
Neutrons penetrate deeply, of the order of millimetres, into typical solid samples and pass readily through the walls of containment vessels, which are generally aluminium or steel. INS results are thus naturally weighted to the measurement of bulk properties, rather than to the gas adsorbed on MOF surfaces.5. Wide spectral range
INS spectrometers cover the whole molecular vibrational range of interest (16–4000 cm−1). The lower energy range (below 400 cm−1) is readily accessible, a region that is traditionally more difficult experimentally for infrared and Raman spectroscopies. This low energy region often carries key information on the lattice dynamics and translational/rotational motions of adsorbed gas molecules. With modern instrumentation, the quality of INS spectra approaches that of infrared and Raman spectra obtained from the same system under the same conditions.These features make INS an ideal probe to study the MOF-gas binding dynamics, in particular for those involving hydrogen atoms. QENS, a sub-class of INS in which the energy transfer between the neutron and sample is very small (i.e. almost elastic collision), is another powerful neutron spectroscopic technique to study the slow motion and dynamics of gas-loaded MOFs owing to the large cross-section for light atoms, especially for H. In particular, QENS has played an important role in probing the diffusion rate of the gas molecules along the pore structure of MOFs.
Recent studies on porous metal–organic frameworks (MOFs) for H2 storage, selective carbon capture, and hydrocarbon separations have shown, in exceptional cases, location of guest molecules within the host via advanced crystallography studies (i.e., both X-ray and neutron diffractions), providing invaluable structural rationale for their function and properties. Most of these successes have been achieved within host systems that display strong confinement effects on the guest molecules and/or have specific binding sites such as open metal centres. More recently the applications of INS and QENS to study gas-loaded MOFs have enabled the interrogation of the dynamics and kinetics of adsorbed gas molecules within porous MOFs, including the host–guest systems involving primarily soft supramolecular interactions. In this critical review we discuss recent progress using crystallographic, dynamic and kinetic studies on host–guest binding within a range of functional MOF materials, primarily for those containing open metal centres or pendant functional groups for specific guest binding within the pore.
2. Materials with open metal centres
2.1 Cu(II)-based systems
Cu(II)-based MOFs, which show a high level of structural diversity and high porosity, have been intensively studied for energy storage (H2 and CH4),4–7 separations of small molecules,8 and heterogeneous catalysis.9 Most importantly, the solvent molecules bound to the six-coordinated Cu(II) of the commonly observed Cu2-paddlewheel motif (vide infra) can be removed in the activation process to generate coordinatively unsaturated Cu(II) sites, which play a significant role in the binding of guest molecules. One of the prototypical Cu(II)-based porous frameworks is [Cu3(BTC)2] (H3BTC = 1,3,5-benzenetricarboxylic acid),10 a neutral framework composed of [Cu2(OOCR)4] paddlewheels linked by BTC3− units to form a cubic tbo type network. [Cu3(BTC)2] has a trimodal pore structure containing three distinct cages: the largest cuboctahedron consisting of 12 [Cu2(OOCR)4] paddlewheel units and 24 BTC3− linkers with internal space of ca. 13 Å in diameter; the intermediate sized cage of diameter ca. 11 Å, comprising 8 BTC3− units and 12 [Cu2(OOCR)4] paddlewheels; and the smallest octahedron of ca. 5 Å in diameter formed from 4 BTC3− units and 6 [Cu2(OOCR)4] moieties.In situ neutron powder diffraction (NPD) experiments on D2-loaded [Cu3(BTC)2] at 25 K up to a saturated D2 dosage of 6.5 D2:Cu revealed a total of nine different D2 adsorption sites.11 The strongest binding sites were found at the coordinatively unsaturated Cu(II) sites with a Cu–D2 (centroid) distance of 2.39(1) Å (Fig. 1). The adsorption of D2 in this trimodal pore system follows a complex pore filling mechanism, with the D2 site occupancies changing with dosage. This is attributed to the concentration-dependant optimal D2 arrangements that result from the D2–D2 and framework–D2 interactions. At lower loadings, the adsorption sites D2(2), D2(3), and D2(5) were found within the smallest cage, while D2(4) and D2(6) reside in the intermediate sized pore. At 5.5 D2:Cu coverage, D2 starts to populate the largest cage (Fig. 2). A dynamic rearrangement of the D2 in the pores at loadings close to saturation reveals 4 D2 molecules placed tetrahedrally within the smallest pore, 32 D2 as a truncated octahedron in the intermediate sized cage, and 48 D2 forming a rhombic dodecahedron in the largest pore.
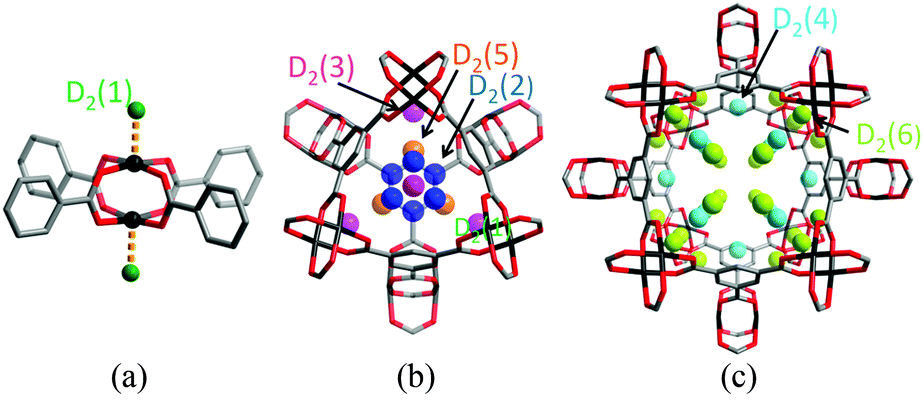 | ||
| Fig. 1 View of D2 adsorption sites in [Cu3(BTC)2]: (a) the axial Cu(II) site; (b) view of the binding site within the 5 Å small pore with triangular windows, and (c) within the 11 Å pore with square windows (c). Reproduced from ref. 11 with permission from the American Chemical Society. | ||
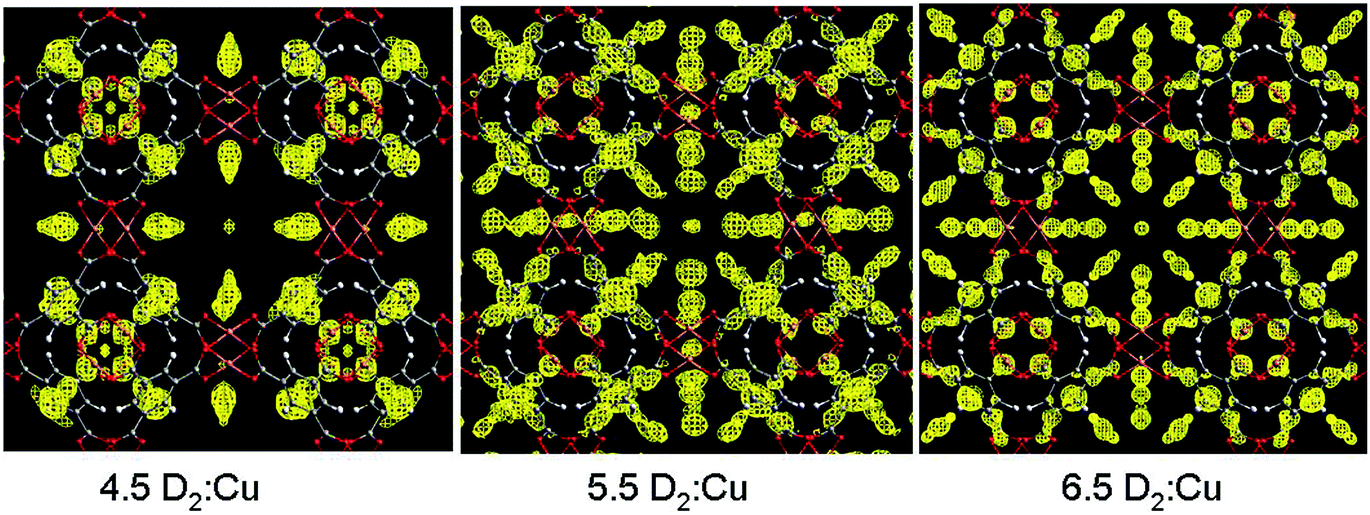 | ||
| Fig. 2 Fourier-difference maps shown along [001] for the unit cell featuring nuclear scattering density arising from D2 (yellow) in [Cu3(BTC)2] at a density of 0.7 fm Å−3 from three different D2 doses. Atomic colour scheme: Cu, metallic copper; O, red; C, grey; H, white. Reproduced from ref. 11 with permission from the American Chemical Society. | ||
An INS study of H2 adsorbed in [Cu3(BTC)2] has been carried out by Liu et al.12 Three distinct spectral features from the INS spectra at H2 loadings of less than 2.0 H2:Cu were assigned to the same first three binding sites identified previously11 (Fig. 3 and 4). These three binding sites are progressively populated at low coverage, consistent with the results obtained from the NPD study. It is widely accepted that MOFs incorporating ultra-micropores (below 10 Å) are optimal for H2 binding due to enhanced overlapping potentials, consistent with the observed order of pore-filling. This has been further supported in a series of Cu(II)–tetracarboxylate MOFs in which lower H2 uptake was observed with increasing pore size.13–15
 | ||
| Fig. 3 View of the first three H2 adsorption sites in [Cu3(BTC)2] labelled I, II, and III. Green spheres illustrate the positions of the adsorbed hydrogen sites. Cu(II) ions are indicated as pink balls. All other atoms and bonds are shown in pale grey. Reproduced from ref. 12 with permission from Elsevier. | ||
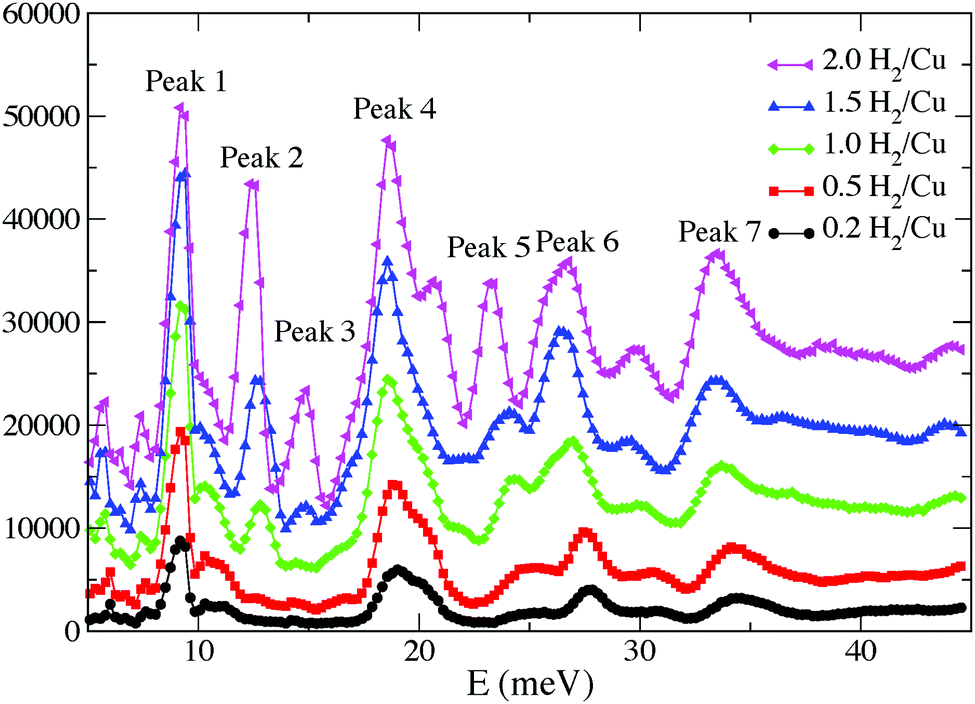 | ||
| Fig. 4 INS spectra of H2-loaded [Cu3(BTC)2] at 0.2, 0.5, 1.0, 1.5, 2.0 H2:Cu. The background spectrum has been subtracted from the H2 spectra. Reproduced from ref. 12 with permission from Elsevier. | ||
A recent study on CH4 storage in porous MOFs revealed that [Cu3(BTC)2] shows record high volumetric CH4 uptakes of 230 cc(STP) cc−1 at 35 bar and 270 cc(STP) cc−1 at 65 bar at room temperature.16 A detailed structural analysis of [Cu3(BTC)2] with various CD4 loadings has been performed using NPD, and reveals four distinct CD4 binding sites (Fig. 5).17 The first two favoured adsorption sites are located on the open Cu(II) sites and in the centre of the triangular window formed by three [Cu2(OOCR)4] paddlewheels and three BTC3− units. The small window pocket shows an excellent complementarity with the geometry of a CH4 molecule, thus creating an enhanced van der Waals binding interaction to CD4. Two secondary adsorption sites are located at the centre of the smallest octahedral cage and in the corner of the intermediate-sized cage.
 | ||
| Fig. 5 Experimentally determined crystal structure of [Cu3(BTC)2] with CD4 molecules adsorbed at (a) the open Cu sites and (b) the small cage window sites (top and side views). (c) van der Waals surface of the small octahedral cage in [Cu3(BTC)2] (derived by using N2 as probe molecules) showing the size and geometry of the pore window in an excellent match with a CD4 molecule. (d) CD4 molecule adsorbed at the centre of the small octahedral cage, a secondary adsorption site. (e) CD4 molecule located at the large cage corner site, also a weak adsorption site. Reproduced from ref. 17 with permission from John Wiley and Sons. | ||
In addition to its excellent storage capacities for H2 and CH4, [Cu3(BTC)2] shows very high acetylene storage capacity with an uptake of 201 cm3 g−1 at 295 K and 1 atm. NPD studies on C2D2-loaded [Cu3(BTC)2] reveal the significant contribution of open Cu(II) sites for acetylene binding (Fig. 6).18 Structural refinement on the NPD data at 0.62 C2D2 per Cu loading in [Cu3(BTC)2] indicates that C2D2 is adsorbed exclusively at the open Cu(II) sites with a distance between the Cu(II) ion and a C2D2 molecule of 2.62 Å. The C2D2 molecule lies parallel to the O–Cu–O axes with two half-occupied orientations. The second strongest C2D2 binding site was identified at a loading of 1.5 C2D2 per Cu, and resides at the entrance window of the smallest cage and reminiscent of the second binding site observed with CH4 (above). First-principle total-energy calculations confirm the two preferential adsorption sites from the NPD results, and also suggest a slightly distorted geometry of the adsorbed C2H2 on Cu(II) sites. It was postulated that the distorted C2H2 has an induced dipole moment which creates an enhanced Coulombic interaction between the C2H2 molecule and the open Cu(II) charge density.
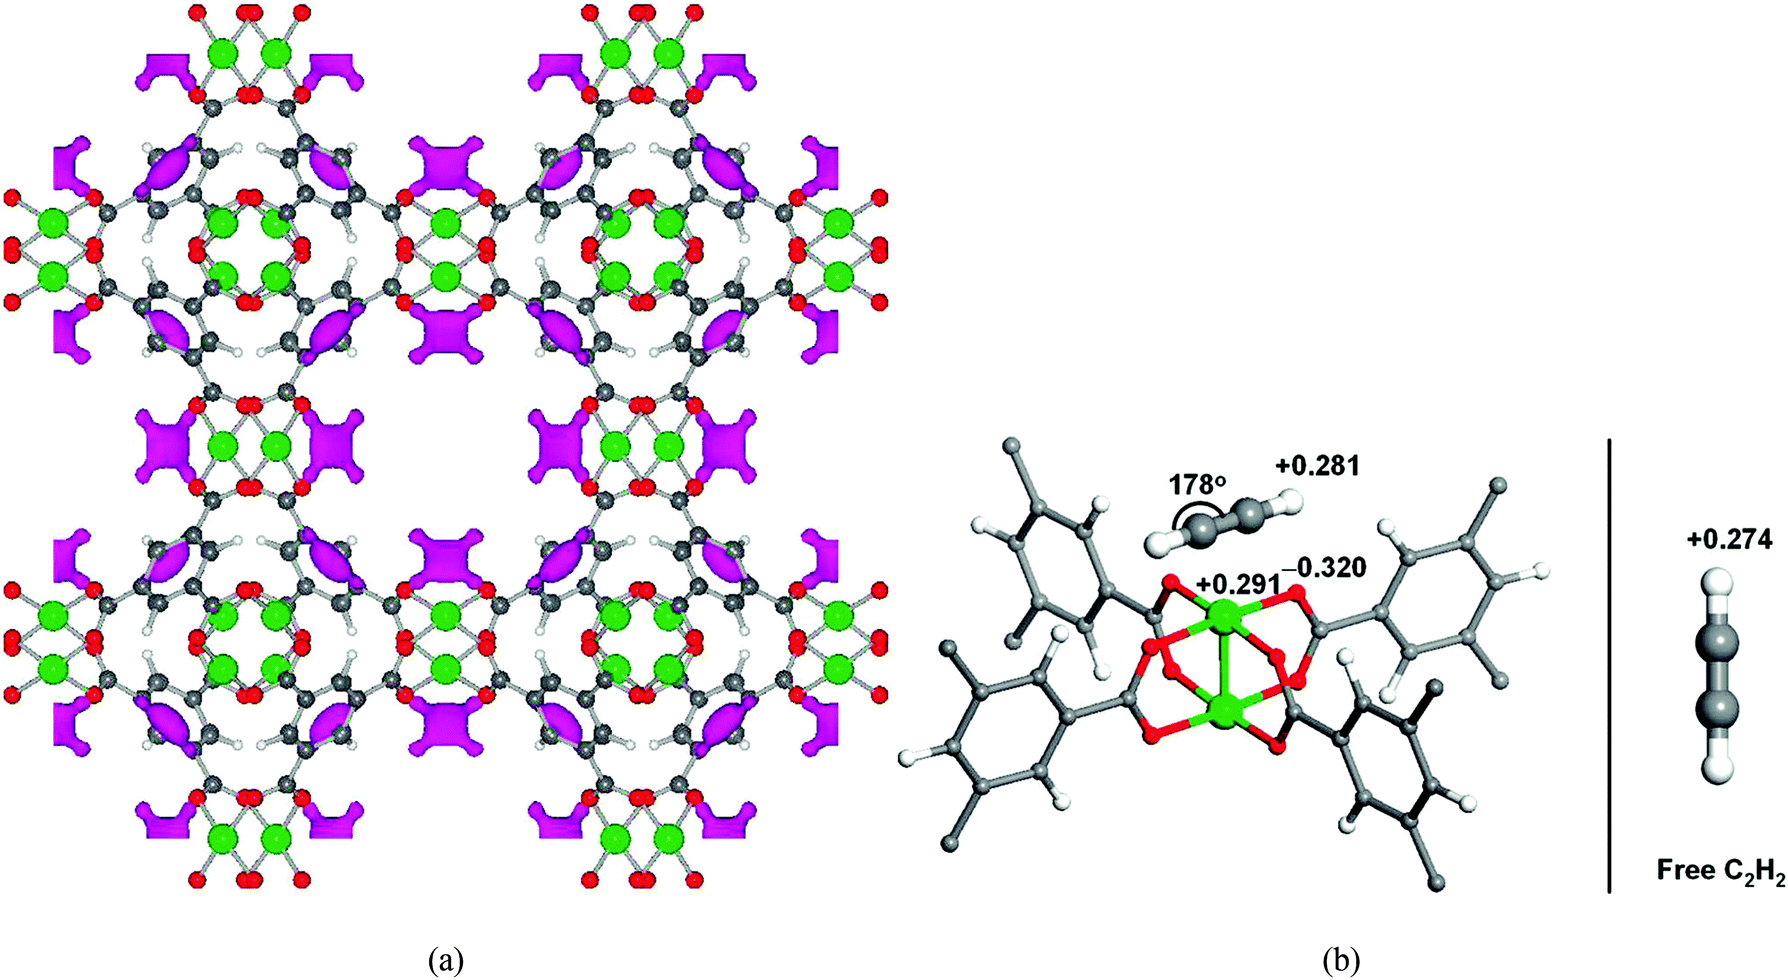 | ||
| Fig. 6 (a) Positive difference Fourier map of 0.62 C2D2 per Cu loaded [Cu3(BTC)2] calculated from NPD data. The pink regions indicate adsorbed C2D2 molecules bound to the first strongest adsorption sites at the open Cu(II) (color scheme: Cu, green; O, red; C, dark grey. Atoms are not drawn to the scale). (b) Projected Löwdin charges of the C2H2 molecule adsorbed at the open Cu(II) sites in [Cu3(BTC)2]. The adsorbed C2H2 is slightly distorted with induced dipole moment, which enhances the electrostatic interaction with the open metal charges (left). For comparison, the Löwdin charge of the H atom in a free C2H2 gas molecule is also shown (right). Reproduced from ref. 18 with permission from the American Chemical Society. | ||
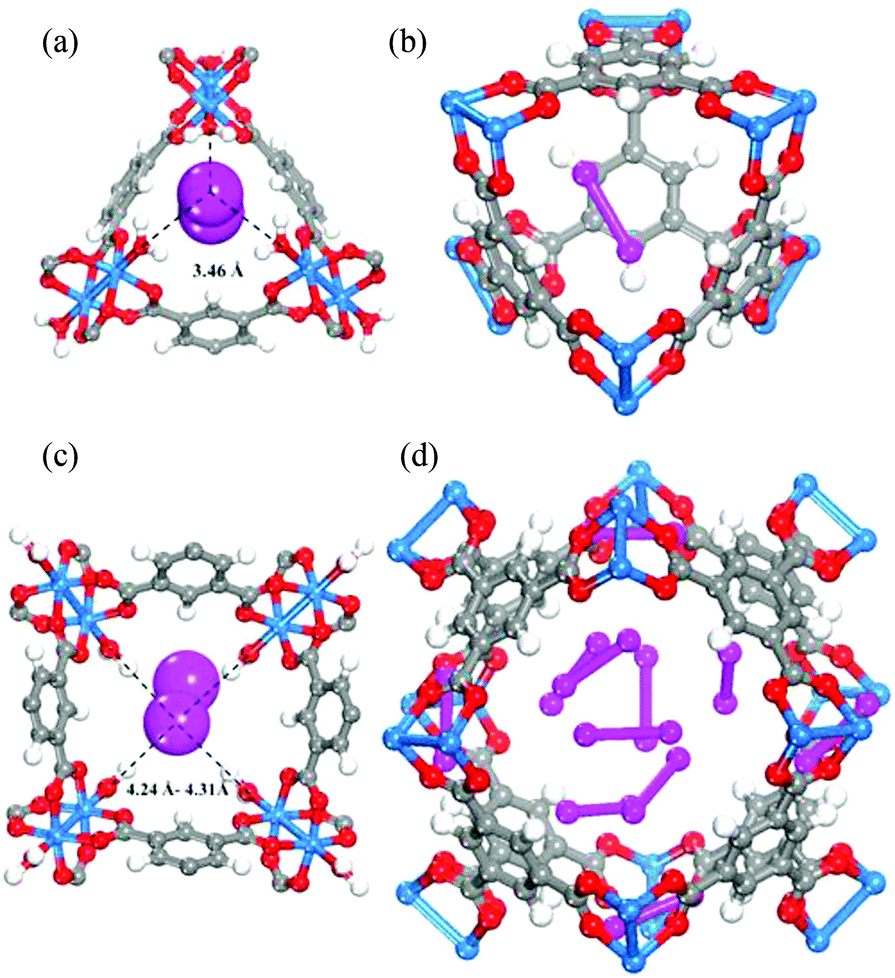
[Cu3(BTC)2] has been investigated for its applications in the capture of I2 as a nuclear fission product and the adsorption of I2 vapour in the presence of moisture has been assessed.19 A gas stream containing I2 and water was used for the adsorption experiment as a model of the mixed gas streams in nuclear energy industrial processes. Synchrotron-based powder X-ray diffraction (PXRD) data on [Cu3(BTC)2] loaded with different amounts of I2 were collected. Due to the strong scattering nature of I2, structural analysis clearly identified two significant I2 adsorption sites in this porous host (Fig. 7). The wet gas stream results in binding of water to the apical sites of the Cu(II) paddlewheels such that the primary binding sites of I2 were located within the smallest cage, close to the [Cu2(OOCR)4] units, with an I⋯O interactions in the range of 3.23–3.30 Å. Another adsorption site was found in the intermediate sized pore with longer contacts between the I2 and [Cu2(OOCR)4] units and the BTC3− rings (3.47–4.31 Å). The study identified an arrangement of adsorbed I2 within the 11 Å pore that creates a hydrophobic-like barrier that inhibits further adsorption of water molecules inside the hydrophilic cavities in [Cu3(BTC)2].
 | ||
| Fig. 7 I2 adsorption sites within [Cu3(BTC)2] revealed by Rietveld refinement of the synchrotron PXRD of I2-loaded samples. (a) I2 residing in the triangular window; (b) one I2 molecule within the smallest cage; (c) I2 in the square window; (d) snapshot of the I2 arrangement in the 11 Å cage. Atom colour scheme: fuchsia = I, blue = Cu, grey = C, red = O, and white = H. Reproduced from ref. 19 with permission from the American Chemical Society. | ||
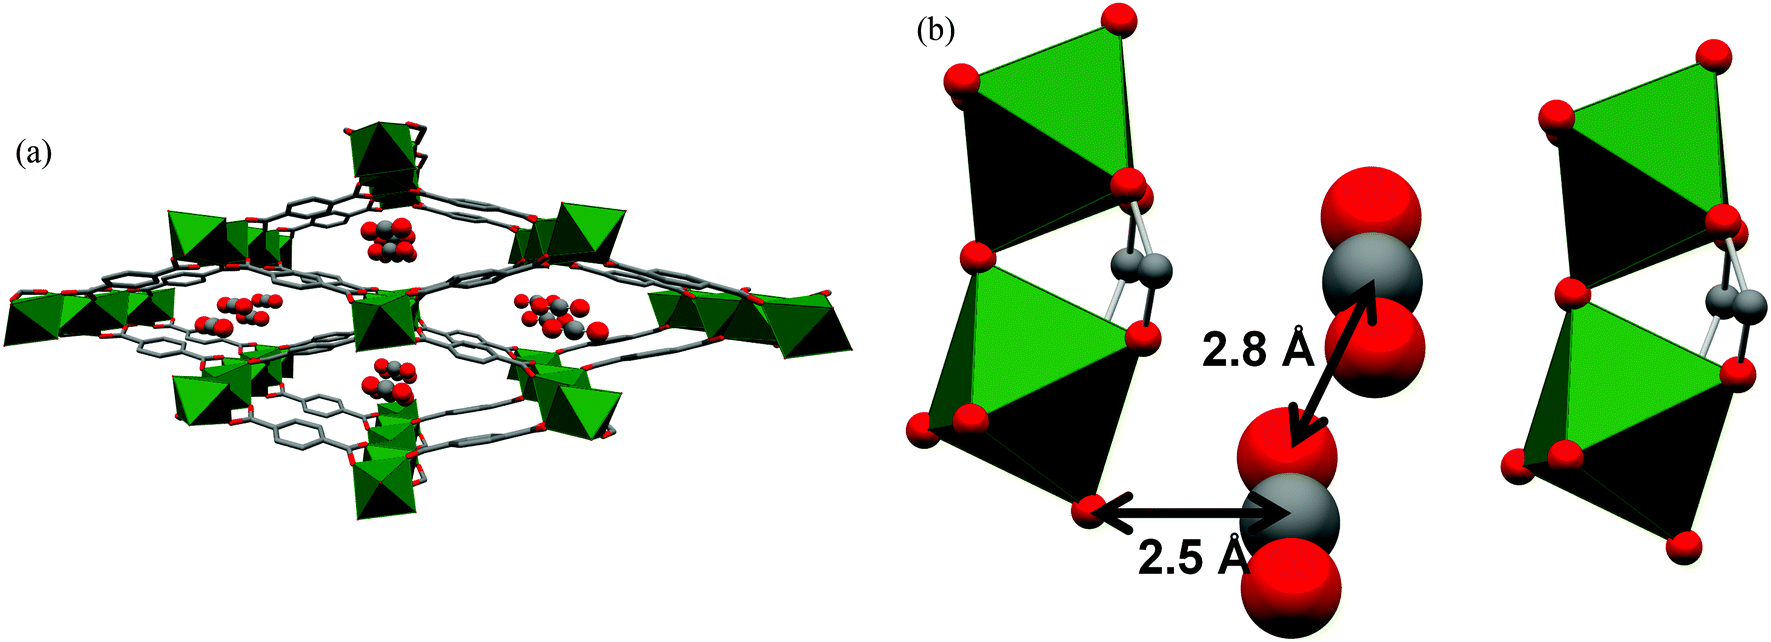
The Cr(II) analogue, [Cr3(BTC)2], is isostructural with [Cu3(BTC)2], and its O2 binding properties have been analysed.20 [Cr3(BTC)2] exhibits exceptional O2/N2 selectivity. Rietveld analysis of the NPD data of O2-loaded [Cr3(BTC)2] at a coverage of ∼1.0 O2/Cr revealed that the strongest O2 binding sites are the open Cr(II) sites, with a short distance between Cr(II) and the centroid of O2 of 1.97(5) Å (Fig. 8). The second O2 adsorption site was sited at the triangular window of the smallest cage, an observed binding site of [Cu3(BTC)2].
 | ||
| Fig. 8 (A) View of structure of [Cr3(BTC)2] with adsorbed O2 at the open Cr(II) sites. Rietveld refinements of NPD data revealed that the Cr–Cr distance lengthens from 2.06(2) Å in the activated form (B) to 2.8 Å in (C) upon coordination of O2. Colour scheme: Cr, green; O, red; C, grey. Reproduced from ref. 20 with permission from the American Chemical Society. | ||
A range of porous MOFs of Cu(II) with isophthalate linkers have been investigated for their H2 adsorption properties.4 Two isophthalate units can be linked linearly through a functionalised central core to generate a series of aromatic tetracarboxylate linkers with various functionalities, and these materials incorporating [Cu2(OOCR)4] paddlewheels exhibit high H2 storage capacities, up to an uptake of 77.8 mg g−1 at 77 K, 60 bar. NPD was used to determine the H2 adsorption sites in MFM-101 (MFM = Manchester Framework Material, replacing the NOTT designation) and the structural refinement identified three distinct binding sites.21 The first adsorption site was located at the axial position of the [Cu2(OOCR)4] paddlewheel with a Cu–D2 (centroid) distance of 2.50(3) Å, slightly longer than that observed in [Cu3(BTC)2] (2.40 Å). This type of D2–Cu interaction is not of the “Kubas” type σ-bond binding.22 Two other adsorption sites were located at the middle of the triangular [(Cu2)3(isophthalate)3] window and in the cusp of three phenyl rings (sites II and III, Fig. 9), respectively, with both residing on the same 3-fold symmetry axis. Site occupancy analysis indicates that the open Cu(II) site does not show significantly higher binding affinity to D2 than the other two identified sites.
 | ||
| Fig. 9 Structure of MFM-101 and the three identified D2 adsorption sites in MFM-101 by NPD. Reproduced from ref. 21 with permission from the American Chemical Society. | ||
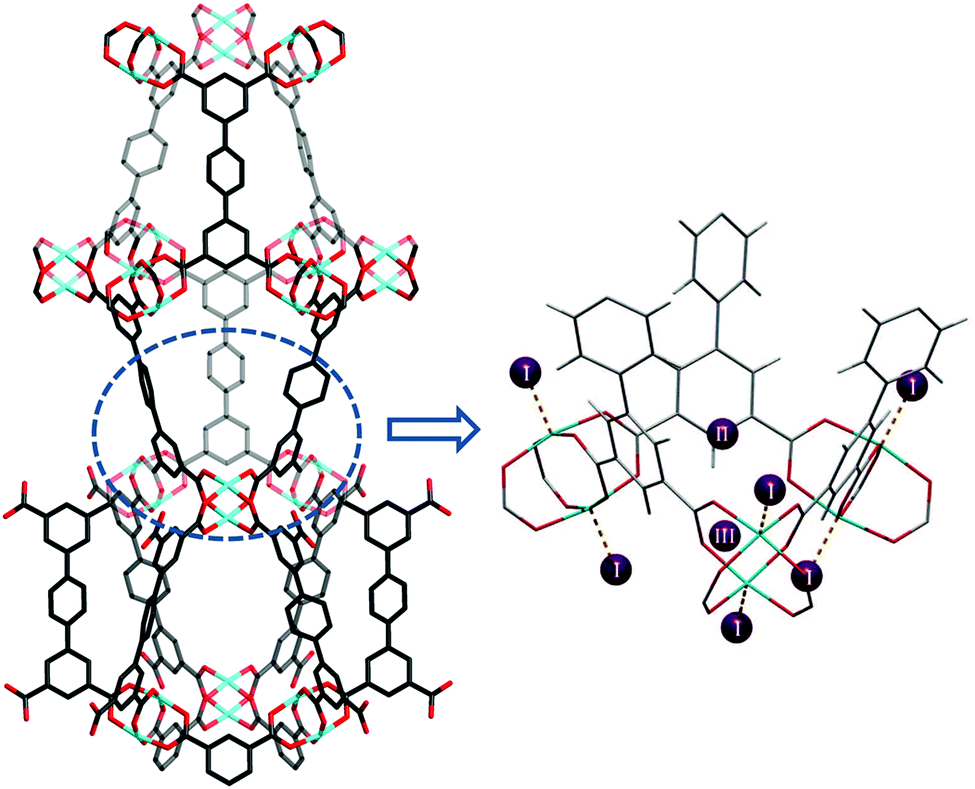
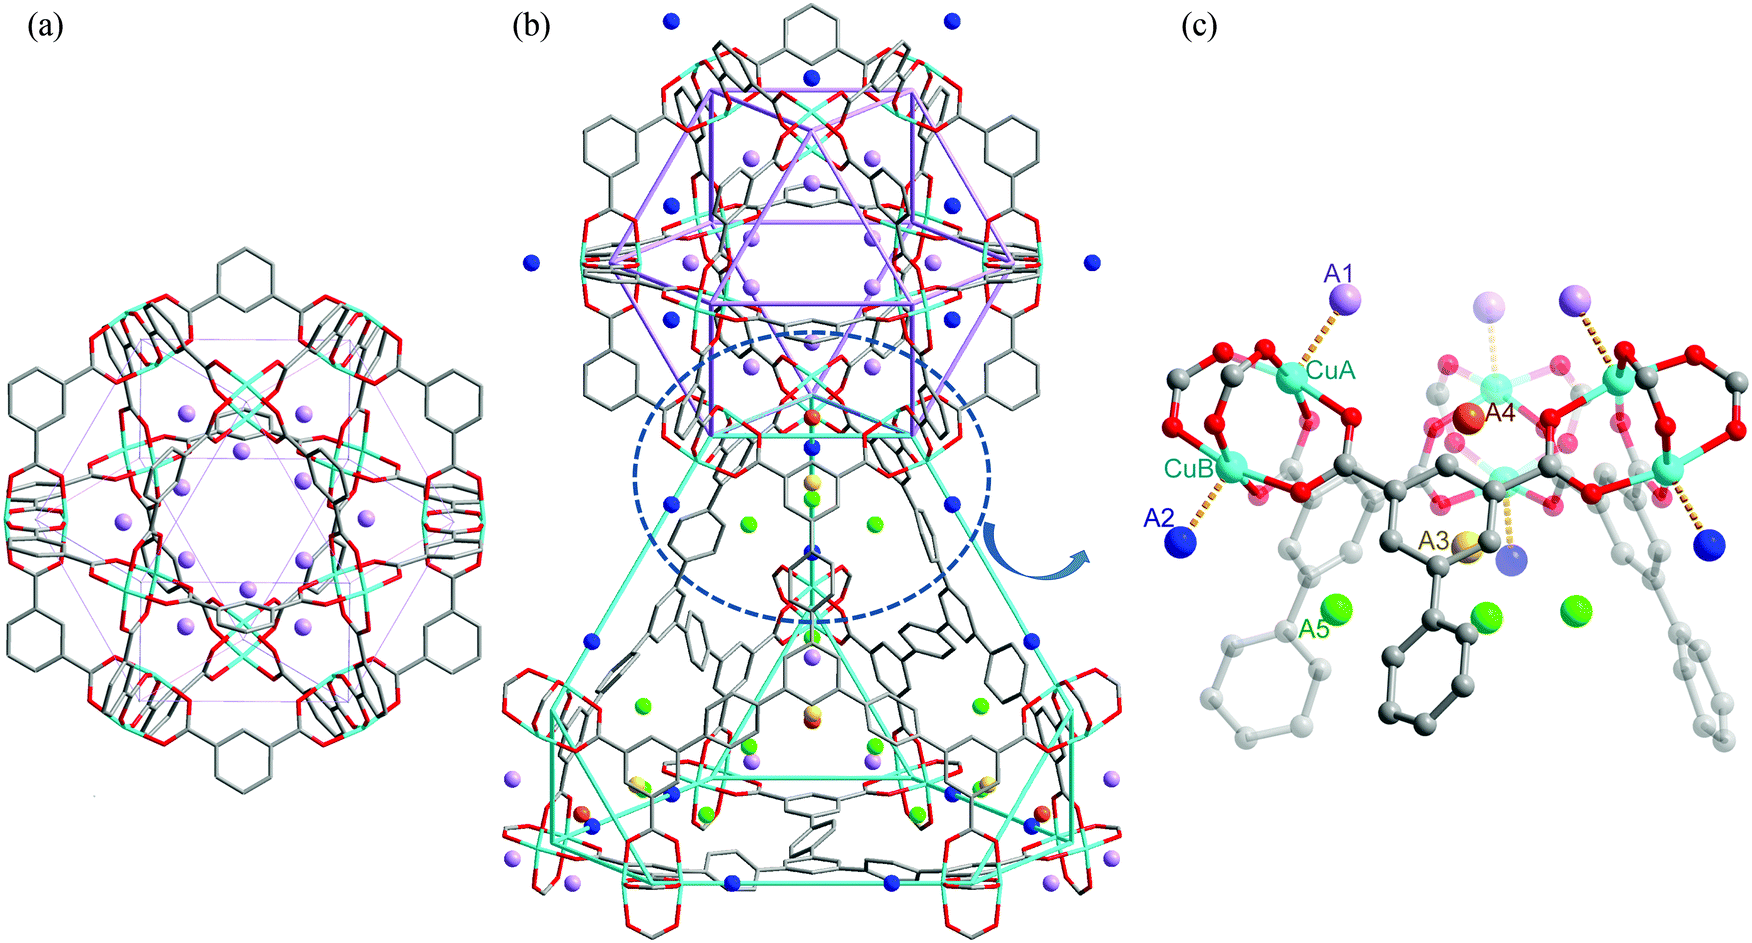
Tri-branched hexacarboxylate linkers with three isophthalate units connected through a central core in a coplanar fashion have been widely developed for the construction of highly porous (3,24)-connected networks.23 These MOFs show exceptionally high porosity and gas sorption capacities. One archetype of this series is MFM-112, assembled from a C3-symmetric aromatic hexacarboxylate linker and [Cu2(OOCR)4] paddlewheels.24 MFM-112 is constructed by three different cages: cage A, a cuboctahedron containing of 24 isophthalate units and 12 [Cu2] paddlewheels; cage B, a truncated tetrahedron comprising four hexagonal linker faces and four triangular windows; and cage C, a truncated octahedron formed by eight linker faces and six square windows. MFM-112 shows both high H2 adsorption at low and high pressures at 77 K: 23 mg g−1 at 1 bar and 111 mg g−1 at 77 bar. NPD studies revealed an interesting difference between the two Cu(II) ions of the same [Cu2(OOCR)4] moiety in terms of their interaction with D2 molecules.15 The Cu(II) ions inside cage A (CuA) show a higher binding energy towards D2 molecules than the Cu(II) centres at the exterior of the cage (CuB) [CuA–D2(centroid) 2.23(1) Å vs. CuB–D2(centroid) 2.41(1) Å] (Fig. 10). This study provides the first direct structural evidence demonstrating that a specific geometrical arrangement of open Cu(II) sites within the [Cu24(isophthalate)24] cuboctahedral cage strengthens the interactions between D2 molecules and the coordinatively unsaturated metal sites. Three other adsorption sites were identified at higher loadings, with two residing in the triangular opening and one located within cage B close to the 3-fold axis of the window.
 | ||
| Fig. 10 Views of D2 positions in the desolvated framework MFM-112. (a) D2 positions in the cuboctahedral cage at a loading of 0.5 D2/Cu; (b) D2 positions in cage A and cage B at a loading of 2.0 D2/Cu; (c) view of five D2 positions (A1, A2, A3, A4, and A5) at a loading of 2.0 D2/Cu (grey, carbon; red, oxygen; turquoise, copper). The D2 positions are represented by colored spheres: A1, lavender; A2, blue; A3, yellow; A4, orange; A5, green. Reproduced from ref. 15 with permission from the American Chemical Society. | ||
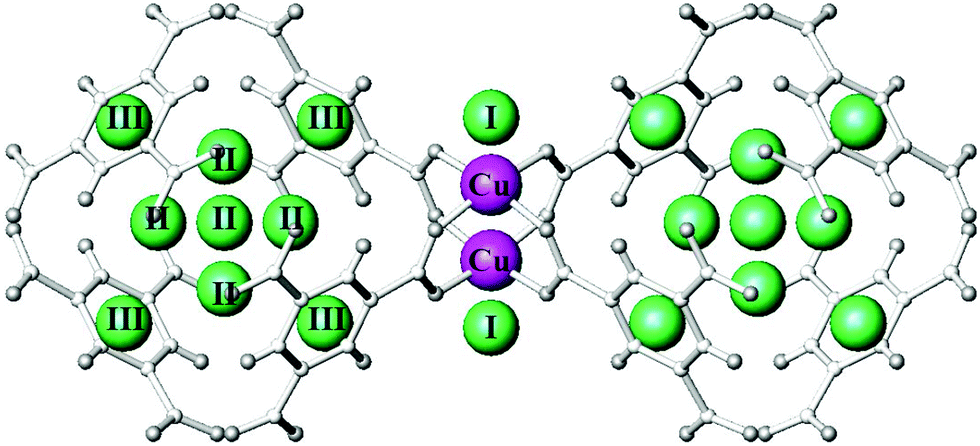
A tetrazolate linker has been used to synthesize the robust sodalite-type framework HCu[(Cu4Cl)3(BTT)8]·3.5HCl (Cu-BTT, BTT3− = 1,3,5-benzenetristetrazolate).25 The NPD study on the D2-loaded sample demonstrated that D2 molecules directly bind to unsaturated Cu(II) ions, revealing a Cu–D2 (centroid) distance of 2.47 Å (Fig. 11). The observed Cu–D2 distance is slightly elongated compared to the Mn–D2 distance of [2.21 Å] and the Fe–D2 distance [2.17(5) Å] found in the structural analogues Mn-BTT26 and Fe-BTT,27 respectively, probably due to the Jahn–Teller effect of the Cu(II) ions. Three additional D2 binding sites were identified in Cu-BTT. Site II resides in the pocket of four tetrazolate units with distance of 3.46 Å from the framework Cl− ion. Site III and IV, occupied at higher loadings, are located within van der Waals contact of two tetrazolate rings (site III) or benzene rings (site IV).
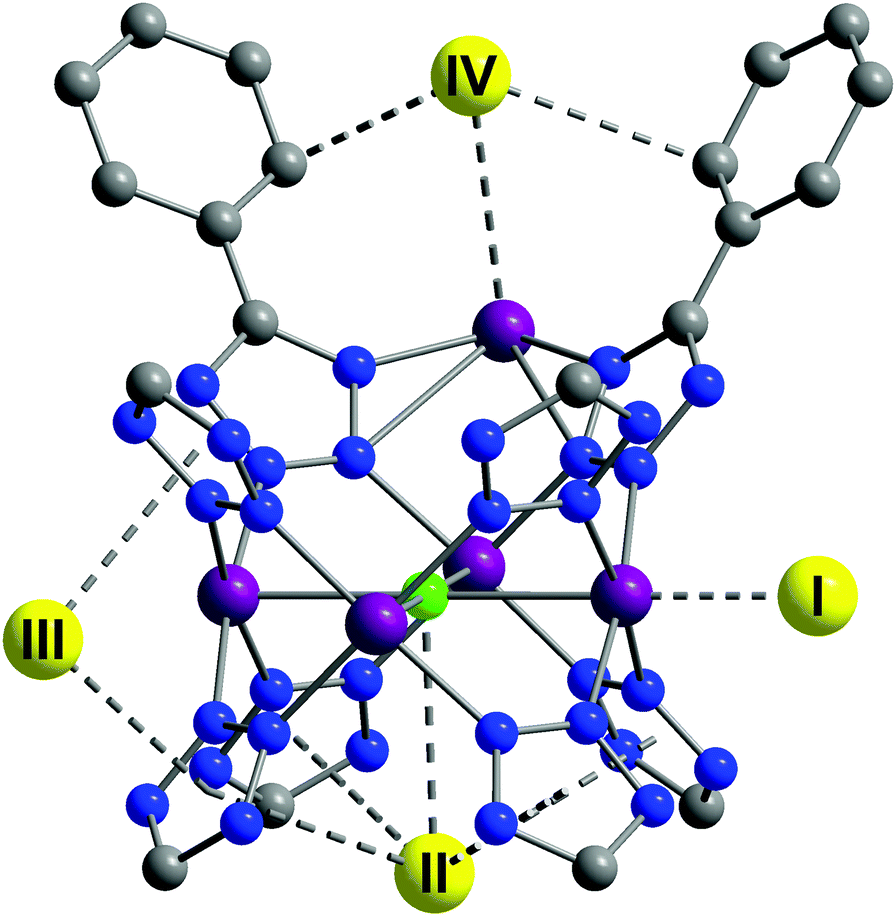 | ||
| Fig. 11 D2 adsorption sites in Cu-BTT, as revealed by NPD. Purple, green, blue, and grey spheres represent Cu, Cl, N, and C atoms, respectively; hydrogen atoms are omitted for clarity. Yellow spheres show the centroids of adsorbed D2 molecules. Reproduced from ref. 25 with permission from John Wiley and Sons. | ||
One of the small gas molecules that has attracted recent and growing attention is CO, a key chemical feedstock. One of the primary issues in utilising the massive quantities of CO produced as a bi-product of industrial processes, or as syngas, is the separation of CO from other gases (e.g. N2, or H2 in the syngas case). Long et al. have recently described further developments in this area in which they have demonstrated that the binding energy of CO with the open metal sites of MOF-74-M (M = Mg, Mn, Fe, Co, Ni, Zn) follows the Irving–Williams order of stability.28 A further notable example of CO binding with promising separation capability in a dynamic MOF material is described in this section.
In 2014, Kitagawa et al. described a remarkable dynamic MOF, [Cu(aip)] (aip2− = azidoisophthalate), that exhibits excellent separation of CO from N2 by an unusual mechanism in which the interaction of CO with the framework causes a macroscopic structural change.29 This comes about because the isolated [Cu2(OOCR)4] paddlewheels within the as-synthesised material respond to removal of solvent by twisting to form infinite chains of paddlewheels coordinated axially via one of the carboxylate oxygens of the nearest paddlewheel, reducing the solvent-accessible volume from 38% to 25% of the unit cell. The adsorption of N2 and CO by the desolvated material show markedly different behaviour: the N2 uptake is unremarkable but the adsorption isotherm of CO shows both stepped and strongly hysteretic behaviour (Fig. 12).
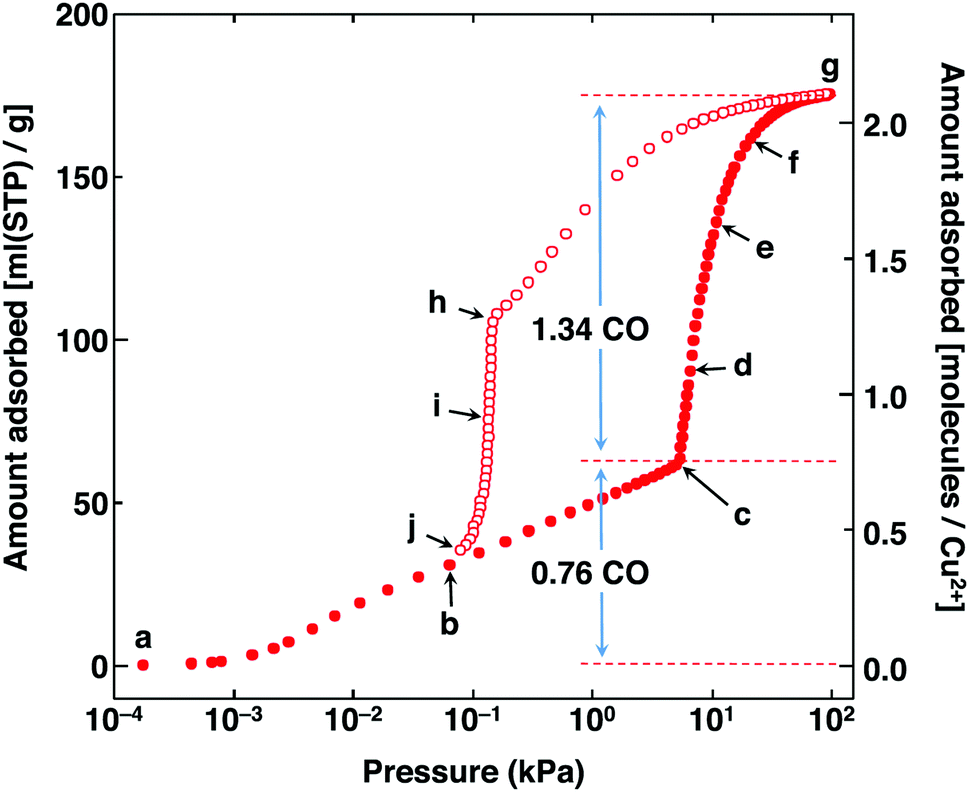 | ||
| Fig. 12 CO sorption isotherm in [Cu(aip)] at 120 K. Adsorption is shown in solid circles and desorption in open circles. Reproduced from ref. 29 with permission from the American Association for the Advancement of Science Chemical. | ||
In situ PXRD and IR studies demonstrated that above a threshold pressure of ∼1 bar, the framework undergoes a significant phase change to a more open form that closely resembles the as-synthesised material, with CO bound to the axial positions of the [Cu2(OOCR)4] paddlewheels, and located in the newly re-opened channels of the material (Fig. 13). This was confirmed by Rietveld refinement of the synchrotron PXRD data for the CO-loaded material. Notably, on testing CO and N2 uptake from a range of mixtures of the two gases, it was concluded that even in the open form, N2 is not efficiently absorbed. This was rationalised by the presence of three weakly coordinated CO molecules surrounding the channel that sterically block access to the N2 molecules. This study, therefore, provides a detailed analysis and explanation at the molecular level of the observed highly selective adsorption of CO at 120 K.
 | ||
| Fig. 13 Single crystal X-ray structures of CO-loaded [Cu(aip)]. (A) Top and (B) side views of CO adsorbed within channel. (C) Top and (D) side views of CO-adsorbed channel with van der Waals surfaces depicted in light blue. Atoms are coloured as follows: Cu, green; C, grey; N, blue; O, red; H, white. Coordinated (grey and red) and non-coordinated (yellow) CO molecules are shown in a CPK model. In (D), part of the aryl moieties has been omitted for clarity. Reproduced from ref. 29 with permission from the American Association for the Advancement of Science. | ||
In addition to the numerous other Cu(II)-based MOFs, we note that a number of key studies on the location and dynamics of guest molecules have also been reported on Zn(II)-based MOFs, in some cases as analogues of Cu(II) frameworks (e.g., with the BTC3− linker).30–32 The majority of these experiments have already been reviewed extensively.
2.2 The MOF-74/CPO-27, [M2(dobdc)] (dobdc4− = 2,5-dioxidobenzene-1,4-dicarboxylate) series
The MOF-74/CPO-27 series of MOFs having the stoichiometry [M2(dobdc)] (M = Mg, Mn, Fe, Co, Ni, Cu, Zn; dobdc4− = 2,5-dioxido-1,4-benzenedicarboxylate) were first reported in 2005 by Yaghi et al.33,34 (MOF-74-Zn) and by Fjellvåg et al.35,36 (CPO-27-Co and CPO-27-Ni) and have become one of the most extensively studied systems. The as-synthesised MOF comprises [M2(C8H2O6)(solv)2]∞ moieties that form a 3D honeycomb structure containing 1D hexagonal pore channels bounded by dobdc4− ligands which bridge M(II) ions (Fig. 14).37 All the ligand oxygen atoms are involved in coordination to the M(II) centres and the resulting MO5 units commonly have the sixth coordination site occupied by a solvent (water or DMF) molecule which points into the channels. The M–O bond trans to coordinated solvent is typically elongated, as is the M–O bond to the solvent, affording a distorted octahedral coordination geometry. One of the carboxylates coordinates via both oxygen atoms, while the other carboxylate bridges two metal atoms, as do the hydroxy oxygens. These M(II) octahedra are linked by alternating adjacent and opposite edge-sharing resulting in a helical arrangement of metal ions down the c-axis, parallel to the channels. | ||
| Fig. 14 Views of the crystal structure of dehydrated MOF-74-Ni. (a) The coordination sphere at Ni(II) showing the square pyramidal structure; (b) chains of Ni(II) centres running along the c axis; (c) dobdc4−; (d) the overall honeycomb structure. The C atoms are shown in grey, H in white, O in red, and Ni in blue. Reproduced from ref. 37 with permission from Elsevier. | ||
A number of studies have investigated the binding of small molecules to the vacant metal sites in MOF-74 and a systematic review of techniques, molecules and approaches to this family of MOFs was published by Valenzano et al. in 2012.37 Since 2006, water and CO binding have been thoroughly investigated, but by far the most studied small molecules are H2 and CO2, particularly in the Mg, Ni and Zn-based materials. In recent years hydrocarbon binding has become an area of intense investigation, with reports of binding and/or separation experiments with all the MOF-74 series. Here we focus the discussion on the most recent examples of guest binding in MOF-74 materials.
The binding of NO to MOF-74 was first described by Bordiga et al. in 2008.38 In a study which employed structural (EXAFS, XRD), vibrational (IR, Raman) and electronic (UV/vis, XANES, emission) techniques they investigated the formation of the 1![[thin space (1/6-em)]](https://www.rsc.org/images/entities/char_2009.gif) :1 adduct of NO with open metal sites in MOF-74-Ni. Adduct formation was found to cause a large perturbation of the vibrational and electronic properties of the framework compared to the dehydrated state, and the bound NO was slowly displaced by water, leading to a potential application for this material as an NO delivery agent in biological tissues.
:1 adduct of NO with open metal sites in MOF-74-Ni. Adduct formation was found to cause a large perturbation of the vibrational and electronic properties of the framework compared to the dehydrated state, and the bound NO was slowly displaced by water, leading to a potential application for this material as an NO delivery agent in biological tissues.
The separation of O2 and N2 is a major industrial process that is currently undertaken using energy-intensive cryogenic distillation processes.39 The use of zeolites which selectively adsorb N2 over O2 in medical devices is one approach, but this is limited by poor selectivity.39 The use of MOF-74-Fe as an O2 selective adsorbent was reported in 2011 and at 298 K the material has an O2 capacity of 9.3 wt% corresponding to one oxygen molecule per two Fe(II) centres.40 This capacity doubles at 211 K, with both Mössbauer and infrared spectra consistent with partial charge transfer from Fe(II) to O2 at low temperatures. At room temperature the spectra show complete charge transfer to form Fe(III) and O22−. This interpretation was confirmed by NPD data analysis which revealed a symmetric side-on binding mode for O2 at low temperature and a ‘slipped’ side-on binding mode in the room temperature structure. In contrast N2 was found to adopt an end-on coordination mode to the M(II) centre (Fig. 15). Experimentally, the selectivity factor for adsorption of O2 over N2 at 298 K was calculated to be 7.5 in MOF-74-Fe, but while this is among the highest reported for MOF materials,41–47 the binding of O2 at this temperature was irreversible and attempts to remove it via heating under vacuum resulted only in decomposition of the framework lattice. In contrast, reversible O2 binding with retention of the framework structure was achieved at lower temperatures (201–226 K) and hence breakthrough O2/N2 measurements were simulated at 211 and 226 K, with the results suggesting that MOF-74-Fe could make an excellent O2 selective adsorbent in a modified vacuum-swing adsorption process.
 | ||
| Fig. 15 Views of the coordination spheres for the Fe(II) centres in MOF-74-Fe and the O2- and N2-adducts. Orange, blue, and red spheres represent Fe, N, and O atoms, respectively. The structures depicted are for samples under vacuum (upper left), dosed with N2 at 100 K (upper right), dosed with O2 at 100 K (lower left), and dosed with O2 at 298 K (lower right). All diffraction data were collected below 10 K. Reproduced from ref. 40 with permission from the American Chemical Society. | ||
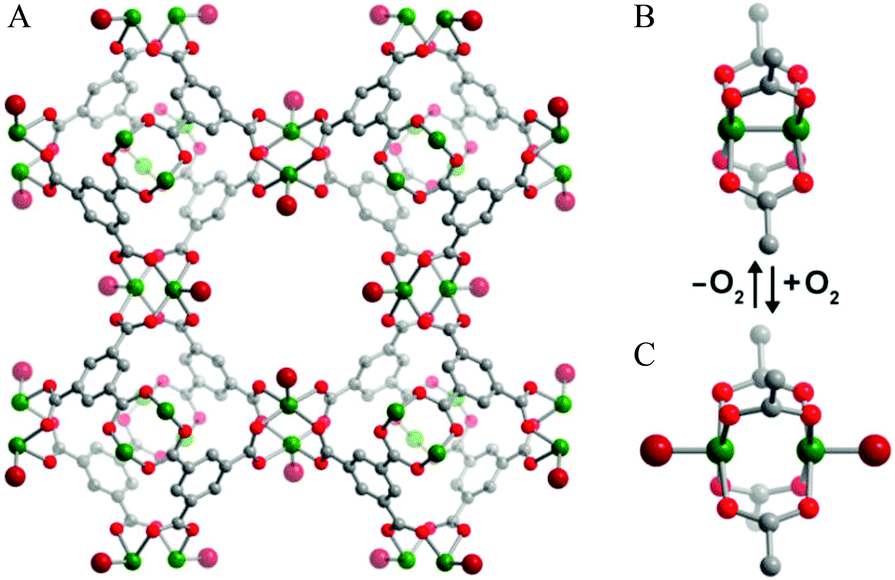
Binding of N2O in MOFs has not been widely studied. The oxidation of Fe(II) in MOF-74-Fe to Fe(III) and or Fe(IV) species by N2O has been reported, with the latter Fe(IV) complex catalysing oxygenation of ethane to ethanol.48 At room temperature, MOF-74-Fe displays reversible adsorption of N2O, and NPD on an N2O-loaded sample reveals a mixture of 60% of η1-O bound and 40% of η1-N bound species, with Fe(II)–N2O distances of 2.42(3) and 2.39(3) Å, respectively (Fig. 16). The oxidation process only occurs at higher temperatures, and passing a stream of N2O through a fix-bed of MOF-74-Fe at 60 °C converts [Fe2(dobdc)] to [Fe2(OH)2(dobdc)], with PXRD confirming the presence of a terminal hydroxide bound to Fe(III) in the latter species. Because this oxidation reaction employs a two-electron oxidant, it is likely that the an intermediate Fe(IV)-oxo species is produced; however, the Fe(IV) species could not be identified or isolated from the reaction. It is this Fe(IV)-oxo species that is believed to catalyse C–H activation and oxidizes ethane to ethanol (Fig. 16). Although the catalytic yield is too low (1%) for practical applications, the study demonstrates that the system is catalytic if competing substrates are excluded.
 | ||
| Fig. 16 View of structures for N2O bound to MOF-74-Fe obtained from NPD data collected at 10 K. Orange, grey, dark blue and red spheres represent Fe, C, N and O, respectively; H atoms are omitted for clarity. Reproduced from ref. 48 with permission from the Nature Publishing Group. | ||
The binding and selective separation of hydrocarbons including ethane/ethylene/acetylene and propylene/propane is an area in which the use of MOFs has grown rapidly in the last few years49–51 and a comprehensive review by Chen et al. was published in 2012.52 Reports of hydrocarbon binding and separations utilising MOF-74 include IR,53,54 EXAFS,53 computational,37,49,55–58 breakthrough59–61 and NPD studies.59,60 The possibility of hydrocarbon separations in MOF-74 was proposed in 2011 in a study by Deng et al., in which they explored the feasibility of using MOF-74-Mg to separate ethane, ethylene, propane and propylene by measuring their individual adsorption equilibria and kinetics supported by simulations.56 The binding of light hydrocarbons in MOF-74-Fe was addressed59 by in situ NPD experiments in which desolvated MOF-74-Fe was dosed with the pure deuterated gas (i.e., acetylene, ethylene, ethane, propane, and propylene) at 300 K and then cooled to 4 K for data collection. In all cases only one adsorption site was identified, at the open metal site of the material, shown for each hydrocarbon in Fig. 17. The study revealed binding between MOF-74-Fe and unsaturated hydrocarbons via the specific π-interactions which underpin the excellent separation between alkanes and alkenes, and the much poorer separation between alkynes and alkenes. Continuing research in this area has focussed primarily on (i) better understanding the binding dynamics of adsorbed hydrocarbons in MOF-74-M,49,57,58,60 and (ii) undertaking practical breakthrough experiments to separate a range of hydrocarbon mixtures.60,61
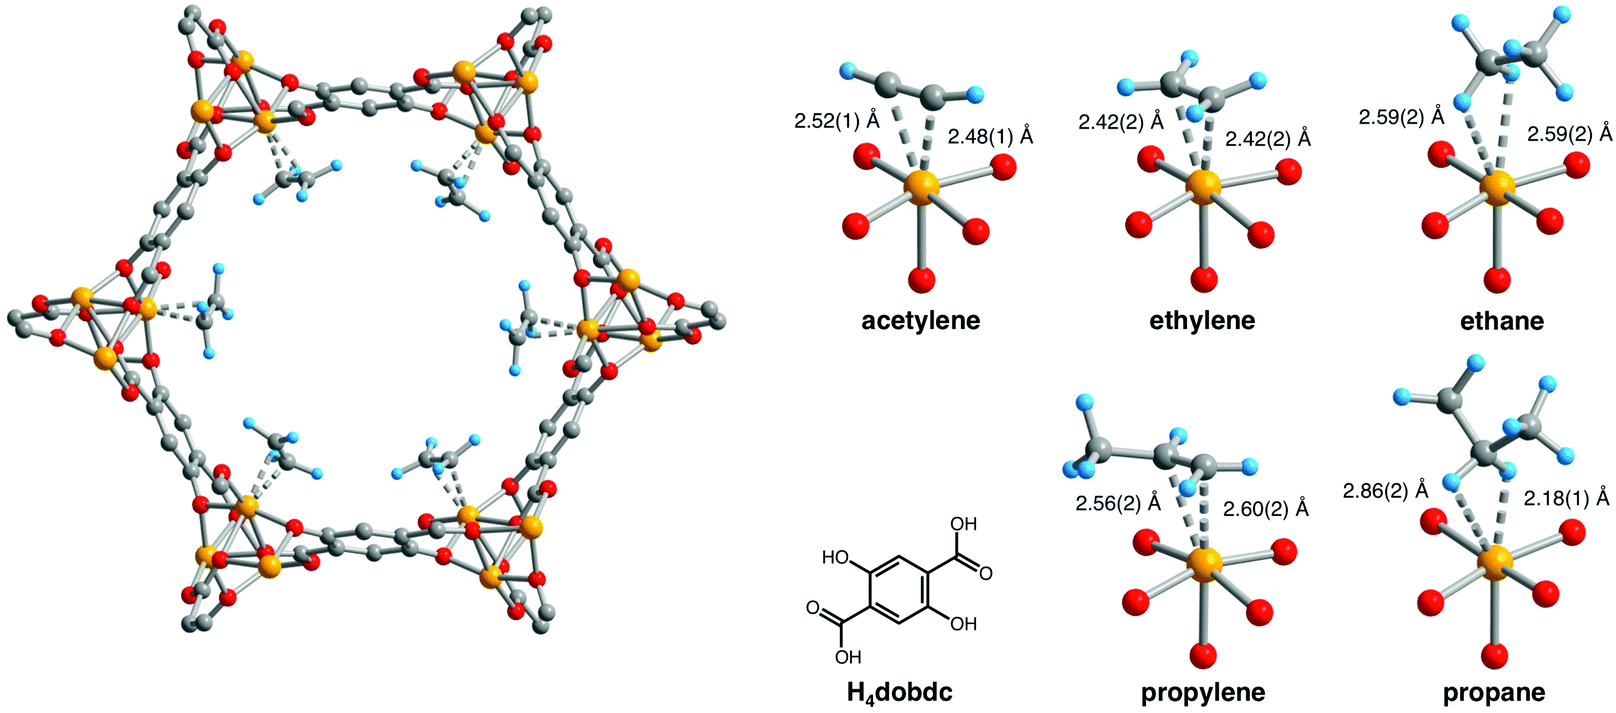 | ||
| Fig. 17 Left: A portion of the solid-state structure of MOF-74-Fe·2C2D4 as determined by NPD; orange, red, grey, and blue spheres represent Fe, O, C, and D atoms, respectively. Right: views of H4(dobdc) and the first coordination spheres for the Fe(II) centres in the solid-state structures obtained upon dosing MOF-74-Fe with acetylene, ethylene, ethane, propylene, and propane. Reproduced from ref. 59 with permission from the American Association for the Advancement of Science. | ||
2.2.2.1 Hydrogen. Several studies have investigated the vibrational properties of adsorbed H2 in MOF-74 materials by IR spectroscopy.62–67 The internal stretch modes of free ortho-H2 (4155 cm−1) and para-H2 (4161 cm−1) are IR inactive, but binding of H–H causes a perturbation that induces a dipole making them IR active. The magnitude of the shift of the IR stretch can be often correlated to the binding energy, while the integrated area of the IR bands corresponds to the loading of H2 within the framework.63,68,69 However, Chabal et al. demonstrated that in MOFs containing fully saturated metal centres the H–H stretch is dominated by the environment (ligands, metal, structure/geometry).70 In 2010, their variable temperature IR (VTIR) spectroscopic and computational study examined MOF-74-M (M = Mg, Co, Ni, Zn) to probe the effect of the unsaturated metal site on the vibrational modes of H2.65 The IR spectra recorded at a low loading of H2 (i.e. H2 adsorbed at the metal site) appear to show a shift of ∼30 cm−1 to lower energy over a wide temperature range (20–300 K), a finding which initially appears to disagree with previous studies that reported a shift of ∼70 cm−1 on H2 adsorption.63,64,67 A shift of ∼70 cm−1 to lower energy was observed by Chabal et al. but only on increasing the loading such that the second oxygen site was occupied. This behaviour was ascribed to a H2–H2 ‘pairing’ interaction between the occupied sites 1 and 2. This perspective was further supported in the observations of Ahn71 and Rowsell72 that there is an unusual behaviour in the binding energies of H2 in MOF-74, as indicated by the H2 isotherms measured at 77 K and low loading, which was tentatively assigned to H2–H2 interactions. Further studies of the IR spectra of MOF-74-Zn at 40 K at a range of H2 loadings,67 confirmed the first binding site to be the open metal centre, with an IR shift of ∼70 cm−1. Once the second binding site starts to be occupied (at a loading of ∼0.85 H2 per Zn), another IR band with a shift of ∼30 cm−1 begins to appear, in line with the traditional assignment of these features. A small but measureable shift (∼2 cm−1) of the initially formed bands on appearance of the second set of bands was observed, which was tentatively ascribed to an H2–H2 ‘pairing’ interaction by comparison with the ∼6 cm−1 red shift of the H2 stretch in the free solid state.
However, strong evidence against the H2 pair formation has been observed by INS experiments, which suggests that the filling of MOF-74 with D2 is sequential without the formation of pairs.71 In 2011, Rowsell et al. published a comprehensive study in which they reported a series of VTIR experiments on MOF-74-M (M = Mg, Mn, Co, Ni, Zn) spanning the temperature range 35–298 K.66 IR spectra were collected at loadings of 0.1 to 3.0 H2 per metal and strongly red shifted IR bands corresponding to isolated H2 molecules bound to the metal sites were observed, with a correlation between the isosteric heats of adsorption and the magnitude of the red shift. Further confirmation of the originally proposed stepwise filling mechanism observed by INS71 was afforded by these VTIR experiments using HD and D2. Subsequent VTIR work by Bordiga et al. on MOF-74-M (M = Mg, Mn, Co, Ni, Zn) has confirmed stepwise filling of H2 and has elegantly demonstrated the ability of the VTIR technique to afford reliable energetic (ΔH0) and entropic (ΔS0) values which can be compared with isosteric heats of adsorption.73 MOF-74-Ni has both the highest adsorption enthalpy for H2 binding (15 kJ mol−1) across the series and correspondingly the highest perturbation of H2 vibrational frequency.
A neutron scattering study of mixtures of D2 and para-H2 in MOF-74-Fe was used to directly investigate the possibility of pair formation.74 The NPD study confirmed sequential site binding of D2 (Fig. 18). The INS spectra of H2-loaded MOF-74-M (M = Fe) at low loadings (<0.5 H2 per metal) are entirely consistent with INS spectra recorded for MOF-74-M (M = Mg, Co, Ni and Zn),71 but show the largest splitting of the J = 1 rotational state reported for this series. It was noted that there appears to be no correlation between the binding strength and the peak position in the INS spectra. This study further confirmed the absence of formation of strong H2 pairs in this system.
 | ||
| Fig. 18 View of MOF-74-Fe loaded with 2.25 D2 per Fe2+ along the [001] direction. Orange, grey, red spheres represent Fe, C, and O atoms, respectively. The box contains a close up view of the framework wall, showing closest D2–D2 and D2–framework interactions (drawn as dotted lines) along the channel. Three D2 sites, determined by NPD, are labelled as I, II, and III in order of binding strength. Reproduced from ref. 74 with permission from the Royal Society of Chemistry. | ||
Quasi-elastic neutron scattering (QENS) has been used to probe the diffusion of H2 through MOF-74-Mg.75 At a low loading of 0.3 H2 per Mg, the QENS spectrum indicated no diffusion of H2 on the picosecond timescale. On increasing the H2 loading, the spectrum progressively broadens. This broadening was fitted to three components corresponding to static H2, H2 diffusing along the pore surface via the adsorption sites, and bulk-like H2 diffusion through the pores. The component of diffusion along the adsorption sites was indicative of liquid-like jump-diffusion without distinct directionality. The diffusion coefficient was of a similar magnitude to H2 diffusing on a carbon surface but an order of magnitude lower than the one-dimensional diffusion of H2 reported in MIL-53(Cr) and MIL-47(V) under similar conditions.76
A variation on the synthesis of MOF-74-M has been developed by employing the regioisomer 4,6-dioxido-1,3-benzenedicarboxylate (m-dobdc4−) in place of the linker 2,4-dioxido-1,3-benzenedicarboxylate (dobdc4−). A family of structural isomers of the MOF-74-M (M = Mg, Mn, Fe, Co and Ni) were prepared77 and these are structurally analogous to MOF-74-M, sharing the same topology and high density of open metal sites, but with different local geometry that subtly alters the electronic properties of the binding sites. By using both X-ray and neutron diffraction techniques combined with INS and IR spectroscopic analyses, three binding sites were identified for H2 within [Co2(m-dobdc)] in a similar arrangement to that of MOF-74 (Fig. 19), but with slightly increased binding enthalpies by 0.4–1.5 kJ mol−1 in comparison to MOF-74-M.
 | ||
| Fig. 19 Views of crystal structures at 10 K of [Co2(m-dobdc)] showing (a) the primary binding site (site I) on the open metal site; (b) binding site II interacting with D2 at site I; (c) binding site III on the aromatic ring in the linker; and (d) binding site IV, interacting with the D2 in site III. Purple, grey, red, and white spheres represent Co, C, O, and H atoms, respectively. Yellow and orange spheres represent D2 molecules. Reproduced from ref. 77 with permission from the American Chemical Society. | ||
2.2.2.2 Carbon dioxide. The series MOF-74-M has been studied extensively in terms of CO2 uptake up to 42 bar.33 Of the MOF-74-M (M = Mg, Ni, Zn) series, MOF-74-Mg shows the highest CO2 uptake (23.6 wt% at 0.1 atm, 35.2 wt% at 1 atm, both at 296 K). This was ascribed at the time to the increased ionic character of the Mg–O bond increasing the adsorption enthalpy at the first binding site.78
Since these first reports, studies exploiting vibrational spectroscopies53,79–81 EXAFS,79in silico calculations,49,79,81–86 neutron experiments,82,87,88 NMR,89–92 and gas adsorption88,93–101 have examined in depth the interactions of CO2, CO, CH4 and H2O with the MOF-74 frameworks. These studies have ranged from fundamental binding interactions to dynamic gas separation experiments. Several significant reviews have subsequently covered the many adsorption studies, including the review by Valenzano et al. of small molecule binding to MOF-74 in 201137 and a review in 2012 by Long et al. specifically discussing CO2 uptake in MOFs.102 Therefore, this section details a limited number of selected examples of recent studies which specifically address the issues of guest binding dynamics.
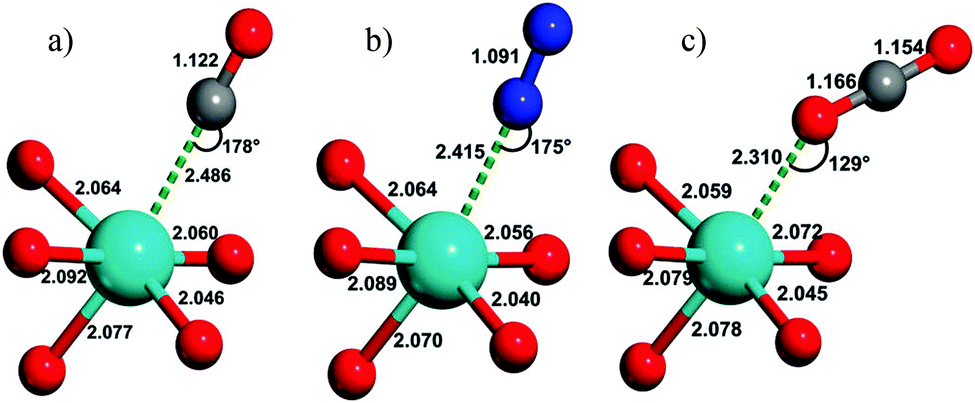
Fig. 20 shows the calculated geometries of MOF-74-Mg adsorption complexes formed with CO, N2 and CO2, reported by Bordiga et al. in 2010.81 CO and N2 form nearly linear Mg(II)⋯CO and Mg(II)⋯N2 complexes, respectively, but CO2 binds at an angle with a Mg⋯O–CO angle of 129° and with a relatively short Mg–O distance (2.310 Å). This angular orientation is ascribed to a lateral electrostatic interaction between the CO2 molecule and the carboxylate oxygen of the framework ligand, which also contributes to the marked increase in the adsorption enthalpy of CO2 in the framework (−47 kJ mol−1) compared with N2 (−21 kJ mol−1) or CO (−29 kJ mol−1), calculated from VTIR measurements.
 | ||
| Fig. 20 Views of the geometry of (a) CO, (b) N2, and (c) CO2 complexes of MOF-74-Mg; magnesium, oxygen, carbon, and nitrogen atoms are cyan, red, grey, and blue, respectively. These have been obtained by ab initio periodic DFT-D calculations. Distances in angstroms (±0.002) and angles in degrees (±1). Reproduced from ref. 81 with permission from the American Chemical Society. | ||
X-ray and neutron diffraction studies by Blom103 and Yildirim82 have confirmed surprisingly large distortions of the O–C–O bond angle from linear (180°) to 162° (in MOF-74-Ni) and 160.5° (in MOF-74-Mg). The latter study ascribed this phenomenon to the bound O-centre being essentially fixed in position with respect to the framework while the rest of the molecule has high orientational disorder leading to an apparent bond bending. The primary CO2 to metal interaction was therefore still regarded as physisorptive.82 In 2011, a second adsorption site for CO2 in MOF-74-Mg was identified using variable temperature NPD measurements (Fig. 21).87 This study also speculated that further filling of the MOF with CO2 would occur via formation of a second layer within the pores. In both binding sites identified in this NPD study, a O–C–O bond angle of 170° was modelled from the 20 K data, less distorted than observed in previous studies.82,103
 | ||
| Fig. 21 Partial structure of MOF-74-Mg loaded with 1.75 CO2 (yellow) per Mg showing the nearest neighbor interactions found between the CO2 sites (I and II) and the framework (left). The structure of MOF-74-Mg loaded with 1.75 CO2 per Mg (viewed along the crystallographic c axis) showing two crystallographically distinct CO2 adsorption sites (right). The second CO2 site was refined anisotropically with the thermal ellipsoids drawn at 50% probability. Reproduced from ref. 88 with permission from the American Chemical Society. | ||
The use of NMR spectroscopy to probe the dynamics, rotation and diffusion of CO2 within MOF-74 has been illustrated via several studies.90,91 For example, 13C NMR line shape and spin–lattice relaxation were used to investigate the motional dynamics of adsorbed CO2 in MOF-74-Mg.90 Uniaxial rotation of 13C-enriched CO2 at the metal-bound site (Fig. 22) was invoked in order to model the variable temperature NMR spectra recorded between 12 and 400 K. The rotational axis was assumed to lie along the Mg–O(CO2) vector, with the simulated angle of rotation of CO2 varying between 56° and 69° from this axis, in line with the observations derived from PXRD and NPD studies of a significant deviation of M–O–C angle from 180°. Significant slowing of molecular rotation was observed at temperatures below 150 K, with rotation essentially ceasing below 100 K. Interestingly, Arrhenius plots of the 13C spin–lattice (T1) relaxation data appear to show two different activation processes operating at different temperatures with the higher energy process dominating at higher temperatures. The onset temperature of the higher activation energy process for 0.3 CO2/Mg (10.0 vs. 4.0 kJ mol−1) coincides with the onset of gaseous CO2 release (300 K), while that for 0.5 CO2/Mg (6.0 vs. 3.5 kJ mol−1) appears to correlate with an NMR line shape change attributed to the change from a single angle rotation of the CO2 to a rotation with ‘slight angle variations’. The lower activation energy for rotation in the higher loading experiment hints at a reduction in Mg(II)–CO2 binding strength as loading increases.90
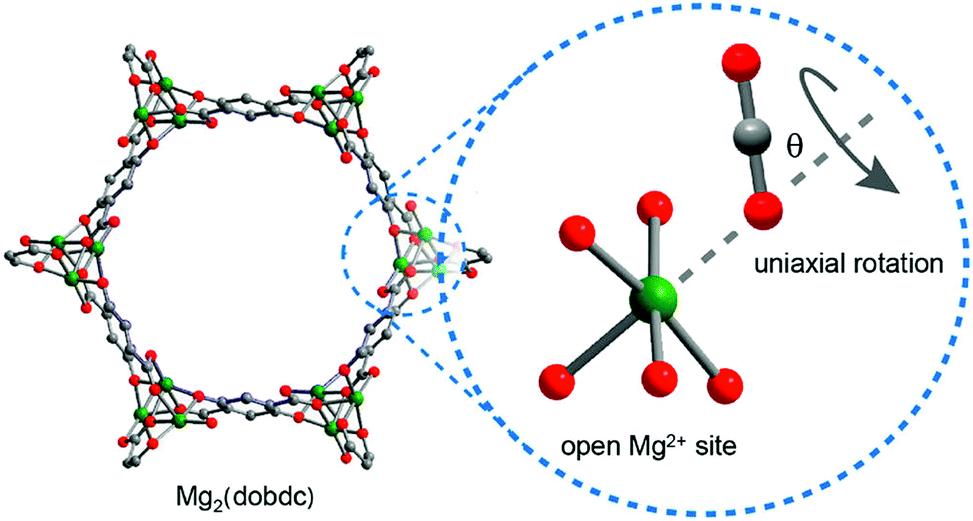 | ||
| Fig. 22 Schematic illustration of CO2 uniaxial rotation at the open Mg(II) site in MOF-74-Mg. Grey, red, and green spheres represent C, O, and Mg atoms, respectively; H atoms are omitted for clarity. Note that the rotation axis is arbitrarily drawn in the picture. Reproduced from ref. 90 with permission from the American Chemical Society. | ||
A number of issues left unresolved by the above study90 were subsequently addressed.91 These problems include the lack of detail as to why two different activation processes should be occurring in CO2-loaded MOF-74-Mg, along with the invocation of a symmetrical uniaxial rotation when the chemical environment is not perfectly symmetric. To address this, the free-energy landscape of CO2 molecules in MOF-74-Mg was investigated from 100 K to 375 K using canonical Monte Carlo (MC) simulations104 at loadings of infinite dilution, 0.3 CO2/Mg and 0.5 CO2/Mg. In this MC simulation, two types of motion (i) a ‘fluctuation’ of the CO2 molecule near the minimum energy bound configuration and (ii) a hopping motion of the CO2 molecule between binding sites were identified (Fig. 23). Comparisons of the MC simulations and NMR data reveal that the former process dominates at lower temperatures (<150 K) and the latter at higher temperatures (>200 K). Importantly, the symmetry of the crystal environment means that the hopping motion of CO2 molecules from site to adjacent site gives an identical NMR profile to that predicted by a uniaxial rotation of 80° about the Mg–O(CO2) vector. Both the calculated and experimental equivalent rotational angles decrease with increasing temperature, an outcome of a thermally activated increase in site-to-site motion along the channels. This demonstrates the complexity of CO2 diffusion dynamics with the hopping motion described herein corresponding well to the first diffusion mechanism proposed by Thonhauser et al.83 for H2, CO2 and H2O, as outlined in Fig. 23.
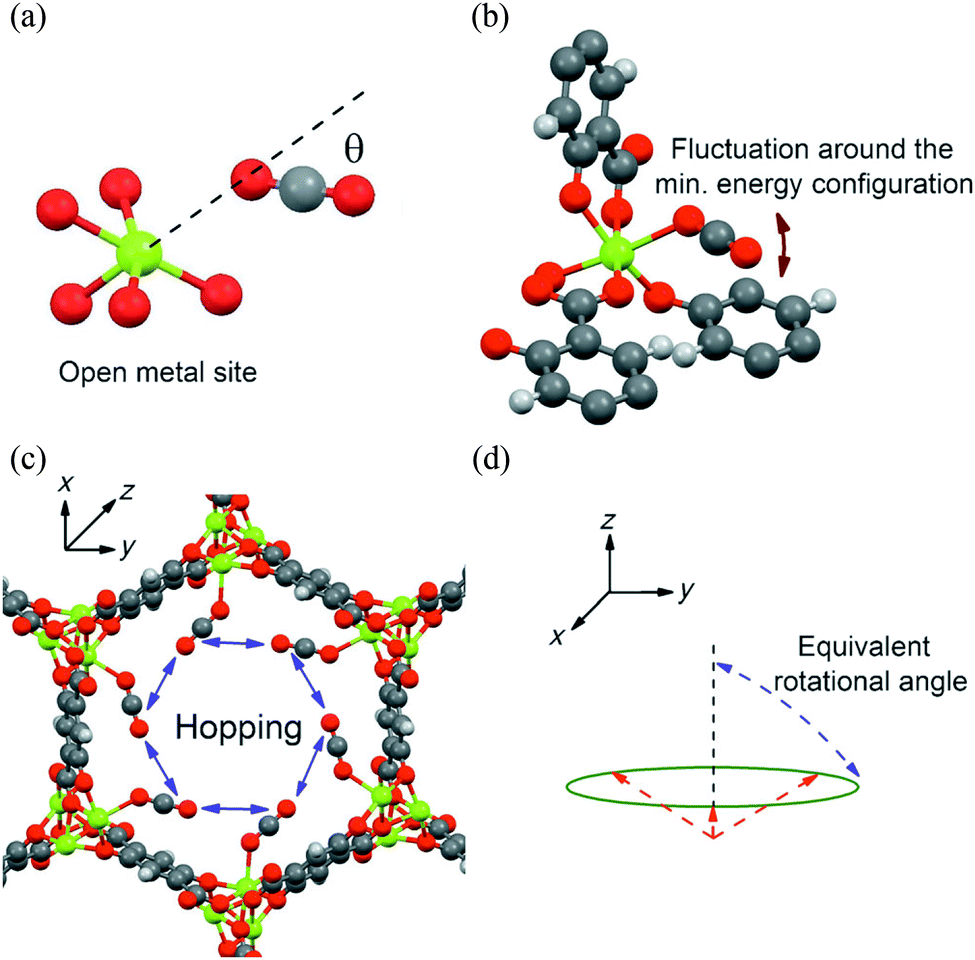 | ||
| Fig. 23 Schematic view of binding and dynamics of CO2 in MOF-74-Mg. (a) Orientation of CO2 (C grey, O red) at the minimum-energy location near a metal site (Mg green); (b) localized CO2 fluctuation motion in which the oxygen atom of the CO2 remains bound to the same metal site, and (c) non-localised hopping motion. (d) From an NMR point of view, the hopping of a CO2 molecule between different metal sites in the x,y plane (see c) is equivalent to a rotation around an axis parallel to the z-axis with an angle referred as the “equivalent rotational angle”. The CO2 molecules (in c) are assumed to be located at their minimum-energy configuration, and are represented by the dashed red lines. Reproduced from ref. 91 with permission from the American Chemical Society. | ||
There are many studies investigating the high selectivity of MOF-74 (and its derivatives) for CO2 by examining mixed gas separation experiments.86,93,94,97,99–102,105 Alkylamines have been bound to the metal centres of an extended MOF-74-Mg analogue to enhance selectivity for CO2.97 Flue gases from coal-fired power plants are typically released at ∼1 bar at temperatures from 40–60 °C and contain a mixture of N2 (70–75%), CO2 (15–16%), H2O (5–7%), and O2 (3–4%).106,107 Given the limitations of gas diffusion imposed by the relatively narrow channels of MOF-74-M (∼11 Å) and the target to incorporate amine functionality,108 the dobdc4− linker was replaced by the longer dobpdc4− (4,4′-dioxido-3,3′-biphenyldicarboxylate).97 The overall topology of the subsequent MOF (Fig. 24) remains unchanged but the pores are considerably larger (∼18.4 Å) than that of MOF-74. Subsequent functionalisation of the vacant metal site with N,N′-dimethylethylenediamine (mmen) affords [mmen-Mg2(dobpdc)].97
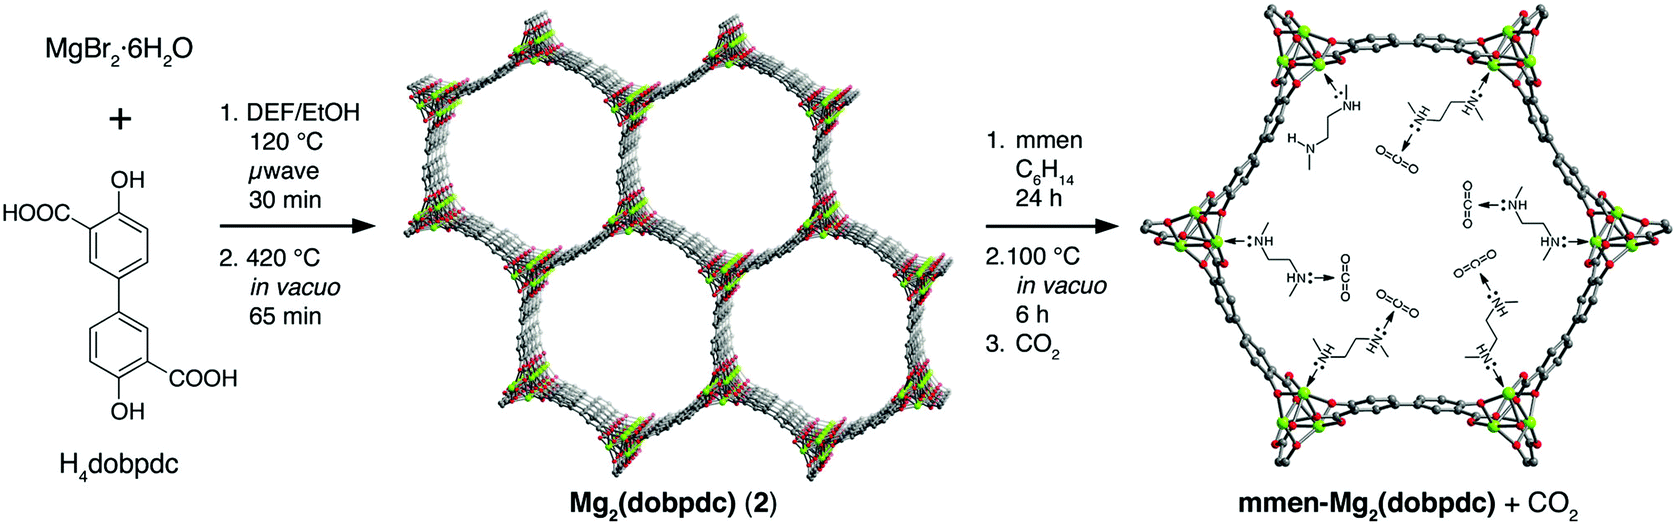 | ||
| Fig. 24 Synthesis of mmen-Mg2(dobpdc) (mmen = N,N′-dimethylethylenediamine; dobpdc4− = 4,4′-dioxido-3,3′-biphenyldicarboxylate). Microwave reaction of MgBr2·6H2O and H4dobpdc (left) affords [Mg2(dobpdc)] following evacuation of the as-synthesized solid at high temperatures (middle). The framework structure depicted is that obtained from single crystal X-ray analysis of the isostructural Zn(II) compound DEF-1. Green, red, and grey spheres represent Mg, O, and C atoms respectively; H atoms are omitted for clarity. Addition of an excess of mmen to the activated framework yields [mmen-Mg2(dobpdc)] (right). Reproduced from ref. 97 with permission from the American Chemical Society. | ||
Activated [mmen-Mg2(dobpdc)] takes up 2.0 mmol g−1 (8.1 wt%) of CO2 at 0.39 mbar and 25 °C and 3.14 mmol g−1 (12.1 wt%) at 0.15 bar and 40 °C, the latter being relevant to flue gas conditions. The purity of the CO2 removed from simulated flue gases was estimated to be ∼98% and the performance as an adsorbent under these conditions was comparable to amine-grafted silicas and aqueous amine solutions. Interestingly, the [mmen-Mg2(dobpdc)] shows unusual stepwise adsorption of CO2 at low pressure, and this step shifts to higher pressures at higher temperatures.97 The mechanism of stepwise CO2 adsorption in the isostructural and more crystalline Mn(II) analogue [mmen-Mn2(dobpdc)] has been studied by combined spectroscopic and diffraction methods.109 Diffraction data were collected at 100 K before and after exposure of a sample to 5 mbar of CO2. Structural determination revealed that the mmen molecules were bound through one N-donor to the Mn(II) centre, Mn–N = 2.29(6) Å, with the other N-centre exposed on the surface of the wall of the pore (Fig. 25). On exposure to CO2, CO2 inserts into the M–N bond forming a carbamate with an O-centre bound to Mn(II), Mn–O = 2.10(2) Å (Fig. 25). The second O atom of the carbamate has a close interaction of 2.69(1) Å with the N-centre of a neighboring mmen, resulting in chains of ammonium carbamate running along the channel of the framework. This well-ordered chain structure was maintained at 295 K, as determined from a full Rietveld refinement of PXRD data collected at 295 K. Thus, the adsorption of CO2 by [mmen-M2(dobpdc)] at ambient temperatures is associated with a structural transition to form an extended chain structure held together by ion pairing between the metal-bound carbamate units and the outstretched ammonium group of a neighboring mmen molecule (Fig. 26). These studies demonstrated an excellent example of utilising the advanced diffraction technique to gain molecular understanding on the unusual properties in MOFs, in this case stepwise CO2 adsorption.
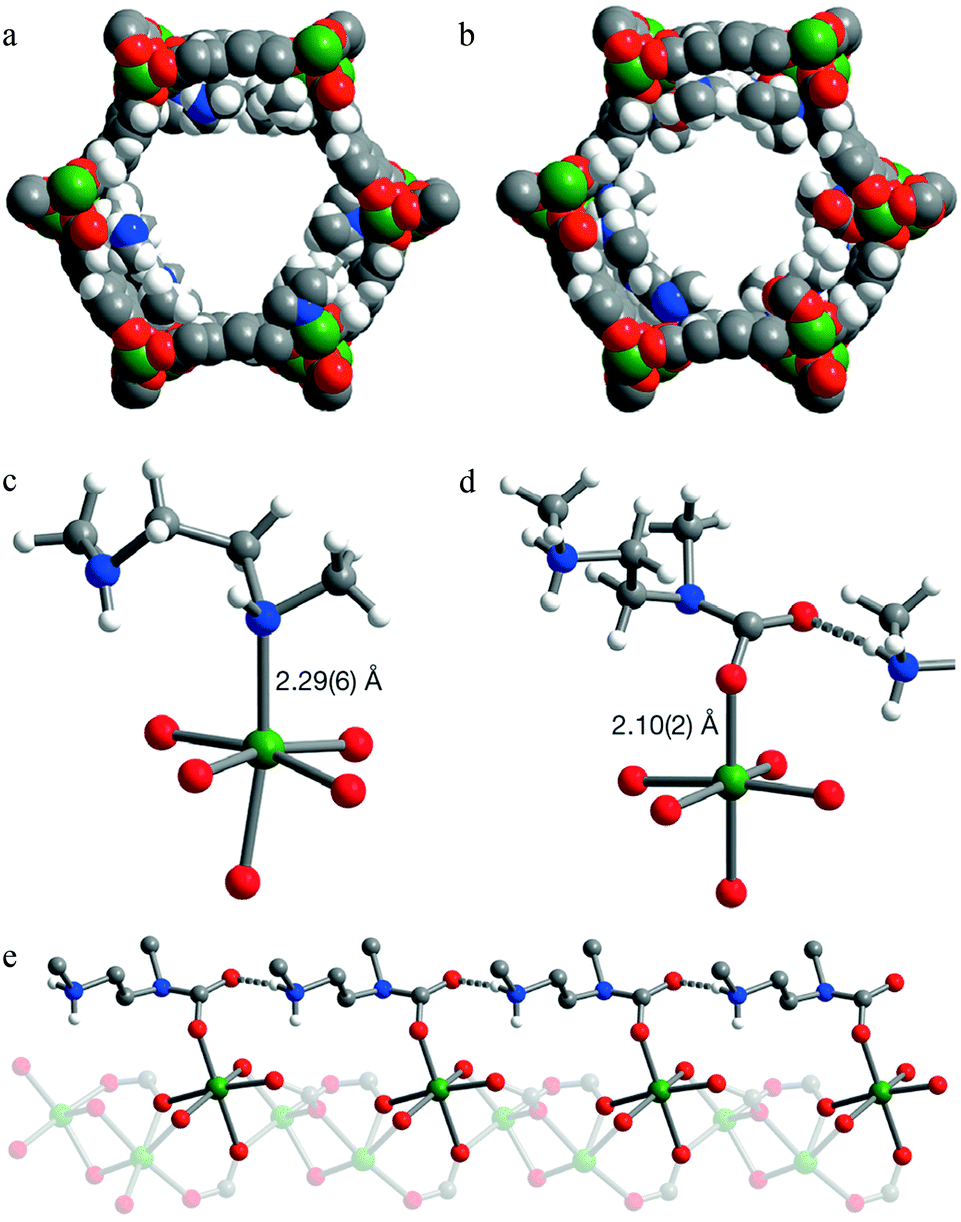 | ||
| Fig. 25 PXRD structures of [mmen-Mn2(dobpdc)]. Space-filling models of the solid-state structures of (a) [mmen-Mn2(dobpdc)] and (b) CO2-loaded [mmen-Mn2(dobpdc)] at 100 K. Portions of the crystal structures for [mmen-Mn2(dobpdc)] (c) before and (d) after CO2 adsorption. (e) A portion of the structure of CO2-loaded [mmen-Mn2(dobpdc)] showing the formation of an ammonium carbamate chain along the pore surface. Green, grey, red, blue and white spheres represent Mn, C, O, N and H atoms, respectively; some H atoms are omitted for clarity. Reproduced from ref. 109 with permission from the Nature Publishing Group. | ||
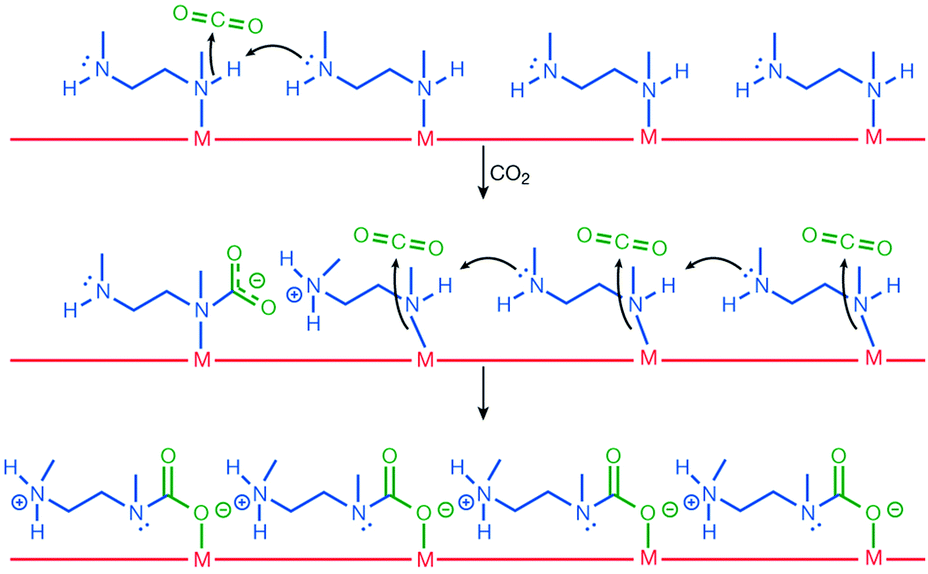 | ||
| Fig. 26 The proposed mechanism for CO2 adsorption in [mmen-M2(dobpdc)]. Reproduced from ref. 109 with permission from the Nature Publishing Group. | ||
3. Materials without open metal centres
3.1 The MIL-53 and MIL-47 series
The MIL-53 (MIL = Matériaux Institut Lavoisier) series of materials are built from chains of trans μ2-OH corner-sharing octahedral M(III) centres (M = Cr, Al, Fe, Sc) [MO4(OH)2] which are interconnected through ditopic terephthalate linkers, thus generating 1D lozenge-shaped pores.110–113 The major characteristic of these materials is their ability to “breathe”, i.e. to expand or contract drastically their crystalline structure adapting to the nature and amount of adsorbed guest molecules (Fig. 27).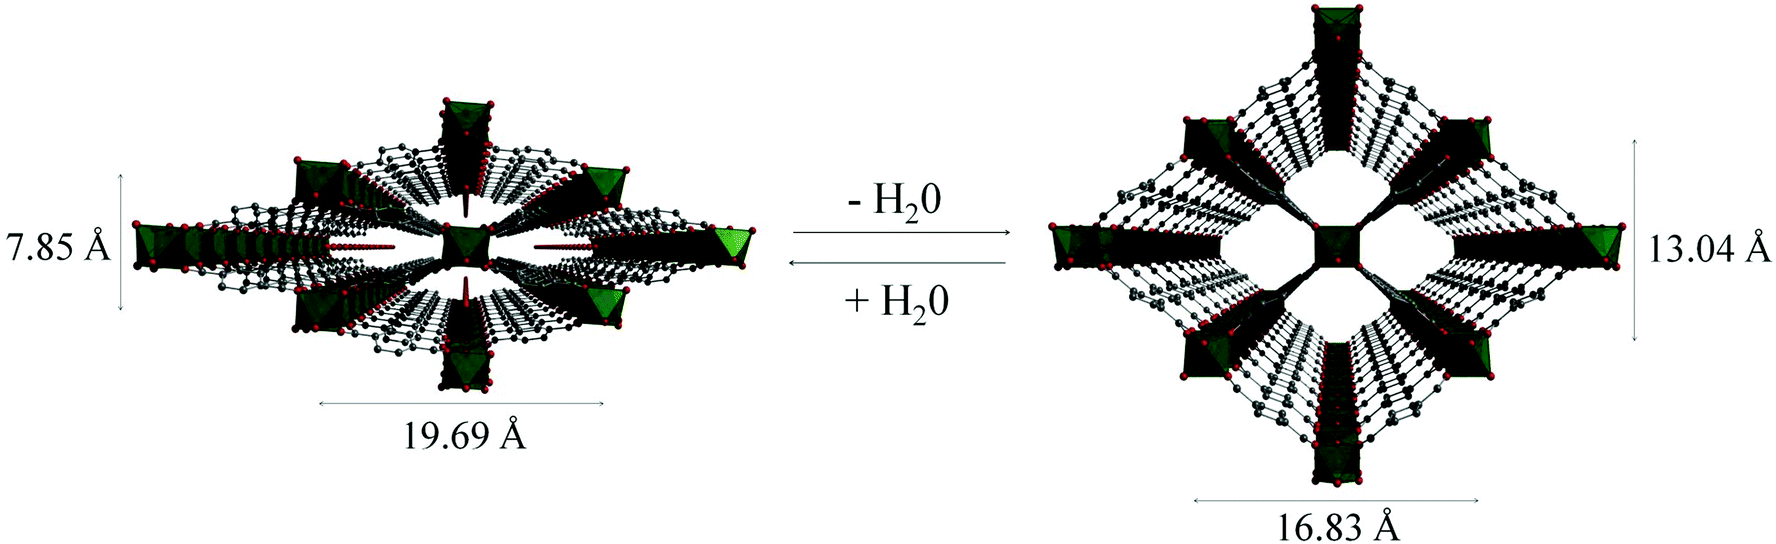 | ||
| Fig. 27 Views of the structure of MIL-53(Cr) upon dehydration and rehydration. Adapted from ref. 112 with permission from the Royal Society of Chemistry. | ||
The structural flexibility of these MOFs in response to guest–host interactions has encouraged the investigation of adsorption mechanisms for various guests of interest by in situ characterisation techniques. Moreover, in the isostructural V(IV) material, MIL-47,114 the μ2-OH are replaced by μ2-O groups and this MOF is much more rigid, which offers interesting opportunities for comparison. The adsorption isotherm of CO2 in MIL-53(Cr) up to 30 bar at room temperature shows a two-step behaviour (Fig. 28a). After an initial rapid uptake of 3 mmol g−1 below 1 bar, a plateau is observed, and then a second uptake to 9 mmol g−1 occurs for pressures higher than 5 bar.115 This unusual behaviour was studied by means of high resolution in situ PXRD coupled with IR spectroscopy and DFT calculations.116 It was confirmed that the two-step adsorption of CO2 corresponds to a breathing phenomenon (Fig. 28b): starting from the activated open form MIL-53HT (HT = high temperature), the initial adsorption of CO2 causes a shrinkage of the structure leading to a new low pressure (LP) MIL-53LP phase, the structure of which has been refined from PXRD data at 195 K under 1 bar of CO2. In MIL-53LP, the CO2 molecules could be located and their occupancy refined to 0.54, in good agreement with the amount of CO2 adsorbed at the first plateau. The adsorbed CO2 molecules were found to interact with two μ2-OH groups from the two closest opposite chains of the pores (Fig. 29) and are aligned along the pore direction with intermolecular distances of 3.4 Å, indicating CO2–CO2 interactions. With increasing pressures of CO2, the second gas uptake corresponds to a full opening of the structure, leading to the MIL-53HP (HP = High Pressure) phase in which the gas molecules are disordered.
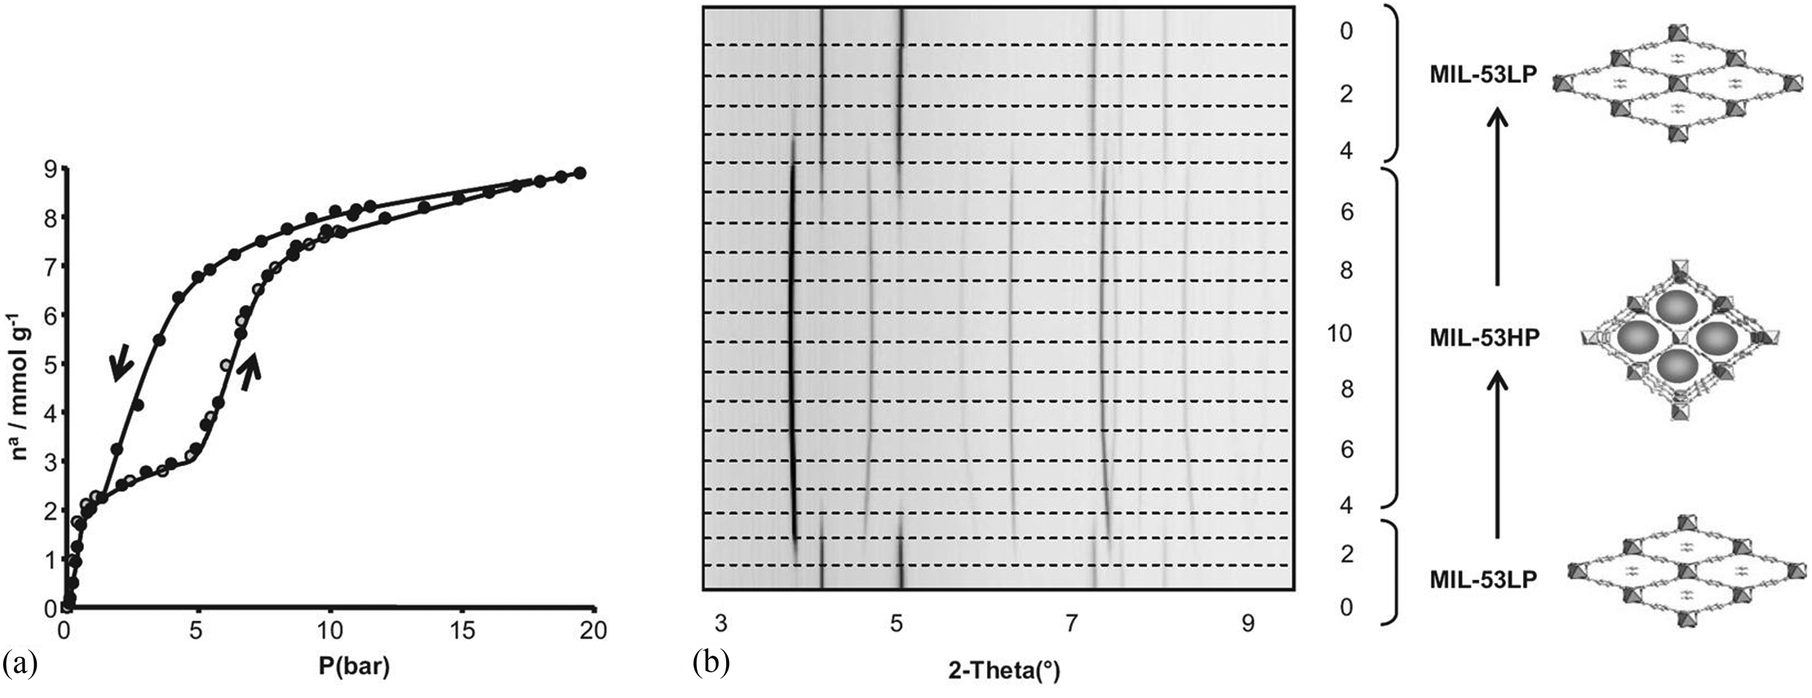 | ||
| Fig. 28 (a) Adsorption–desorption isotherms of MIL-53(Cr) at 304 K; (b) PXRD patterns of MIL-53(Cr) under various pressures of CO2 at 293 K. Reproduced from ref. 116 with permission from John Wiley and Sons. | ||
 | ||
| Fig. 29 (a) View of the refined structure of MIL-53LP along the c-axis (PCO2 = 1 bar, T = 195 K); (b) closer view of the local interactions between the CO2 molecules within a channel of MIL-53 (PCO2 = 1 bar, T = 195 K). Adapted from ref. 116 with permission from John Wiley and Sons. | ||
Diffusion of CO2 molecules and their interactions with the MIL-53(Cr) framework during adsorption have been investigated by a combination of QENS and MD.117 At low CO2 loadings, in the closed MIL-53LP phase, the minimum free energy regions calculated for the MOF correspond to the OH groups of the octahedra chains. This explains the slow diffusion of CO2 because of its strong interaction with the hydroxy groups and is consistent with the in situ PXRD study. It was demonstrated that with increasing pressures, the transport diffusivity of CO2 is two orders of magnitude faster in the HP form than in the LP form, but surprisingly, the diffusion mechanism remains strictly one dimensional, suggesting that the CO2 molecules, which still interact strongly with OH groups, restrict the motions of additional adsorbates perpendicularly to the channels. Interestingly, a similar study has been reported by Salles et al. on the diffusion of CO2 in the rigid MIL-47 system.118 Although the authors could not elucidate unambiguously the microscopic diffusion mechanism of CO2 from the QENS experiment in this case, their analysis of the MD trajectories suggests a 3D mechanism for CO2 diffusion in MIL-47. This difference has been attributed to the absence of the hydroxy groups as preferential adsorption sites in the pores of MIL-47 in contrast with the case of MIL-53(Cr).
In both MIL-53(Cr) and MIL-47, adsorption of CH4 occurs in a single step without framework breathing.115 A dynamic QENS/MD study on the diffusion of CH4 in these materials reveals a 1D diffusion mechanism of the adsorbate in the fully open pores in both cases.119 The significantly higher diffusivity of CH4 in MIL-47 than in MIL-53(Cr) and the higher activation energy for the latter are again related to the μ2-OH groups which act as attractive sites and steric barriers. In both systems, the diffusivity of adsorbates is higher for CH4 than for CO2, consistent with higher activation energies calculated for CO2.
Recently, QENS/MD studies of the diffusion of CO2/CH4 mixtures in the MIL-53(Cr) and MIL-47 have sought to evaluate the impact of the CO2 concentration on the diffusivity of CH4.120 In both cases, the diffusivity for CH4 was found to decrease with increasing CO2 loading, although CO2 has little or no influence on the diffusivity for CH4 as a function of total gas loading. MD trajectories of the gases show that in both materials CO2 and CH4 follow a 1D type diffusion mechanism. CH4 is distributed in the central zone of the pore while CO2 molecules mainly diffuse in the vicinity of the polar μ2-OH groups for MIL-53(Cr) and close to the pore wall for MIL-47.
A similar methodology has been used to describe the dynamic properties of H2 in MIL-53(Cr) and MIL-47 at 77 K.76 In the case of H2, no framework breathing phenomenon was observed and the pores stay fully open throughout the experiment. QENS experiments linked to MD simulations fitted a 1D diffusion mechanism in the case of MIL-53(Cr), revealing that the μ2-OH groups act as steric barriers rather than specific binding sites governing the diffusion process. A 3D model was established for H2-loading in MIL-47 since there is no specific steric barrier for adsorbed H2 molecules (Fig. 30). The most striking phenomenon is the supermobility of adsorbed H2 in both materials as evidenced by a sudden increase of the diffusivity at low loadings, not previously observed in nanoporous materials.
 | ||
| Fig. 30 Views of the microscopic diffusion mechanism of H2 from the 2D probability density plot in MIL-53-Cr (left) and MIL-47(V) (right). Reproduced from ref. 76 with permission from the American Chemical Society. | ||
In situ NPD was used to characterise the H2 adsorption sites in MIL-53(Cr) at 10 K at various loadings.121 With increasing pressures, four different adsorption sites are sequentially occupied (Fig. 31), the first site D1 being located in the acute corner of the lozenge-shaped pore (Fig. 32). This site is closer to the C–C bond of the carboxylates (3.3 Å) and to the H from the opposite benzene ring (2.5 Å) than to the O from the μ2-OH group (4.3 Å), further confirming their steric role of the latter in the adsorption mechanism. The second and third adsorption sites are found in the obtuse corner of the pore, and the only specific interactions are with the carboxylate functions for D2 and with benzene rings of the ligands for D3. The D4 site, closer to the centre of the pore, only involves interactions between adsorbate molecules. The adsorption mechanism of H2 in MIL-53(Cr) is thus governed by the steric effects of binding guest species to the μ2-OH groups that determine the position of the initial and hence subsequent binding sites, leading to a 1D diffusion pathway for the guest molecules.
 | ||
| Fig. 31 Fourier maps obtained from the neutron diffraction data. From left to right: the empty MIL-53(Cr) and three subsequent loadings with D2 (0.4, 1.4, 3.2 D2 equivalent wt%). Reproduced from ref. 121 with permission from the American Chemical Society. | ||
 | ||
| Fig. 32 View of the refined structure of D2 loaded MIL-53(Cr) in saturation conditions showing the positions of the adsorption sites D1 (green), D2 (blue), D3 (yellow) and D4 (purple). Adapted from ref. 121 with permission from the American Chemical Society. | ||
3.2 MOF-5, [Zn4O(BDC)3] (BDC2− = benzene-1,4-dicarboxylate)
[Zn4O(BDC)3] (BDC2− = 1,4-benzenedicarboxylate; terephthlate), known also as MOF-5, is constituted of octahedral {Zn4O} clusters linked through linear dicarboxylate linkers.122 The [Zn4O(O2CR2)6] cluster is a tetramer of ZnO4 tetrahedra sharing a central μ4-O corner and connected through six bidentate carboxylates from the ligands. An initial attempt to determine the adsorption sites of H2 molecules was reported by Rosi et al. by INS experiments at 10 K for various loadings.30 Binding sites were assigned to the Zn(II) cluster and to the benzene ring of the ligand. The first primary adsorption site was assigned32,123 to a position equidistant to three carboxylates from the cluster above a face of the inorganic cluster, and the second adsorption site to an edge of the cluster, followed by sites around the organic linker. These assignments resulted from analysis of INS experiments for a series of MOFs built around from the same [Zn4O(O2CR)6] clusters and different organic linkers, as well as results from in situ X-ray diffraction studies of Ar- and N2-loaded single crystals of MOF-5.32,123Single crystal neutron diffraction was also used to determine the adsorption sites for H2 in MOF-5.124 The diffraction experiment was carried out on a single crystal loaded at room temperature with H2 gas at a pressure of 1 atm. Two primary adsorption sites were located from the neutron diffraction data collected at 5 K (Fig. 33). The first fully occupied site (α-site) is situated at 3.61(5) Å from a Zn(II) centre, 3.75(6) Å from the μ4-O atom, above an empty face of the [Zn4O(O2CR)6] cluster, in agreement with the above INS study. The second site (β-site) was found above an external face of a ZnO4 tetrahedra, equi-distant [3.45(5) Å] from the O-centre in carboxylate functions with a Zn⋯H distance of 3.64(6) Å. This differs slightly from the previous conclusion from the INS study.
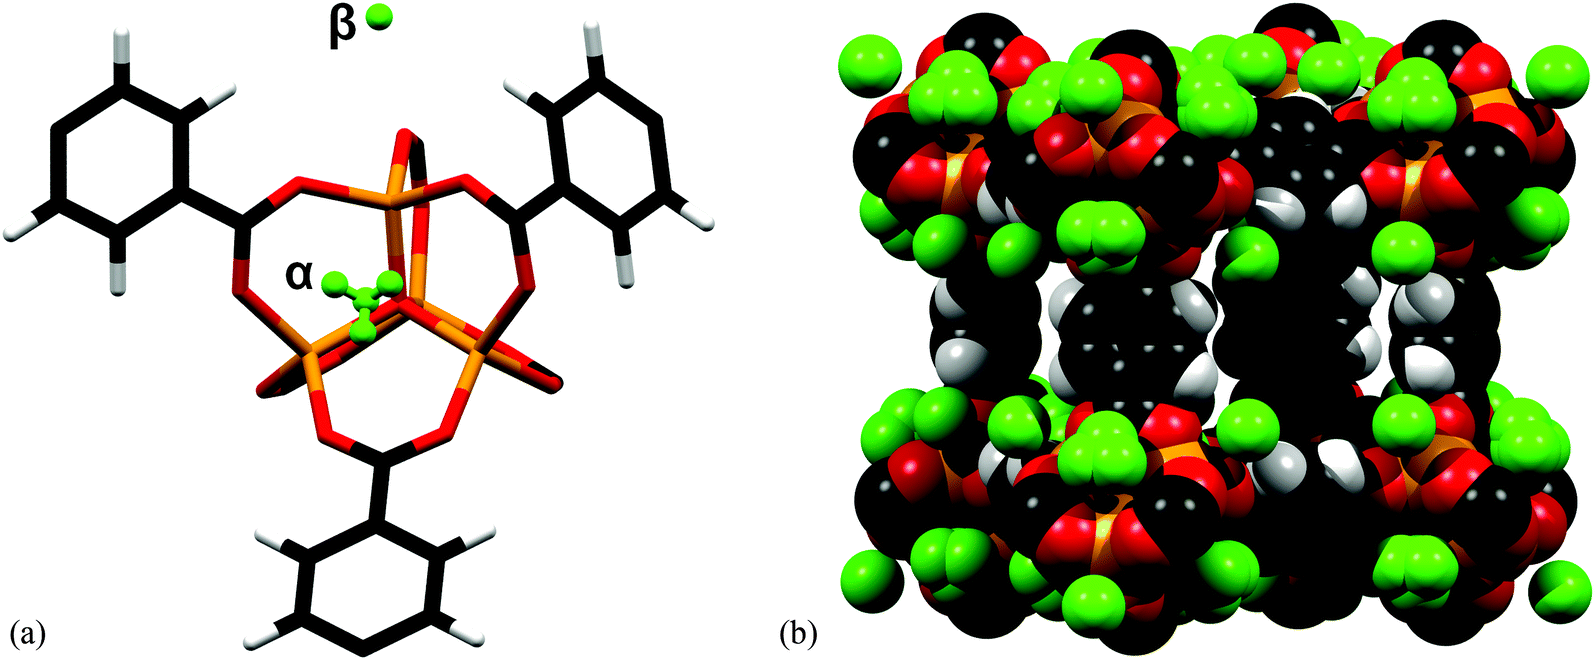 | ||
| Fig. 33 (a) The location of the adsorption sites for H2 at 5 K relative to the framework atoms in MOF-5. The α-site is 100% occupied at 50 K, 30 K and 5 K. The β-site is 98% occupied at 5 K; (b) space-filling diagram of one of the framework cavities at 5 K. Adapted from ref. 124 with permission from the Royal Society of Chemistry. | ||
3.3 Zeolitic imidazolate framework ZIF-8
Zeolitic imidazolate frameworks (ZIFs) are porous materials assembled by tetrahedrally coordinated M(II) (M = typically Zn, Co) ions and imidazolate linkers to give zeolite-like structures.125 ZIFs show exceptional chemical stability and are versatile structures via incorporation of various functionalised organic linkers, and have been widely explored for applications in gas sorption,126 small molecule separation,127 and catalysis.128 The H2 adsorption properties of the archetypal ZIF-8129 have been investigated in detail using NPD.130 ZIF-8 is comprised of tetrahedral ZnN4 units bridged by 2-methylimidazolate (MeIM) to give a sodalite zeolite-type structure. The framework can be viewed as body-centred cubic packing of truncated octahedral cages, each with internal diameter of 11 Å, in which four Zn(II) ions and four MeIM rings form a 4 Å square aperture and six ZnN4 clusters and six MeIM rings generate a hexagonal face. NPD data were collected at different D2 loadings at 3.5 K, and six distinct D2 binding sites were identified and sequentially occupied with increasing loadings (Fig. 34). The strongest adsorption sites are directly associated with the organic moieties, with site D1 residing on top of the MeIM ring close to the C![[double bond, length as m-dash]](https://www.rsc.org/images/entities/char_e001.gif) C bond in the MeIM unit, with site D2 located at the centre of the hexagonal face. The third site (D3) is also located is at the centre of the hexagonal opening but on the other side of the aperture. The fourth site (D4) was found in the face centre of the D2 nanocage formed by the first three binding sites. With further loading of 28 D2 per 6 Zn at 3.5 K, two additional sites D5 and D6 sited close to the centre of the 11 Å cage were progressively occupied.
C bond in the MeIM unit, with site D2 located at the centre of the hexagonal face. The third site (D3) is also located is at the centre of the hexagonal opening but on the other side of the aperture. The fourth site (D4) was found in the face centre of the D2 nanocage formed by the first three binding sites. With further loading of 28 D2 per 6 Zn at 3.5 K, two additional sites D5 and D6 sited close to the centre of the 11 Å cage were progressively occupied.
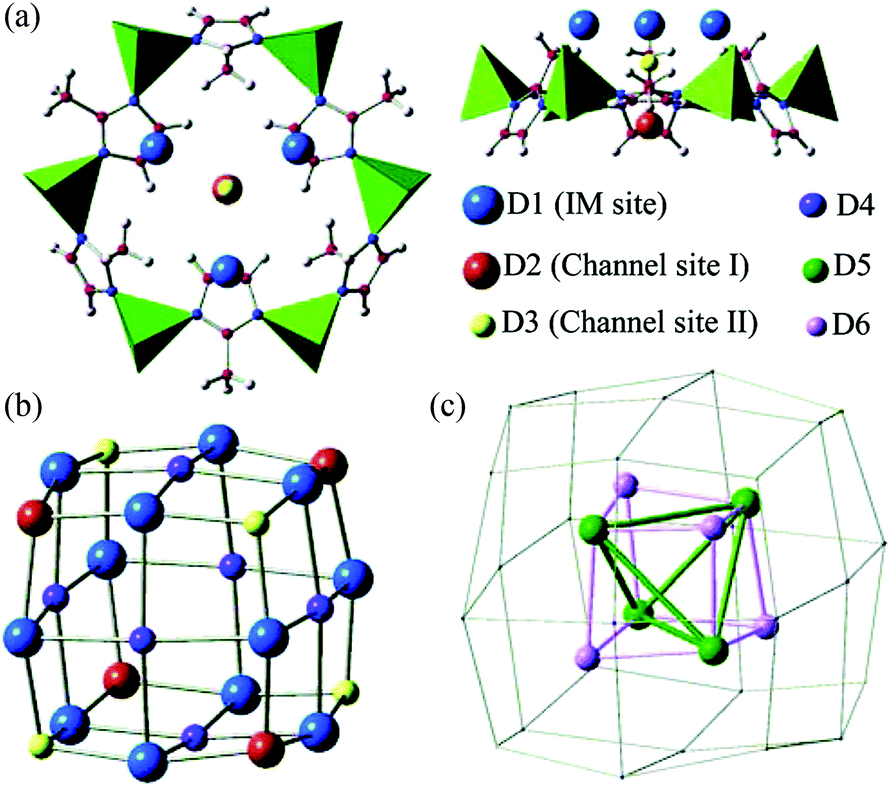 | ||
| Fig. 34 The adsorption sites for D2 in ZIF-8 obtained by Fourier difference analysis of the NPD data: (a) top and side views of the first three adsorption sites near the hexagonal face; (b) pseudo-cubic nanocage formed by sites D1, D2, and D3; (c) tetrahedron-like nanocage formed by D5 and D6 sites. Reproduced from ref. 130 with permission from the American Chemical Society. | ||
3.4 Selective CO2 binding in amine-functionalised MOFs
It is widely accepted that MOFs containing pendant amine functional groups can have specific binding to CO2 molecules, thus improving the selectivity and uptake capacity of CO2 in the host. However, experimental evidence on the direct visualisation of NH2⋯CO2 binding in MOFs has only been reported in exceptional cases.131 For example, Shimizu et al. have reported the location of CO2 molecules in [Zn2(Atz)2(ox)]∞ (Atz2− = 3-amino-1,2,4-triazole; ox2− = oxalate) via in situ single crystal diffraction and confirmed the strong interaction of amines with CO2 with a heat of adsorption of ca. 40 kJ mol−1.131,132 Two binding sites for CO2 were located: site I is close to the free amine group and forms a strong dipole interaction and site II is in the middle of the pore forming a “T-shape” interaction with the CO2 residing on site I (Fig. 35).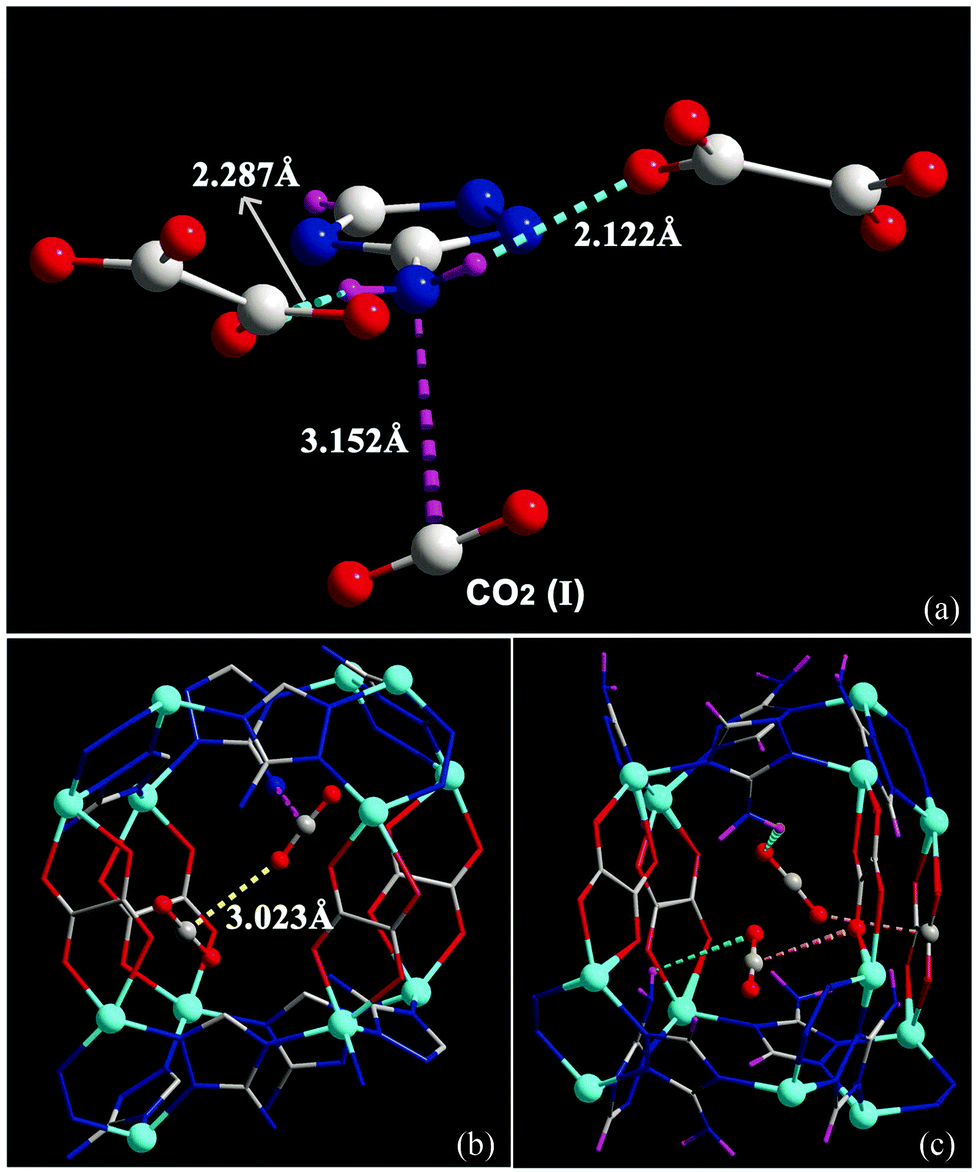 | ||
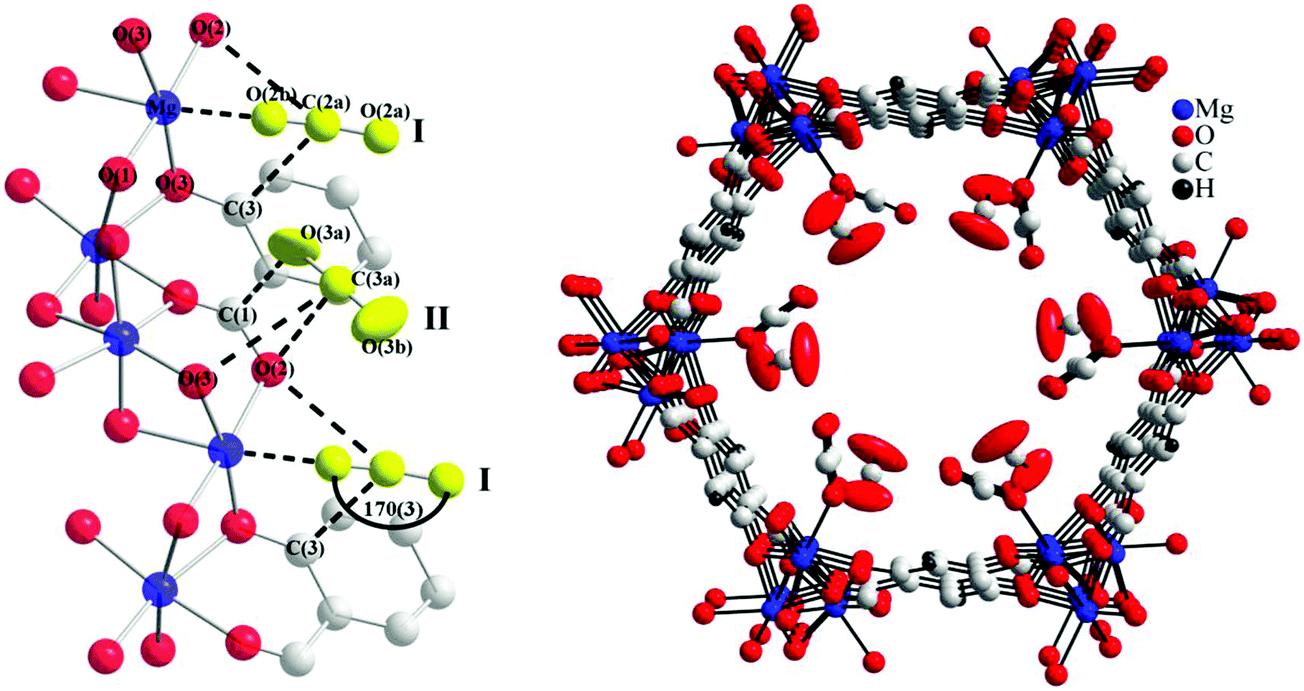
| Fig. 35 (a) View of X-ray structure of CO2-loaded [Zn2(Atz)2(ox)]·(CO2)1.3 at 173 K. The H atoms of the amine group (located crystallographically) hydrogen bond to oxalate O-centres, directing the N lone pair toward the C(+) atom of the CO2 molecule. Hydrogen bond distances shown are for H-acceptor interactions. (b) View of the crystallographically independent CO2 molecules trapped in a pore via cooperative interaction between CO2-I and CO2-II molecules. The CO2⋯NH2 interaction is represented as a dotted purple bond, and the CO2⋯CO2 interaction is indicated as a dotted yellow bond. (c) The CO2⋯oxalate interactions are shown in orange, and the CO2⋯NH2 hydrogen bond interactions are shown in green. For clarity, H atoms are shown in purple. Reproduced from ref. 131 with permission from the American Association for the Advancement of Science. | ||
[Zn2(Atz)2(ox)]∞ was compared to the phosphonate analogue, [Zn3(Atz)3(PO4)]∞, with the hypothesis that the latter might give better CO2 capture properties.133 Fewer trianionic phosphonate groups per metal are required to provide charge-balance than dianionic oxalates, and larger amine-lined pores were anticipated and indeed observed. However, CO2 uptake did not exceed that of [Zn2(Atz)2(ox)]∞ and the adsorbed CO2 molecules could not be readily located in [Zn3(Atz)3(PO4)] by diffraction experiments. The porous 3D networks in both cases are made up of cationic Zn-Atz layers pillared by the anions (Fig. 36). Only the triazole N-centres of the aminotriazole ligand are coordinated to Zn(II), with the amine N-centres remaining uncoordinated. The structure of [Zn3(Atz)3(PO4)]∞ does indeed have larger pores, but the ZnAtz layers of the structure adopt a buckled or staggered conformation which results in the amines not pointing directly into the pores. Classical GCMC and MD simulations and periodic DFT calculations were used to model the CO2 adsorption isotherms, heats of adsorption and locations of CO2 molecules (Fig. 37) in both MOFs. The isotherms were modelled with excellent agreement in both cases, with the exception of a slight overestimate of the CO2 adsorption of [Zn3(Atz)3(PO4)]∞ at low pressure.
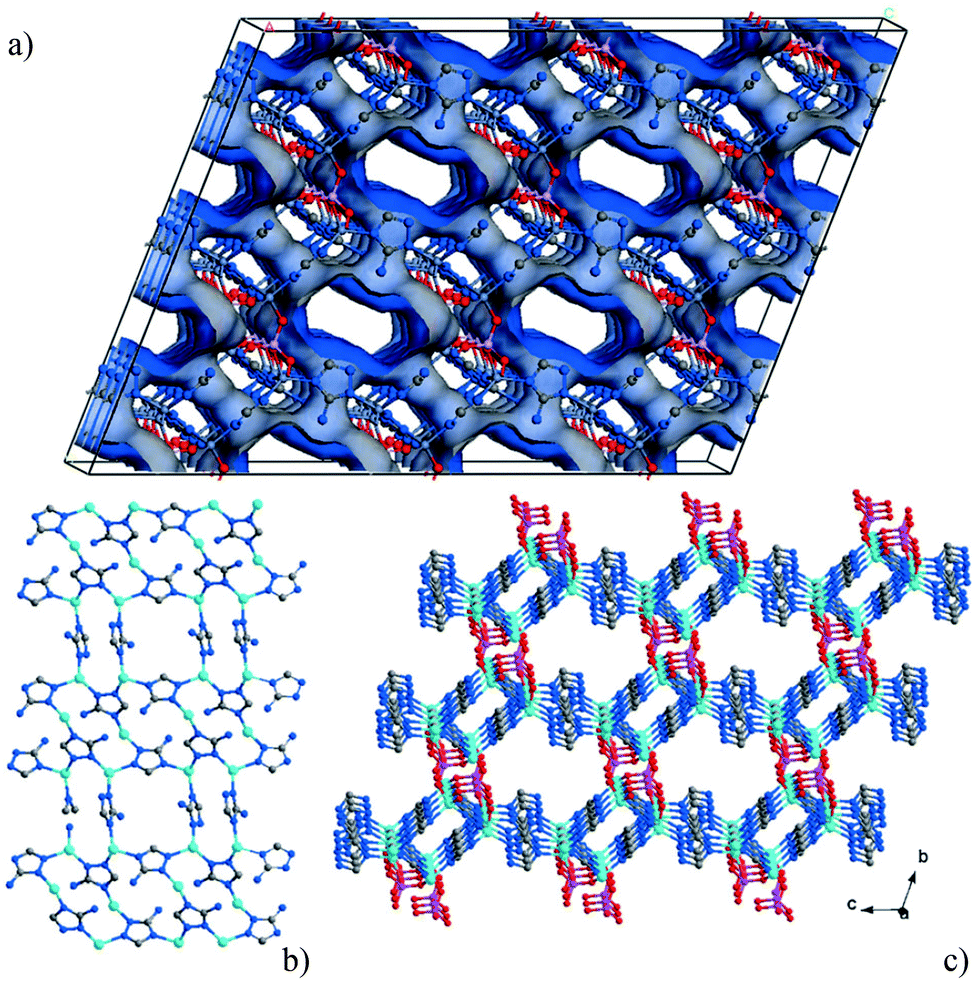 | ||
| Fig. 36 Structure of [Zn3(Atz)3(PO4)]∞ (solvent molecules omitted for clarity). (a) Connolly surface representation showing the three-dimensional structure of the Zn–Atz layers pillared by phosphate groups. (b) Ball-and-stick representations showing the zinc–aminotriazolate layer, and (c) the structure showing the layering of the Atz2− ligands. C grey, N dark blue, O red, P purple, Zn pale blue. Reproduced from ref. 133 with permission from John Wiley and Sons. | ||
 | ||
| Fig. 37 Centre-of-mass probability-density plots of CO2 molecules in [Zn3(Atz)3(PO4)]∞ at 273 K and 850 mbar pressure. Black dashed boxes: α region; green: β region. Shown are probability densities that are (a) projected onto the ac plane, and (b) projected onto the ab plane. (c) Selected CO2 binding-site geometries optimized at the DFT level. Symmetry-equivalent CO2 molecules are represented in the same color. (d) Trace of two CO2 molecules (red and orange) during a 35 ps ab initio MD simulation of [Zn3(Atz)3(PO4)]∞ at 273 K with a loading of four CO2 molecules per unit cell (the other two CO2 molecules are not shown). Thirty snapshots, separated by 1.2 ps, are depicted. For (a)–(d), a 2 × 1 × 1 representation of the unit cell is shown that is shifted by 0.5 in the a direction in (d). Reproduced from ref. 133 with permission from John Wiley and Sons. | ||
The GCMC and DFT calculations located CO2 molecules in two regions in [Zn3(Atz)3(PO4)]∞, denoted as α and β in Fig. 37. It is noteworthy that the electrostatic interactions of CO2 at the α1 binding site with the amine groups were calculated to be weakly attractive for two adjacent amines but repulsive for the third; in the oxalate framework all these interactions were found to be attractive. Interestingly, occupation of the α1/α2/β triad of binding sites in [Zn3(Atz)3(PO4)]∞ by three CO2 molecules was calculated to have an average binding energy of 31.3 kJ mol−1 per CO2 molecule, a full 7.4 kJ mol−1 higher than the mean average of the individual binding energies of the sites in an empty framework (30.6, 26.9 and 29.0 kJ mol−1 respectively). However, immediately adjacent α1 and α2 sites are mutually exclusive (red and blue sites in Fig. 37c) and so a dynamic ‘slipping’ of CO2 between these positions was proposed as a mechanism to benefit from favourable site–site cooperative binding effects. Therefore, ab initio MD simulations on four CO2 molecules in a single unit cell were performed to investigate the mobility of CO2. The results are shown in Fig. 37d: two of the four calculated regions resulting from a 35 ps MD simulation are depicted and broadly the same regions are identified as by the GCMC simulations. Slipping of the CO2 molecules between α and β sites was observed in this short simulation and snapshots show the triad formation arises when this occurs.
In conclusion, this study neatly demonstrates that simulation of parameters for the individual binding site of CO2 in a framework needs to be combined with experimental and computational analysis of the molecular dynamics of the guest and the more subtle intermolecular interactions between CO2 molecules in different binding sites. It also demonstrates that excessive clustering of amine groups actually hinders CO2 binding rather than enhancing it.
4. Gas binding in a family of hydroxy-decorated MOFs, MFM-300(M) (M = Al, Ga, In)
4.1 Selective gas binding in MFM-300(Al)
Selective capture and removal of harmful flue gases (e.g., CO2, SO2) is a major challenge for power stations and coal-fired industry. Materials functionalised with amine-groups dominate this area, primarily because of their potential to form carbamates via H2N(δ−)⋯C(δ+)O2 interactions, thereby trapping CO2 covalently.134,135 The use of these materials, however, is energy-intensive, with significant environmental impact. The development of alternative materials without incorporating toxic amine-groups can potentially reduce the energy and environmental penalties. Recently, a non-amine-containing material MFM-300(Al) (MFM = Manchester Framework Material, replacing the previous NOTT designation) in which hydroxy groups within pores bind CO2 and SO2 was reported.136In situ synchrotron PXRD and INS studies, combined with modelling have demonstrated the power in revealing the preferred binding sites and dynamics for adsorbed gas molecules.MFM-300(Al) is comprised of infinite chains of [AlO4(OH)2] moieties bridged by biphenyl-3,3′,5,5′-tetracarboxylate ligands to afford a porous extended framework structure with square-shaped 1D channels with hydroxy groups protruding into them (Fig. 38a). The diameter of the channel window, taking into account the van der Waals radii of the surface atoms, is approximately 6.5 Å. Desolvated MFM-300(Al) has a pore volume of 0.38 cc g−1 and a BET surface area of 1370 m2 g−1 and so the general porosity of MFM-300(Al) is moderate within the family of MOF complexes.136,137 Desolvated MFM-300(Al) shows highly selective uptake for CO2 (7.0 mmol g−1) and SO2 (8.1 mmol g−1) at 273 K and 1.0 bar, among the highest values observed so far under these conditions. In contrast, under the same conditions the isotherms for CH4, CO, N2, H2, O2, and Ar show only surface adsorption by MFM-300(Al) with very low uptake of gas, thus giving ultra-high selectivities for CO2 and SO2.
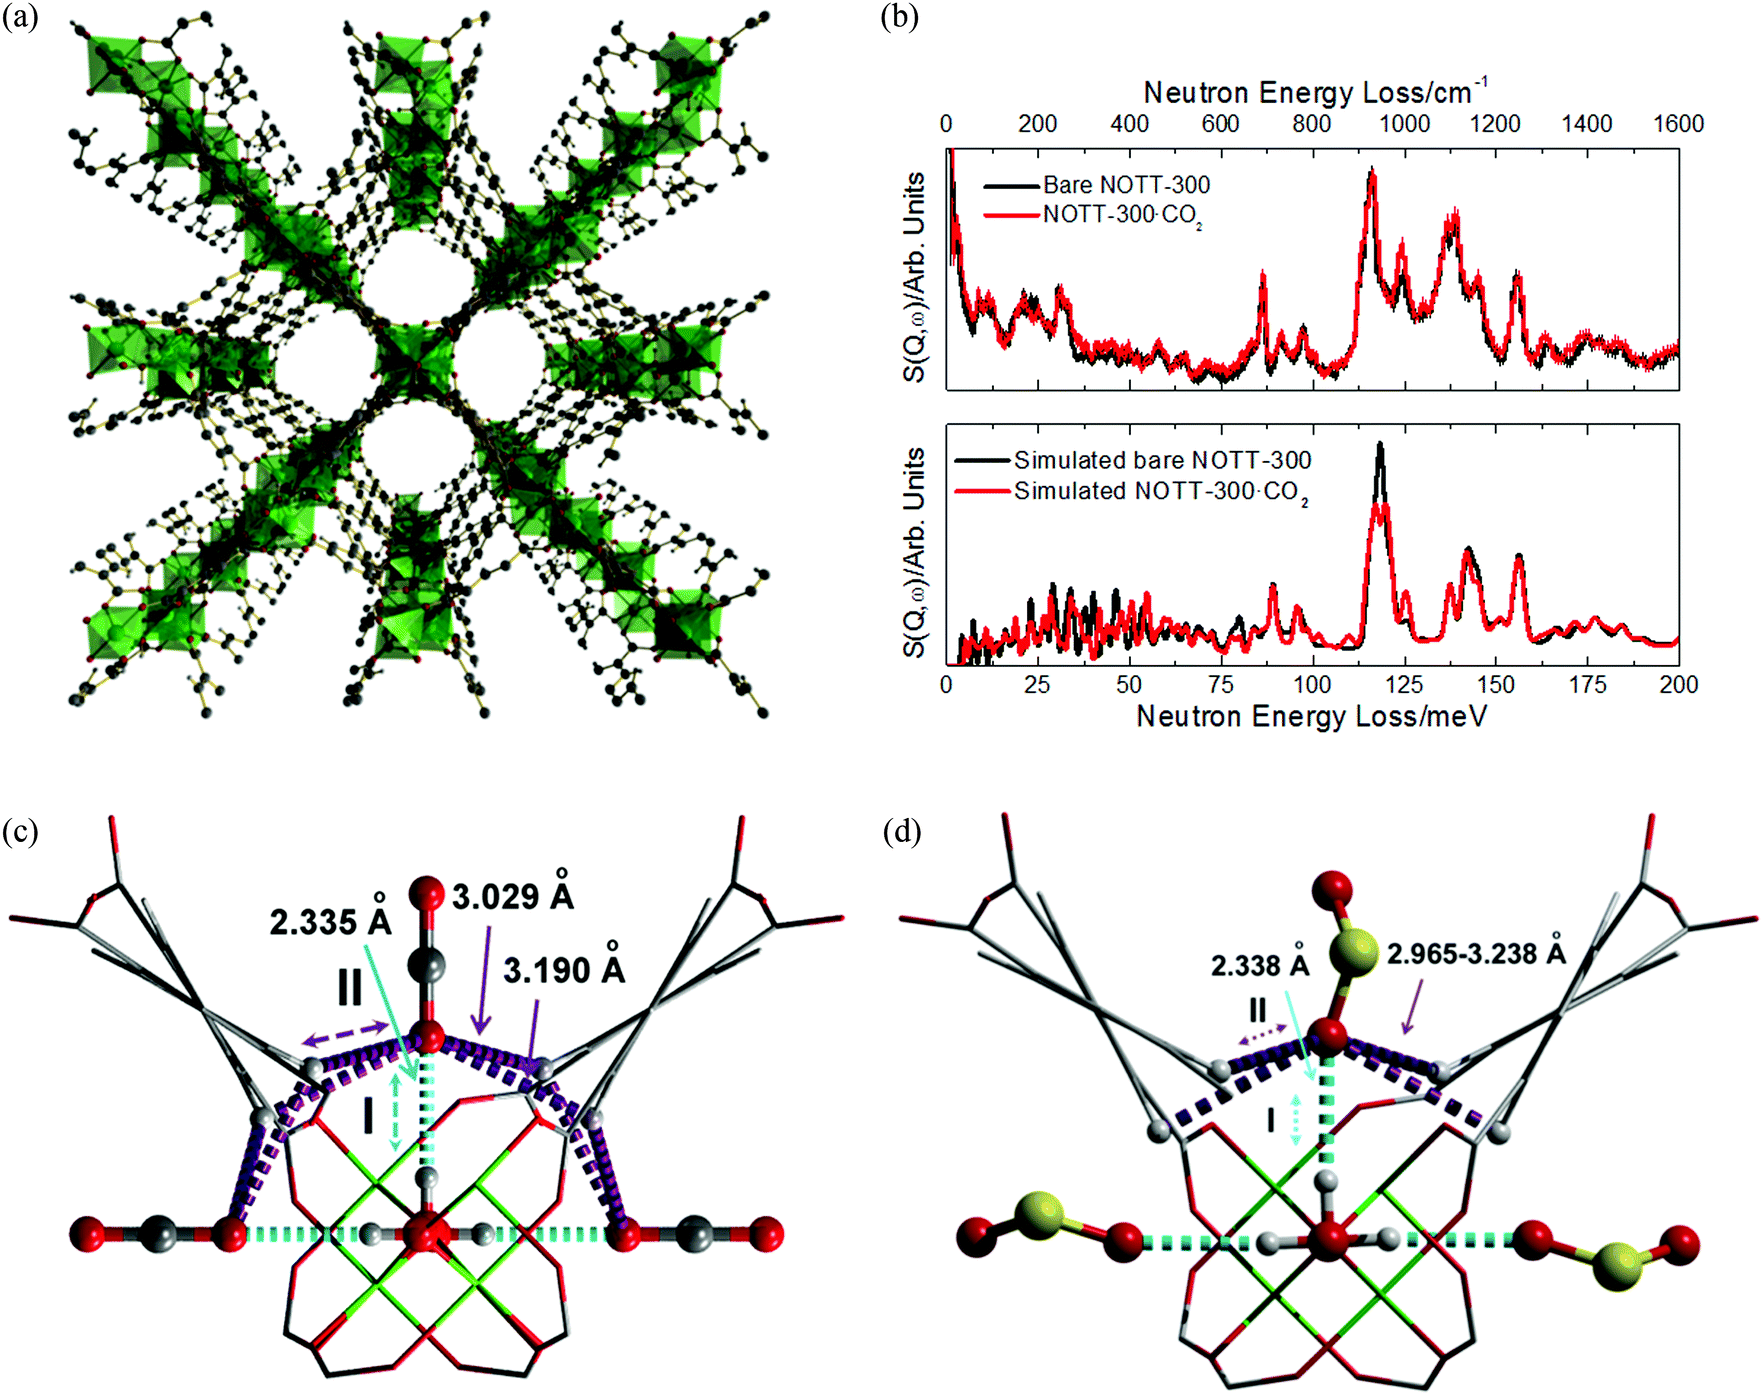 | ||
| Fig. 38 (a) View of the crystal structure for MFM-300(Al); (b) comparison of the experimental (top) and DFT simulated (bottom) INS spectra for bare and CO2-loaded MFM-300(Al). Detailed view of the role of the –OH and –CH groups in binding (c) CO2 and (d) SO2 molecules in a “pocket-like” cavity of MFM-300(Al) (Al: green; carbon: grey; oxygen: red; hydrogen: white). Reproduced from ref. 136 with permission from Nature Publishing Group. | ||
Static studies using NPD have been previously been employed to locate CO2 in porous MOFs,82,88 but although INS has been used widely to investigate the H2 binding interactions within various MOFs, this technique cannot directly detect the CO2 binding interaction within a porous system because the scattering cross-sections for carbon and oxygen are too small to obtain reasonable signals (Table 1). A combination of INS and DFT can however indirectly visualise binding of CO2 molecules within MFM-300(Al) by investigating the change in the dynamics of the hydrogen atoms in the local structure, including those of the hydroxy groups and benzene rings of the ligand. Two major changes on the INS spectra were observed upon CO2 loading into MFM-300(Al), indicating the presence of two distinct types of interactions involved in binding CO2 in the pore (Fig. 38b). DFT calculations based on INS results confirm that the adsorbed CO2 molecules interact end-on to the hydroxy groups via the formation of a moderate-to-weak hydrogen bond (O⋯H = 2.335 Å). In addition, each adsorbed CO2 molecule is surrounded by four aromatic C–H groups, forming weak cooperative supramolecular interactions between O(δ−) of CO2 and H(δ+) from –CH [O⋯H = 3.029, 3.190 Å] (Fig. 38c). This calculation is in excellent agreement with the experimental INS data and confirms the presence of both moderate-to-weak hydrogen bonds and supramolecular interactions.
The preferred binding sites for CO2 molecules within MFM-300(Al) have also been determined by static in situ PXRD analysis which also confirms end-on binding of CO2 to both the hydroxy group and the surrounding C–H groups. This PXRD analysis is in excellent agreement with the INS/DFT model. Additionally, a second CO2(II) site has been identified from this PXRD analysis, and this interacts principally with the first CO2via dipole interaction, similar to that observed in solid CO2.
The corresponding INS/DFT and PXRD studies on SO2-loaded MFM-300(Al) lead to similar observations revealing the presence of three different types of binding interactions: moderate-to-weak hydrogen bonds to hydroxy group (SO2⋯HO–), supramolecular interactions to aromatic hydrogen atoms (SO2⋯HC–) and intermolecular dipole interactions between adsorbed SO2 molecules. The binding mechanism in this case is very similar to that observed in CO2-loaded MFM-300(Al), albeit SO2 has a bend structure with <OSO angle of ∼110° (Fig. 38d). Significantly, in situ PXRD of SO2-loaded sample confirms retention of the structure of MFM-300(Al) upon inclusion and subsequent removal of SO2, thereby confirming the high stability of MFM-300(Al) in the presence of corrosive SO2. This is highly unusual for porous MOF materials that often react irreversibly with SO2.
Notwithstanding the high uptake of CO2 and SO2 observed for MFM-300(Al), it shows surprisingly low uptake for H2 (0.22 wt% at saturation at 77 K). This is almost ten-fold lower than the expected H2 uptake of 2.7 wt% based upon the pore volume and BET surface area of MFM-300(Al). As discussed above for the series of Cu(II)-tetracarboxylate MOFs in which lower H2 uptake was observed with increasing pore size,13–15 computational modelling widely predicts that MOFs incorporating ultra-micropores (below 10 Å) are optimal for H2 binding due to enhanced overlapping potentials. The exceptionally low H2 uptake for MFM-300(Al) is thus highly unusual. INS has been used to study the H2 binding interaction owing to its large incoherent cross-section (Table 1) and therefore high detection sensitivity. INS spectra of H2-loaded MFM-300(Al) display a broad hump centred at ∼20 meV with only one small energy transfer peak at 8.8 meV (Fig. 39).138 This result suggests that the majority of adsorbed H2 in the pore has a recoil motion at 5 K (below its melting point), reminiscent of the behaviour of liquid H2. This observation is distinct from previous studies on adsorbed H2 displaying binding to open metal sites, which induce clear host–guest interactions to H2. Thus, the INS spectra suggests that adsorbed H2 molecules have very weak interactions with the MFM-300(Al) host and, therefore, can rotate freely in the channel to give recoil rotational motion. This study represents a unique example of surprisingly low H2 uptake within an ultra-microporous (∼6 Å) MOF material, and complements the wide range of studies on systems showing higher uptake capacities and binding interactions, several of which are highlighted in this review.
 | ||
| Fig. 39 (a) Comparison of INS spectra for bare MFM-300(Al), MFM-300(Al)·0.5 H2 and MFM-300(Al)·1.0 H2. (b) Difference INS spectra between MFM-300(Al) and MFM-300(Al)·1.0 H2. A detailed view of the low energy transfers is shown as inset figure. Reproduced from ref. 138 with permission from Elsevier. | ||
The excellent performance of MFM-300(Al) in the capture of CO2 and SO2 motivated a study on the separation of small molecule hydrocarbons.139 At 293 K, the total adsorption uptakes for C2H2, C2H4, C2H6, and CH4 in MFM-300(Al) were measured as 6.34, 4.28, 0.85, 0.29 mmol g−1, respectively at 1.0 bar. Analysis of the pure-component isotherms at 293 K via ideal adsorbed solution theory (IAST)140 was carried out to estimate selectivity between these hydrocarbons. For equimolar mixtures at 1.0 bar, the C2H2/C2H4 selectivity of 2.30 for MFM-300(Al) by IAST is higher than that observed for [Fe2(dobdc)] (1.87),59 but is lower than for M′MOF-3a (5.23),141 although the latter system exhibits a relatively low total capacity owing to its narrow pores. The selectivity for C2H4/C2H6 in MFM-300(Al) was calculated to be 48.7. Significantly, this value is higher than that observed for the current state-of-the-art ethylene/ethane separating materials.50,59,142–144 The C2H2/CH4, C2H4/CH4, and C2H6/CH4 selectivities in MFM-300(Al) were estimated by IAST analysis as >1000, ∼380, and 5, respectively. The above IAST selectivity data were also validated via the measurement of dual-component adsorption isotherms for equimolar mixtures of C2H2/C2H4, C2H4/C2H6, C2H2/CH4, and C2H4/CH4 at 293 K under flow mode, indicating the preferred binding of unsaturated hydrocarbons to MFM-300(Al) host.
The binding sites for C2H2, C2H4, and C2H6 were studied by in situ synchrotron PXRD and NPD experiments. Two independent binding sites (I and II) were observed in each case: the unsaturated C2-molecules at site I exhibit a side-on interaction to the HO–Al group via formation of weak hydrogen bonds that are supplemented by additional supramolecular contacts to the aromatic hydrogen atoms and π⋯π interactions to the phenyl rings; C2-molecules at site II are located in the middle of the pore and interact primarily with the molecules at site I via intermolecular dipole interactions. The bond distances obtained from independent analysis of synchrotron X-ray diffraction, neutron diffraction, and DFT calculations are compared in Fig. 40 with very good agreement observed between the three methods. In addition to the static crystallographic study, a combined INS and DFT study was undertaken to visualise the binding dynamics for adsorbed C2H2, C2H4, and C2H6 molecules in MFM-300(Al). The study revealed a novel Al–OH to π(C![[triple bond, length as m-dash]](https://www.rsc.org/images/entities/char_e002.gif) C) hydrogen-bond interaction, which has not been observed previously, and thus represents a new type of supramolecular contact in host–guest systems. This study reveals the involvement of simultaneous and cooperative hydrogen-bonding, π⋯π interactions and inter-molecular dipole interactions in the binding of acetylene and ethylene to give up to twelve individual weak supramolecular interactions aligned within the host to form an optimal geometry for intelligent selective binding of hydrocarbons.
C) hydrogen-bond interaction, which has not been observed previously, and thus represents a new type of supramolecular contact in host–guest systems. This study reveals the involvement of simultaneous and cooperative hydrogen-bonding, π⋯π interactions and inter-molecular dipole interactions in the binding of acetylene and ethylene to give up to twelve individual weak supramolecular interactions aligned within the host to form an optimal geometry for intelligent selective binding of hydrocarbons.
 | ||
| Fig. 40 Views of the structural models for (a) MFM-300(Al)·3C2H2, (b) MFM-300(Al)·C2H4G, (c) MFM-300(Al)·C2H4E and (d) MFM-300(Al)·C2H6 (Al: green; carbon: grey; oxygen: red; hydrogen: white). These models were generated from DFT optimisations based upon the structural models obtained from synchrotron and neutron powder diffraction experiments. The details of the host–guest binding as shown in the blue square are enlarged and shown in the bottom row for each of the corresponding model. Hydrocarbon molecules in the channel and the host functional groups involved in cooperative binding are highlighted by the use of ball-and-stick mode. The π⋯HO hydrogen-bonds, π⋯π, and C⋯H supramolecular interactions, and inter-molecular dipole interactions are highlighted in cyan, grey, orange, and purple, respectively. The carbon atoms of second site of C2H2 are highlighted in blue. Sites I and II represent two preferred binding sites within the pore: molecules at site I interacts with the Al–OH groups and those at site II bind primarily with molecules at site I via dipole interactions. The energy barrier for 1D rotational motion between MFM-300(Al)·C2H4G and MFM-300(Al)·C2H4E was estimated to be 0.93 kJ mol−1. The bond distances obtained from DFT calculations, synchrotron PXRD and NPD are labelled as D, S and N, respectively, and are shown in Å. Due to the uncertainty of the hydrogen atom location, the π⋯HO hydrogen-bonds are described via the distance between the O-centre and the centroid of the C2 bond of hydrocarbon molecules. Reproduced from ref. 139 with permission from Nature Publishing Group. | ||
The separation of C2H2 and C2H4 is a technologically important goal, but is highly challenging due to their similar molecular sizes, volatilities, and electronic structures based upon unsaturated carbon–carbon bonds. This leads to very similar binding interactions for these substrates to open metal sites, with low preferential adsorption.50,59,142 The dynamics of MFM-300(Al) loaded with an equimolar mixture of C2H2/C2H4 were analysed to determine the relative binding of these two guests, and confirmed that in this binding competition, C2H2 has a stronger interaction to the host than C2H4 and directly supports the optimal selectivity and uptake capacity observed in the isotherm experiments. This INS study represents the first dynamic study of competing C2-hydrocarbons binding in a functional host material.
This work represents a classic example of applying in situ INS, NPD, PXRD and DFT techniques to analyse dynamic and structural properties of gas-loaded MOF materials to reveal that a combination of multiple weak supramolecular binding interactions is sufficient enough to bind CO2, SO2, C2H2, C2H4, and C2H6 molecules with both high selectivity and capacity. This offers the potential for application of new “easy-on/easy-off” capture systems for selective gas binding and separations that carry fewer economic and environmental penalties (Fig. 41).
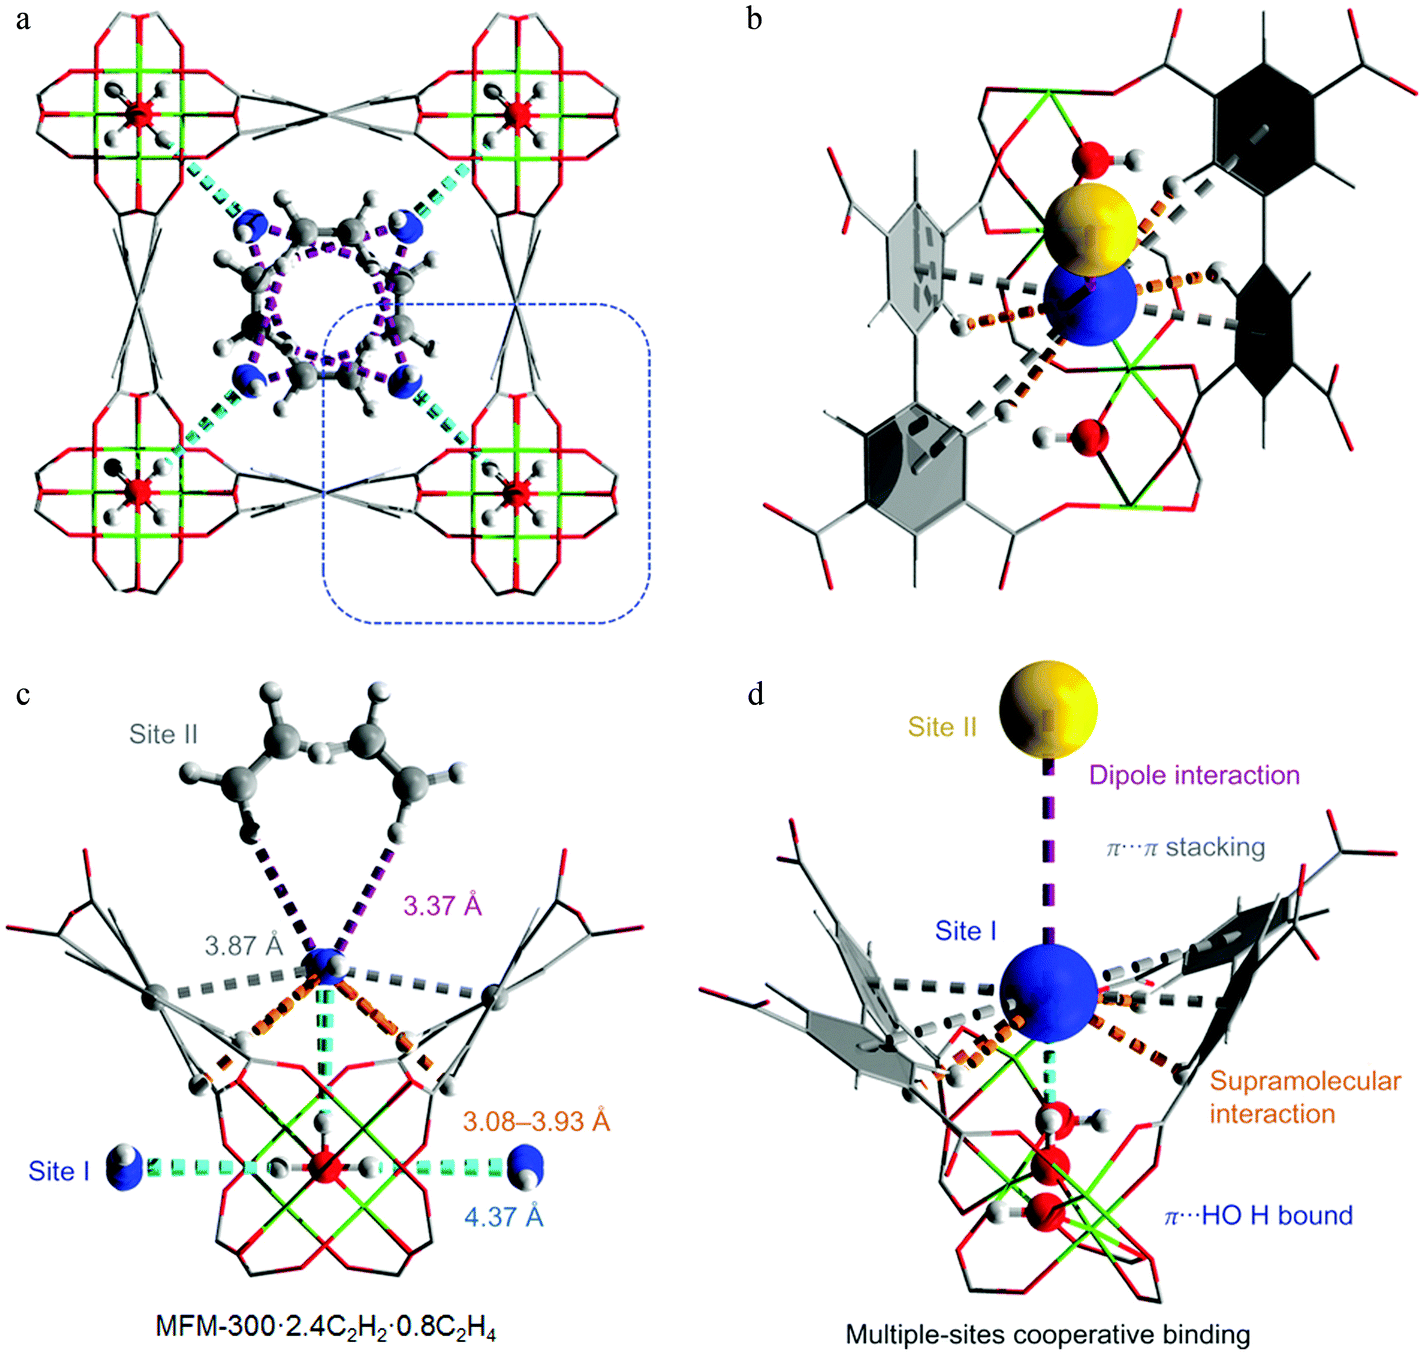 | ||
| Fig. 41 Views of the calculated structural models for C2H2–C2H4 mixture-loaded MFM-300(Al) (MFM-300(Al)·2.4C2H2·0.8C2H4) (Al: green; carbon: grey; oxygen: red; hydrogen: white). (a) and (c) Views of the structure of MFM-300(Al)·2.4C2H2·0.8C2H4 obtained from DFT calculations based upon INS spectra. The details of the host–guest binding as shown in the blue square are enlarged and shown in (c). The bond distances were obtained from DFT optimisation. The adsorbed C2H2 and C2H4 molecules in the pore are highlighted by the use of ball-and-stick mode. The carbon atoms of C2H2 are highlighted in blue. (b) and (d) Schematic views of the role of the –OH, –CH and phenyl ring groups in binding C2H2 and C2H4 molecules in a “pocket-like” cavity. Sites I and II represent two preferred binding sites within the pore, and are shown by blue and yellow balls, respectively. The π⋯HO hydrogen-bonds, π⋯π and C⋯H supramolecular interactions, and inter-molecular dipole interactions are highlighted in cyan, grey, orange, and purple, respectively. Reproduced from ref. 139 with permission from Nature Publishing Group. | ||
4.2 Selective CO2 binding in MFM-300(Ga2) and MFM-300(Ga1.87Fe0.13)
MOFs are usually synthesised using a single type of metal ion, and those containing mixtures of different metal ions are of great interest and represent a methodology to enhance and tune materials properties. MFM-300(Ga2) is isostructural145 with the Al(III) analogue MFM-300(Al)136 with pores decorated with –OH groups bridging Ga(III) centres. The isostructural Fe-doped material [Ga1.87Fe0.13(OH)2(L)], MFM-300(Ga1.87Fe0.13) can be prepared under similar conditions to MFM-300(Ga2) via reaction of a homogeneous mixture of Fe(NO3)3 and Ga(NO3)3 with biphenyl-3,3′,5,5′-tetracarboxylic acid.145 Thus, Fe-doping can be used to monitor the effects of the heteroatom centre within a parent Ga(III) framework without the requirement of synthesising the isostructural Fe(III) analogue MFM-300(Fe2). MFM-300(Ga2) shows the highest CO2 uptake (2.86 mmol g−1 at 273 K at 1 bar) for a Ga-based MOF. Fe-doping of MFM-300(Ga2) affords positive effects on gas adsorption capacities, particularly for CO2 adsorption, whereby MFM-300(Ga1.87Fe0.13) shows a 49% enhancement of CO2 adsorption capacity in comparison to the homo-metallic parent material. The single crystal X-ray structures of MFM-300(Ga2)-solv, MFM-300(Ga2), MFM-300(Ga2)·2.35CO2, MFM-300(Ga1.87Fe0.13)-solv, MFM-300(Ga1.87Fe0.13), and MFM-300(Ga1.87Fe0.13)·2.0CO2 have been determined at 195 K (Fig. 42 and 43).145 | ||
| Fig. 42 Views of single crystal structures of (a) and (d) MFM-300(Ga2)-solv; (b) and (e) MFM-300(Ga2) activated at 393 K and vacuum 10−4 mbar for 4 h; (c) and (f) MFM-300(Ga2)·2.35CO2, loaded with CO2 at 1 bar at 195 K for 2 h. The guest molecules (DMF, water, CO2) in the channels are highlighted using a ball-and-stick style (Ga: green; C: grey; O: red; H: white; N: blue). The carbon atom of COII2 is highlighted in orange. The hydrogen bonding interaction between the guest molecule and free –OH group is highlighted in purple. The electrostatic dipole interactions between CO2 molecules are highlighted in cyan (O3s⋯C1s) and green (O2s⋯C2s). Reproduced from ref. 145 with permission from the American Chemical Society. | ||
 | ||
| Fig. 43 Views of single crystal structures of (a) and (d) MFM-300(Ga1.87Fe0.13)-solv; (b) and (e) MFM-300(Ga1.87Fe0.13), activated at 393 K and vacuum 10−4 mbar for 4 h; (c) and (f) MFM-300(Ga1.87Fe0.13)·2.0CO2, loaded with CO2 at 1 bar at 195 K for 2 h. The guest molecules (DMF, water, CO2) in the channels are highlighted as ball-and-stick models (Ga: green; C: grey; O: red; H: white; N: blue). The carbon atom of COII2 is highlighted in orange. The hydrogen bonding interaction between the guest molecule and free –OH group is highlighted in purple. The electrostatic dipole interactions between CO2 molecules are highlighted in cyan (O3s⋯C1s) and green (O2s⋯C2s). Reproduced from ref. 145 with permission from the American Chemical Society. | ||
Upon loading of CO2 into the hosts, significant residual electron density was found in the pore by difference Fourier map analysis, and was sequentially assigned as two independent CO2 molecules populating at sites I (O1sC1sO2s) and II (O3sC2sO4s). In MFM-300(Ga2), the occupancy for these CO2 molecules at sites I and II refined to values of 0.43(3) and 0.74(3), respectively, yielding the overall formula [Ga2(OH)2(C16H6O8)]·2.35CO2 for the CO2-loaded material. The CO2 at site I is ordered and binds to the –OH group in an end-on fashion via a moderate hydrogen bonding interaction [H⋯O1s = 1.883(10) Å; <O–H⋯O1s = 180°]. Interestingly, this hydrogen bond distance is much shorter than that observed in MFM-300(Al2)·3.2CO2 system [H⋯O = 2.376(13) Å; <O–H⋯O = 180°] studied by in situ PXRD at 273 K,136 indicating the formation of a stronger hydrogen bonding interaction in MFM-300(Ga)·2.35CO2. Given that MFM-300(Ga2) and MFM-300(Al2) have the same framework structure and pore surface chemistry, this difference in hydrogen bond length is most likely due to the different metal centre (Al or Ga) affecting the relative acidity of the M–OH (M = Al, Ga) group. The CO2 at site II is disordered over two equally-occupied positions. In contrast to COI2, COII2 does not interact directly with framework atoms instead forming two weak electrostatic dipole interactions with COI2, between the electropositive C and electronegative O centres [C1s⋯O3s = 3.85(4) Å; C2s⋯O2s = 4.39(4) Å]. Significantly, this pattern of intermolecular interactions is distinct from the traditional “T-shape” dipole interaction observed in solid CO2, in [Zn2(Atz)2(ox)]·1.3CO2 (Atz2− = 3-amino-1,2,4-triazole; ox2− = oxalate)131 and in MFM-300(Al2)·3.2CO2.136
In contrast, the occupancies of the CO2 molecules at sites I and II in MFM-300(Ga1.87Fe0.13) both refined to values of 0.50 (1), yielding a formula of [Ga1.87Fe0.13(OH)2(C16H6O8)]·2.0CO2 for the CO2-loaded material. The CO2 at site I is ordered and binds to the –OH group in an end-on fashion via a weak hydrogen bonding interaction [H⋯O1s = 2.259(12) Å, <O–H⋯O1s = 180°]. Interestingly, this hydrogen bond distance is longer than that observed in the MFM-300(Ga2)·2.35CO2 system [H⋯O1s = 1.883(10) Å] indicating the formation of a weaker hydrogen bonding interaction in MFM-300(Ga1.87Fe0.13)·2.0CO2. This is consistent with the observed heat of adsorption which also decreases. The CO2 at site II is disordered over two equally-occupied positions. However, COII2 adopts a different orientation to that observed in MFM-300(Ga2)·2.35CO2, forming a typical “T-shape” dipole interaction with COI2 between the electropositive C centre and electronegative O centre [C1s⋯O3s = 3.207(6) Å, occurring twice]. Thus, the small percentage of Fe-doping into this solid solution has significant effect on the CO2 binding details, including the formation of both adsorbate–adsorbent hydrogen bond and adsorbate–adsorbate intermolecular dipole interactions.
4.3 CH4 and D2 binding in MFM-300(In)
The microporous hydroxy-decorated material, MFM-300(In) displays a high volumetric uptake of 202 v/v at 298 K and 35 bar for CH4 and 488 v/v at 77 K and 20 bar for H2.146 Direct observation and quantification of adsorbed H2 and CH4 molecules within MFM-300(In) have been achieved using a combination of NPD and INS techniques coupled with computational investigations. These complementary results suggest that the adsorbed CH4 molecules form specific interactions with metal-bound hydroxy groups within the pore, supplemented by intermolecular dipole interactions between adsorbed CH4 molecules and the phenyl-ring lined walls of the pore (Fig. 44). These cooperative supramolecular interactions allow packing of CH4 to very high density upon saturation (0.37 g cm−3) reminiscent of liquid CH4 (0.42 g cm−3 at 111 K) and 71% of that of the solid (0.52 g cm−3 at 20.4 K). Interestingly, the H4Cguest⋯H–Ohost interaction represents the first example of such molecular contact in MOFs, and contrasts with the structures observed in CH4/water clathrate materials in which the CH4 molecule is orientationally disordered and not observed to interact with the H⋯OH cage-forming linkage (Fig. 45).147 Similar binding has also been observed in H2-loaded MFM-300(In). | ||
| Fig. 44 View of the crystal structure of H2/CH4 loaded MFM-300(In) showing; (a) and (b) views of the corner-sharing extended [InO4(OH)2] chain highlighting interactions between the framework structure with D2 and CD4 molecules, respectively; (c) and (d) views of the c-crystallographic axis showing the positions of the adsorbed D2 and CD4 molecules respectively. D2 molecules in (a) and (c) are coloured according to the scheme: site I, green; site II, orange; site III, yellow; site IV, purple; site V, blue; site VI, grey; site VII, light blue. CD4 molecules in (b) and (d) are coloured according to the following scheme: site I, green; site II, orange; site III, yellow; site IV, purple; site V, blue; site VI, grey; site VII, light blue. Reproduced from ref. 146 with permission from the American Chemical Society. | ||
 | ||
| Fig. 45 Views of (a) the cage structure and H3C–Hguest⋯Ohost interaction of CH4 in a clathrate; (b) the channel and H4Cguest⋯H–Ohost interaction of CH4 in MFM-300(In). Distances do not take into account van der Waals radii; the equivalent distances taking this into account are 4.12 Å and 7.5 Å for the CH4–water clathrate and MFM-300(In), respectively. Reproduced from ref. 146 with permission from the American Chemical Society. | ||
5. Studies of H2 binding in anionic MOFs with extra-framework cations
The worldwide research on H2 storage in MOFs over the past decade has produced several MOF systems with exceptionally high gravimetric uptake of H2 with a record of ∼16 wt% total uptake capacity observed in NU-100148 and MOF-200149 (albeit at high pressure and low temperature, typically 77 K). However, these high uptakes drop dramatically with increasing temperature as a result of the weak binding interaction between H2 molecules and MOF hosts, and thus no MOF system is able to act as suitable H2 stores for on-board application to date. Increasing the interaction between H2 molecules and the host framework, and hence the associated isosteric heat of adsorption, represents a major challenge if these systems are to find practical use at more ambient temperatures.One particularly promising approach to significantly enhancing the H2-MOF interaction is to load active alkali and alkaline earth metal centres M (e.g., Li, Na, Mg) into MOF structures and to exploit the potential of strong binding of molecular H2 at free metal sites. This has been supported by computational and theoretical studies on the modelling of H2 adsorbed into M-doped MOF hosts.150–156 However, doping of active M(0) into a MOF material is intrinsically problematic by experiment due to the high reactivity of M(0) with the cationic metal clusters and organic ligands that constitute the MOF structures. Thus, doping with M+/2+ ions appears to be a more controllable and feasible route to interrogate and understand H2 binding in a doped MOF host. Porous anionic MOFs can provide an excellent platform to introduce M+/2+ ions within a framework structure via balancing the overall charge of the framework.
Zeolite-like MOFs (ZMOFs) are anionic and as such extra framework cations (i.e., M+/2+ ions) can readily be introduced. One representative example from this ZMOF family, rho-ZMOF, was reported to exhibit facile ion-exchange capability in a similar way as zeolites.157 The original In(III)-imidazoledicarboxylate rho-ZMOF has a formula of [In48(HImDC)96]48− and can incorporate 48 mono-cations or 24 double cations within the cage. Three different cations (dimethylammonium: DMA+, Li+, Mg2+) were introduced into the cage to give iso-structural samples of DMA-rho-ZMOF, Li-rho-ZMOF and Mg-rho-ZMOF.157 The rotational transitions of adsorbed H2 molecules in these three materials were studied by INS to compare the effect of extra-cation on the H2 binding.
The adsorption isotherms for H2 in Li-rho-ZMOF and Mg-rho-ZMOF below 20 mbar display a steeper rise in uptake than the parent DMA-rho-ZMOF, indicating the presence of stronger H2 binding interactions in the Li/Mg-exchanged MOFs. This has also been supported by calculation of isosteric heats of adsorption of 8.0, 9.1, and 9.0 kJ mol−1 for DMA-rho-ZMOF, Li-rho-ZMOF and Mg-rho-ZMOF, respectively. Synchrotron single crystal diffraction on Mg-rho-ZMOF has successfully determined the position and coordination of the Mg2+ ion which is bound to six water molecules to give a hexaaqua complex [Mg(OH2)6]2+ which forms hydrogen bonds to carboxylate oxygen centres of the framework (Fig. 46). Unfortunately, TGA data shows that it is not possible to remove the coordinated water molecules on the Mg2+ site before the MOF host starts to decompose. The position of the Li+ ion was not located due to the disorder of the cationic site. However, it is reasonable to estimate that Li+ in Li-rho-ZMOF is also fully coordinated to four water molecules to give a tetraaqua complex [Li(OH2)4]+ which form hydrogen bonds to the MOF host. Therefore, neither Mg2+ nor Li+ site is directly accessible to the adsorbed H2 molecules from a crystallographic view.
 | ||
| Fig. 46 Top: view of the single-crystal structure of Mg-rho-ZMOF showing the cubohemioctahedral cages (green) containing 12 [Mg(OH2)6]2+ cations. All H atoms have been omitted for clarity. Bottom: View of the [Mg(OH2)6]2+ complex situated near the four-membered rings of each cage, interacting with the MOF through hydrogen bonds (shown as black dotted lines; oxygen to oxygen distance is ∼2.9 Å) with four of the aqua ligands. Reproduced from ref. 157 with permission from the American Chemical Society. | ||
INS spectra for H2-loaded DMA-rho-ZMOF, Li-rho-ZMOF and Mg-rho-ZMOF are similar. At low loading, each has four reasonably well-defined binding sites for H2 with very small energy barrier for H2 rotation on each site. In comparison to a similar study carried out on Li+-exchanged zeolite FAU-LiX which presents two strong energy transfer peaks at ∼1 and 7.5 meV,158 Li-rho-ZMOF does not show such low energy transfer peaks, indicating the lack of strong binding to the Li+ site. This is consistent with the formation of [Li(OH2)4]+ in the pore with Li+ cation not directly accessible. A similar conclusion has been drawn for H2-loaded Mg-rho-ZMOF. A direct comparison of the INS spectra for H2-loaded Li-rho-ZMOF and the parent DMA-rho-ZMOF shows that in the former there is an additional increase in intensity in the region between ∼6 and 10 meV. This can be assigned to be the interaction between H2 molecules and the Li+-water complex, though the contribution is not significant. Based upon these results, the relatively small observed enhancement of H2 adsorption properties most likely originates from the increased electrostatic field in the cavity due to the extra framework cations rather than due to any direct binding interaction between these sites to H2.
One alternative approach to synthesise anionic MOFs is based upon the linking of tetrahedral nodes derived from In(III) centres bound to isophthalate tetracarboxylates to form 4-connected (4-c) structures. The discrepancy between the charge on In(III) and the negative organic linker L4− leads to the formation of anionic complexes [In(L)]− in which the net charge has to be balanced by counter-cation(s). A series of anionic MOFs (MFM-200, 204, 206, 208; MFM = Manchester Framework Material, replacing the NOTT designation) were designed and synthesised via this route.159–162 In the as-synthesised sample, organic cations (DMA+ or dihydropiperazinium2+) act as the counter cations and partially block the pore entrance owing to their bulky nature. These organic counter-cations within the as-synthesized materials are exchangeable to smaller Li+ cations while still maintaining the porosity of the framework structure. In this way, a number of corresponding Li+-loaded iso-structural MOFs (MFM-201, 205, 207, 209) were generated to provide the platform to study the H2 binding interaction to the framework cation Li+ sites.159–162 One of significant improvements of this system is the successful location of the position of Li+ ion within the channels of MFM-201, 207, and 209.
The H2 binding interaction in MFM-209 was studied with INS and is discussed here.159 MFM-209-solv is doubly interpenetrated and has three different types of channels (A, B and C) due to the overlapping of the two networks. The three channels have different sizes and surface chemistry (Fig. 47a and b).162 X-ray crystallography confirms that the Li+ cation sits in the smallest channel C, tetrahedrally coordinated to four O-centres, two from carboxylate groups and two from coordinated H2O molecules. Thus, the [In(O2CR)4] moiety is able to anchor Li+via two chelate carboxylate groups, leaving potentially accessible and exposed Li+ sites after desolvation. Indeed, an in situ IR experiment has confirmed the removal of these two coordinated water molecules on Li+ sites at around 150 °C, giving open Li+ sites in the activated MOF. This observation is also consistent with the 7Li-NMR experiment which suggests that in the desolvated MOF the coordination environment of Li+ ion has lower symmetry.162 Desolvated MFM-209 shows an enhancement of H2 uptake capacity of 31% in comparison to the parent MOF that contains organic counter-cations. This increase in uptake capacity is also accompanied by an increase of 38% in isosteric heat of H2 adsorption. Significantly, MFM-209 displays a very high heat of adsorption of 12 kJ mol−1, which is higher than most reported MOF materials (4–7 kJ mol−1 typically).
 | ||
| Fig. 47 Space-filling views of the framework structures of (a) MFM-208 and (b) MFM-209 containing different cations within channels. (c) INS difference spectra for the various H2/Li loadings in MFM-209. (d) View of the self-assembly and cation-exchange processes within anionic MFM-200, 201, 206, 207, 208 and 209. Reproduced from ref. 159 and 162 with permission from the Royal Society of Chemistry and the American Chemical Society, respectively. | ||
To provide insight into the increase of heat of adsorption, INS was used to interrogate the presence of potential binding between adsorbed H2 and the open Li+ site in MFM-209.159 The INS spectra for H2-loaded MFM-209 show a significant increase in intensity due to the recoil of H2. The difference INS spectra of H2-loaded and bare MFM-209 displays three distinct energy transfer peaks at 10, 16 and 19 meV (Fig. 47c). With increasing H2 loadings, these peaks increase linearly in intensity until saturation indicating that for all loadings, the adsorbed H2 molecules are interacting with the same sites within the framework of MFM-209 and these sites do not reach saturation at low pressure. The peaks in the INS spectra correspond to the rotational J = 0 to J = 1 transition of the H2 molecule, J(1 ← 0). In principle, three lines are present due to the contribution from the initial state (where m = 0) and the final state (where m = 1, 0, +1). The lowest energy transfer peak at 10 meV in the spectra suggests the adsorbed H2 molecules in MFM-209 interact with [In(O2CR)4] centres, rather than via direct binding to open Li+ sites. This is because, in the latter case, the INS peak will stop increasing when the site reaches saturation for adsorbed H2 molecules. Thus, the enhancement of the enthalpy of adsorption of H2 upon loading Li+ cations must originate from a change in the charge distribution in the [In(O2CR)4] moiety by incorporation of Li+ ions. This deduction is also consistent with the observation that Li+ doping enhances the adsorption enthalpy at all H2 loadings, rather than only at low H2 loadings. The nature of the extra-framework cations introduced from cation-exchange reactions here is not strictly comparable with those of M(0)-doping150–156 since the latter also involves reduction of the framework host. It, therefore, still remains a practical challenge to introduce more active M(0) sites into MOFs to improve the H2 binding at more ambient conditions.
6. Trapping of unusual guests and reactive intermediates in porous hosts
In 2002, Fujita et al. reported the synthesis of the doubly interpenetrated 3D coordination polymer [(ZnI2)3(TPT)2]·6(C6H5NO2) [TPT = 2,4,6-tris(4-pyridyl)triazine].163 Upon removal of the enclathrated solvent molecules under vacuum, a compression of the two nets occurs with the material retaining its crystallinity. This process is not only reversible, but the guest molecules can also be exchanged for a variety of solvents in a single-crystal to single-crystal manner. In the case of benzene, the guest molecules were reported to be ordered in the pores, although no specific interactions with the frameworks could be identified. Large aromatic molecules such as triphenylene (Fig. 48), anthracene and perylene have also been inserted in the pores of [(ZnI2)3(TPT)2] which remains crystalline while the guests are ordered due to π–π interactions with the electron deficient ligand.164 | ||
| Fig. 48 Views of (a) crystal structure of [(ZnI2)3(TPT)2] accommodating triphenylene molecules, and (b) π–π interaction between TPT ligand and triphenylene guest. Adapted from ref. 164 with permission from the American Chemical Society. | ||
Further investigations on the insertion of functionalized triphenylenes165 led to the observation, by X-ray crystallography, of a transient hemiaminal in a porous coordination network, a demonstration of the kinetic-trapping of a normally short-lived reaction intermediate.166 The [[(ZnI2)3(2)2(3)]·x(G)]n network 1 (2 = TPT = 2,4,6-tris(4-pyridyl)triazine; 3 = 1-aminotriphenylene; G = ethyl acetate, x ∼ 4) contains two types of pores of different shapes (A and B) with the amino groups of 3 facing directly into type-A pores (Fig. 49). A single crystal of [[(ZnI2)3(2)2(3)]·x(G)]n1 was cooled to 215 K on a diffractometer and immersed for 10 minutes in a cooled flow of an ethyl acetate solution of acetaldehyde applied via a capillary. The crystal was then further cooled to 90 K to stop the reaction and the structure collected to reveal a combination of unreacted amine (64%) and the transient hemiaminal (36%). Notably, the percentage conversion is consistent with the disordering of the amine over three sites (a–c) in the unreacted crystal (distributed a: 44%, b: 33% and c: 23%), with reaction occurring at only site b. The lack of reaction at a and c sites was attributed to steric hindrance. The hemiaminal intermediate was kinetically trapped at 90 K, but warming to 270 K and standing for 30 minutes led to completion of the condensation reaction. Collecting a final structure at 90 K confirmed complete conversion of the hemiaminal to the imine product.
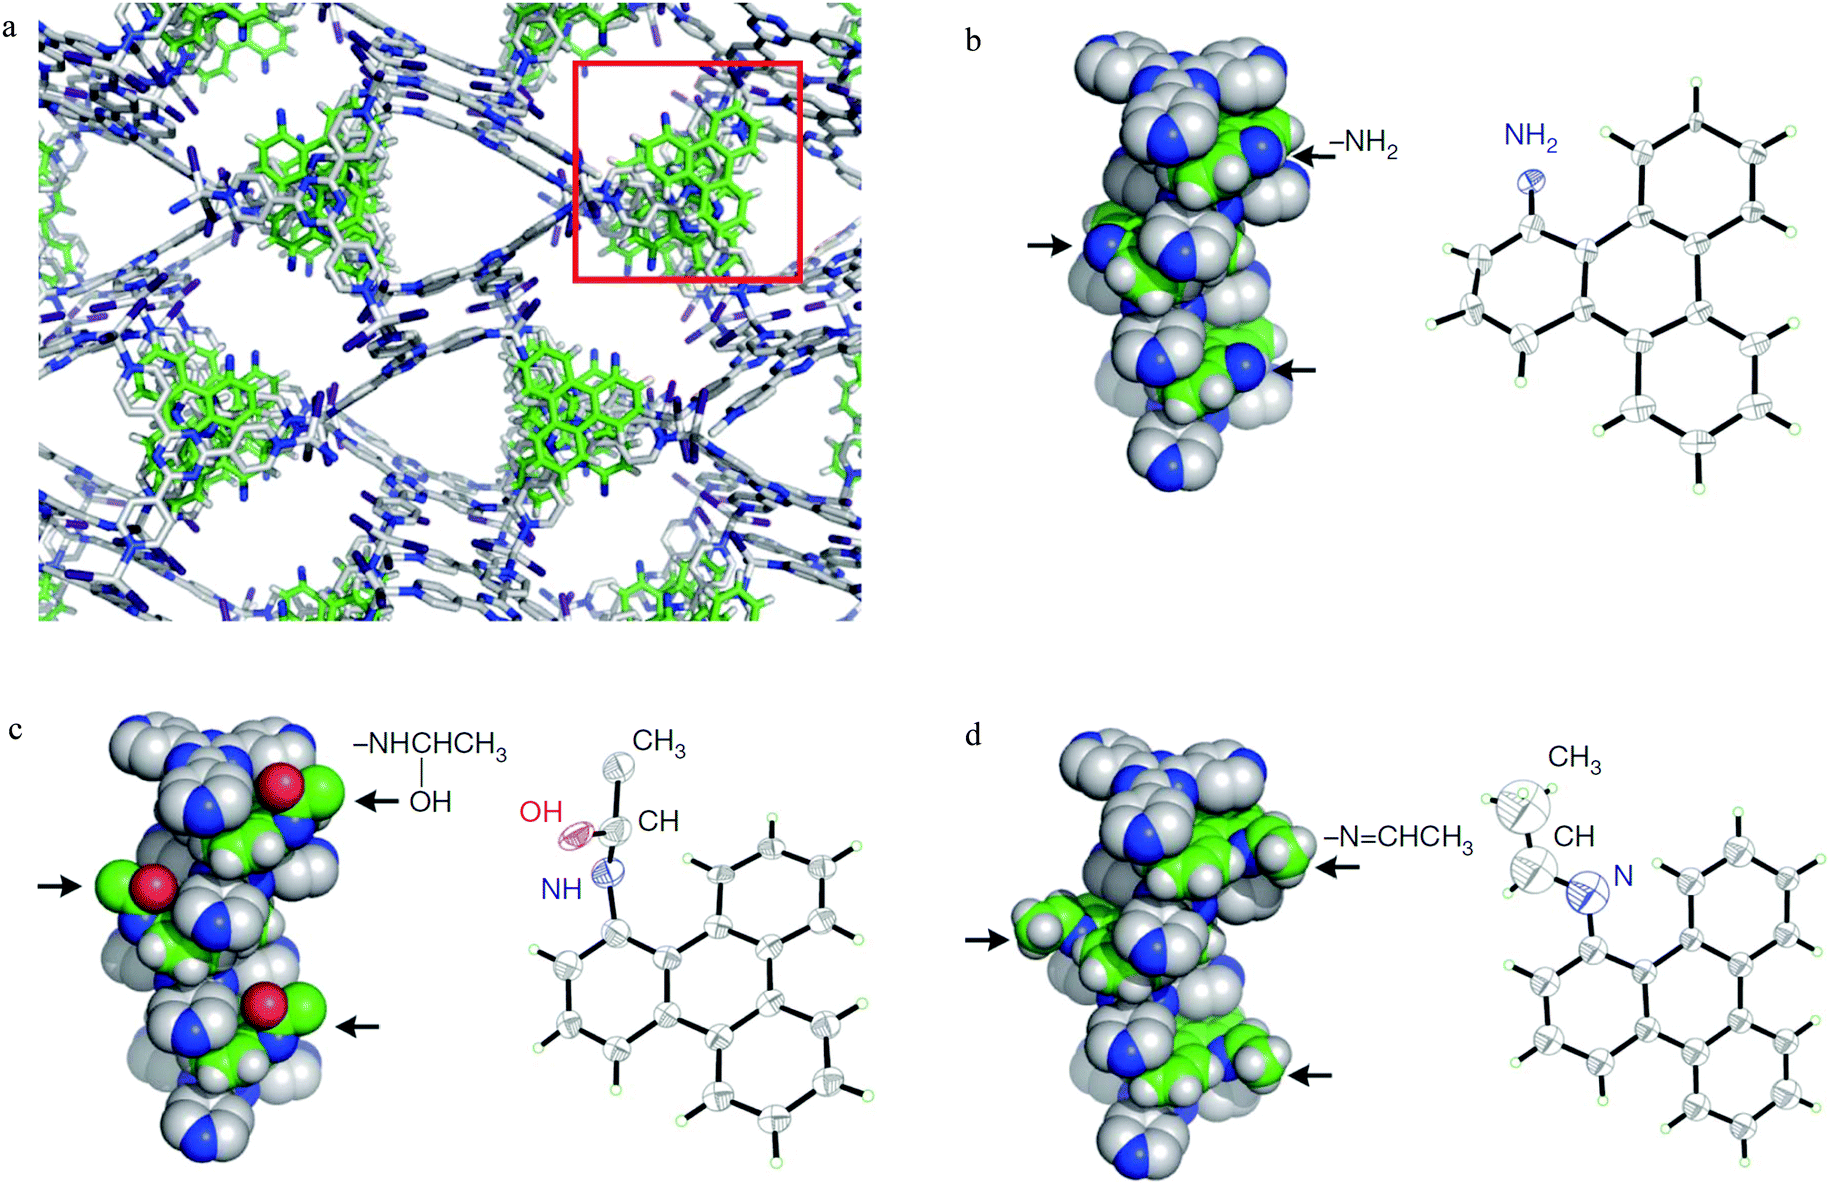 | ||
| Fig. 49 (a) Network structure of 1 [[(ZnI2)3(2)2(3)]·x(G)]n (G = ethyl acetate, x = 4). In the boxed region, aromatic amine 3 stacks in an alternating donor–acceptor fashion with triazine ligand 2. The pore is filled with solvent molecules (ethyl acetate), which are omitted for clarity; (b) left: view of the columnar stack of aromatic amine guest 3 and the triazine ligand; right: thermal-ellipsoid diagram of embedded guest 3; (c) the transient hemiaminal intermediate formed in situ by treating a crystal of 1 with acetaldehyde at 215 K for 10 min. Left: View of the columnar stack of hemiaminal 4 and the triazine ligand 2; right: embedded hemiaminal 4 (R*-isomer, 18% occupancy (18% S*-isomer not shown; R* and S* denote relative configurations)); (d) the final product (imine 5) obtained by warming hemiaminal 4 at 270 K for 30 min. Left: View of the columnar stack of imine 5 and triazine ligand 2; right: embedded imine 5. All thermal-ellipsoid diagrams are drawn at 30% probability. Colours: carbon, light grey in 2, green in 3, 4 and 5; nitrogen, blue; oxygen, red; hydrogen, white. Hydrogen atoms of 2 are omitted for clarity. Arrows in b, c and d indicate the positions of –NH2, –NHCH(OH)CH3 and –NCHCH3 groups, respectively. Reproduced from ref. 166 with permission from the Nature Publishing Group. | ||
The exchange properties of [(ZnI2)3(TPT)2] are not limited to large, simple aromatic molecules. The flexibility and strong binding ability of this coordination framework were used to develop a methodology for direct crystallographic characterisation of trace amounts of a large variety of molecules, including absolute configuration of chiral compounds such as santonin (Fig. 50) by loading them in the pores of a single crystal of the coordination polymer.167–170 While this approach has some significant challenges, both in reproducibility and in substrate scope, a few other examples that exploit the concept have been reported.171,172
 | ||
| Fig. 50 (a) Network structure of the clathrate comprising santonin and [(ZnI2)3(TPT)2]; (b) ORTEP drawing (50% probability) of santonin trapped in the pore and chemical structure of santonin. Reproduced from ref. 167 with permission from the Nature Publishing Group. | ||
7. Adsorbate superlattice formation in MOFs revealed by SAXS
The applicability of a laboratory-designed small-angle X-ray scattering (SAXS) set-up for studying the adsorption behavior of guest molecules in the mesoporous IRMOF-74 series has been reported.173 Specifically, high resolution in situ SAXS data on Ar adsorption in IRMOF-74-V-hex enabled the accurate mapping of Ar distribution in the pore structure at different pressures (Fig. 51). The adsorption of Ar was defined by five different adsorption stages during the entire studied pressure range (0–100 kPa). The adsorbate electron-distribution maps from SAXS analysis revealed that Ar interacts with the open metal sites at stages 1 and 2 (low pressure region <27 kPa). When the pressure was increased to stage 3 (27–33 kPa), Ar molecules begin to fill the pores, leading to a steep increase in gas uptake. The corresponding hk = 10 reflection intensity decreased sharply during this stage, while a new broad peak at q = 0.10 Å−1 emerged. The emergence of this broad peak unambiguously represents the aggregation point in the initiation of formation of extra adsorption domains, whereby adsorbate atoms gather in certain pore regions in higher numbers than the average. As confirmed by the appearance of superlattice reflections in the SAXS patterns, these adsorption domains form the adsorbate superlattice at stage 4 (33–50 kPa). Upon further increases in pressure (stage 5, >50 kPa), the extra adsorption domains and superlattice reflections disappear, and the electron density in the centre region of the pores gradually increases, indicating argon fills among the pores in a uniform manner. This study indicates that adsorbate–adsorbate interactions within and across adjacent pores play a major role in gas uptake and release in porous MOFs. | ||
| Fig. 51 Mapping of the distribution of Ar in IRMOF-74-V-hex. (a) Ar uptake by IRMOF-74-V-hex at different pressures. The isotherm shows five stages (1 to 5), with distinct slopes. Three points (red, dark green and light blue) are highlighted for the start, end/start and end of two events unobserved in type IV isotherms. (b) SAXS scattering profiles measured along the entire adsorption process at 11 different gas pressures, covering the different stages of Ar adsorption. The patterns are overlaid in linear scale with colours corresponding to the points in the isotherm. (c) Three-dimensional contour map of the electron-density profile of Ar at 27 kPa. The mesopores are covered by Ar at this point. (d) Projected Ar distribution in two dimensions from the three-dimensional contour maps. Each two-dimensional map reveals the distribution of Ar within the MOF structure at a certain pressure. The red lines at 27 kPa indicate the Ar profile projection in two directions (metal site to metal site, and wall to wall). Reproduced from ref. 173 with permission from the Nature Publishing Group. | ||
8. Conclusions
Significant advances have been made in the field of porous MOFs, particularly in the field of high capacity gas storage and selective recognition, binding and separation of molecular substrates. Understanding the molecular mechanism by which these MOFs bind gas molecules from both crystallographic and dynamic perspectives provides key insight into the design and discovery of materials with improved properties. This article has reviewed recent advances and significant achievements on the successful characterisation of guest-loaded MOF materials via synchrotron PXRD, single crystal diffraction, NPD, INS, QENS, SAXS, IR, and NMR techniques. The combination of these experimental approaches, particularly with both diffraction and spectroscopic methods, has yielded important rationalisation of materials property and function in terms of the mechanism of substrate binding at a molecular level. The role of open metal centres and pendant functional groups in the pore of MOFs has been discussed with the former providing specific binding to guest molecules, often with high selectivity. However, materials incorporating such sites usually suffer from stability and reversibility issues, while the binding of guest molecules via a combination of moderate-to-weak supramolecular based interactions via ligand functionalization affords fewer energy penalties with improved materials stability. The studies described herein on the elucidation of binding sites and host–guest interactions with porous MOFs enables and assists the design and optimisation of future “smart materials” in which high adsorption capacity, selectivity and stability may be achieved simultaneously.Acknowledgements
We thank Universities of Manchester and Nottingham, EPSRC and ERC for funding. Our work involving synchrotron and neutron scattering techniques was supported by STFC ISIS facility, Diamond Light Source, ERSF, ILL, ALS and ORNL. MS acknowledges receipt of a Russian Megagrant from the Russian Ministry of Education and Science. TLE gratefully acknowledges the Royal Society for the award of a University Research Fellowship.References
- H. C. Zhou, J. R. Long and O. M. Yaghi, Chem. Rev., 2012, 112, 673–674 CrossRef CAS PubMed.
- J. R. Long and O. M. Yaghi, Chem. Soc. Rev., 2009, 38, 1201–1507 RSC.
- P. C. H. Mitchell, S. F. Parker, A. J. Ramirez-Cuesta and J. Tomkinson, Vibrational spectroscopy with neutrons with applications in chemistry, biology, material sciences and catalysis, World Scientific, Singapore, 2005 Search PubMed.
- Y. Yan, S. Yang, A. J. Blake and M. Schröder, Acc. Chem. Res., 2014, 47, 296–307 CrossRef CAS PubMed.
- M. P. Suh, H. J. Park, T. K. Prasad and D.-W. Lim, Chem. Rev., 2012, 112, 782–835 CrossRef CAS PubMed.
- T. A. Makal, J.-R. Li, W. Lu and H.-C. Zhou, Chem. Soc. Rev., 2012, 41, 7761–7779 RSC.
- J. A. Mason, M. Veenstra and J. R. Long, Chem. Sci., 2014, 5, 32–51 RSC.
- J.-R. Li, J. Sculley and H.-C. Zhou, Chem. Rev., 2012, 112, 869–932 CrossRef CAS PubMed.
- J. Lee, O. K. Farha, J. Roberts, K. A. Scheidt, S. T. Nguyen and J. T. Hupp, Chem. Soc. Rev., 2009, 38, 1450–1459 RSC.
- S. S. Y. Chui, S. M. F. Lo, J. P. H. Charmant, A. G. Orpen and I. D. Williams, Science, 1999, 283, 1148–1150 CrossRef CAS PubMed.
- V. K. Peterson, C. M. Brown, Y. Liu and C. J. Kepert, J. Phys. Chem. C, 2011, 115, 8851–8857 CAS.
- Y. Liu, C. M. Brown, D. A. Neumann, V. K. Peterson and C. J. Kepert, J. Alloys Compd., 2007, 446–447, 385–388 CrossRef CAS.
- X. Lin, N. R. Champness and M. Schröder, in Functional Metal–Organic Frameworks: Gas Storage, Separation and Catalysis, Topics in Current Chemistry, ed. M. Schröder, 2010, vol. 293, pp. 35–76 Search PubMed.
- X. Lin, J. Jia, X. Zhao, K. M. Thomas, A. J. Blake, G. S. Walker, N. R. Champness, P. Hubberstey and M. Schröder, Angew. Chem., Int. Ed., 2006, 45, 7358–7364 CrossRef CAS PubMed.
- Y. Yan, I. Telepeni, S. Yang, X. Lin, W. Kockelmann, A. Dailly, A. J. Blake, W. Lewis, G. S. Walker, D. R. Allan, S. A. Barnett, N. R. Champness and M. Schröder, J. Am. Chem. Soc., 2010, 132, 4092–4094 CrossRef CAS PubMed.
- Y. Peng, V. Krungleviciute, I. Eryazici, J. T. Hupp, O. K. Farha and T. Yildirim, J. Am. Chem. Soc., 2013, 135, 11887–11894 CrossRef CAS PubMed.
- H. Wu, J. M. Simmons, Y. Liu, C. M. Brown, X. S. Wang, S. Ma, V. K. Peterson, P. D. Southon, C. J. Kepert, H. C. Zhou, T. Yildirim and W. Zhou, Chem. – Eur. J., 2010, 16, 5205–5214 CrossRef CAS PubMed.
- S. C. Xiang, W. Zhou, J. M. Gallegos, Y. Liu and B. L. Chen, J. Am. Chem. Soc., 2009, 131, 12415–12419 CrossRef CAS PubMed.
- D. F. Sava, K. W. Chapman, M. A. Rodriguez, J. A. Greathouse, P. S. Crozier, H. Zhao, P. J. Chupas and T. M. Nenoff, Chem. Mater., 2013, 25, 2591–2596 CrossRef CAS.
- L. J. Murray, M. Dincã, J. Yano, S. Chavan, S. Bordiga, C. M. Brown and J. R. Long, J. Am. Chem. Soc., 2010, 132, 7856–7857 CrossRef CAS PubMed.
- X. Lin, I. Telepeni, A. J. Blake, A. Dailly, C. M. Brown, J. M. Simmons, M. Zoppi, G. S. Walker, K. M. Thomas, T. J. Mays, P. Hubberstey, N. R. Champness and M. Schröder, J. Am. Chem. Soc., 2009, 131, 2159–2171 CrossRef CAS PubMed.
- J. Kubas Gregory, Acc. Chem. Res., 1988, 21, 120–128 CrossRef.
- Y. Yan, A. J. Blake, W. Lewis, S. A. Barnett, A. Dailly, N. R. Champness and M. Schröder, Chem. – Eur. J., 2011, 17, 11162–11170 CrossRef CAS PubMed.
- Y. Yan, X. Lin, S. Yang, A. J. Blake, A. Dailly, N. R. Champness, P. Hubberstey and M. Schröder, Chem. Commun., 2009, 1025–1027 RSC.
- M. Dincã, W. S. Han, Y. Liu, A. Dailly, C. M. Brown and J. R. Long, Angew. Chem., Int. Ed., 2007, 46, 1419–1422 CrossRef PubMed.
- M. Dincã, A. Dailly, Y. Liu, C. M. Brown, D. A. Neumann and J. R. Long, J. Am. Chem. Soc., 2006, 128, 16876–16883 CrossRef PubMed.
- K. Sumida, S. Horike, S. S. Kaye, Z. R. Herm, W. L. Queen, C. M. Brown, F. Grandjean, G. J. Long, A. Dailly and J. R. Long, Chem. Sci., 2010, 1, 184–191 RSC.
- E. D. Bloch, M. R. Hudson, J. A. Mason, S. Chavan, V. Crocellà, J. D. Howe, K. Lee, A. L. Dzubak, W. L. Queen, J. M. Zadrozny, S. J. Geier, L.-C. Lin, L. Gagliardi, B. Smit, J. B. Neaton, S. Bordiga, C. M. Brown and J. R. Long, J. Am. Chem. Soc., 2014, 136, 10752–10761 CrossRef CAS PubMed.
- H. Sato, W. Kosaka, R. Matsuda, A. Hori, Y. Hijikata, R. V. Belosludov, S. Sakaki, M. Takata and S. Kitagawa, Science, 2014, 343, 167–170 CrossRef CAS PubMed.
- N. L. Rosi, J. Eckert, M. Eddaoudi, D. T. Vodak, J. Kim, M. O'Keeffe and O. M. Yaghi, Science, 2003, 300, 1127–1129 CrossRef CAS PubMed.
- B. Chen, M. Eddaoudi, S. T. Hyde, M. O'Keeffe and O. M. Yaghi, Science, 2001, 291, 1021–1023 CrossRef CAS PubMed.
- J. L. C. Rowsell, J. Eckert and O. M. Yaghi, J. Am. Chem. Soc., 2005, 127, 14904–14910 CrossRef CAS PubMed.
- A. R. Millward and O. M. Yaghi, J. Am. Chem. Soc., 2005, 127, 17998–17999 CrossRef CAS PubMed.
- N. L. Rosi, J. Kim, M. Eddaoudi, B. Chen, M. O'Keeffe and O. M. Yaghi, J. Am. Chem. Soc., 2005, 127, 1504–1518 CrossRef CAS PubMed.
- P. D. C. Dietzel, Y. Morita, R. Blom and H. Fjellvag, Angew. Chem., Int. Ed., 2005, 44, 6354–6358 CrossRef CAS PubMed.
- P. D. C. Dietzel, B. Panella, M. Hirscher, R. Blom and H. Fjellvåg, Chem. Commun., 2006, 959–961 RSC.
- L. Valenzano, J. G. Vitillo, S. Chavan, B. Civalleri, F. Bonino, S. Bordiga and C. Lamberti, Catal. Today, 2012, 182, 67–79 CrossRef CAS.
- F. Bonino, S. Chavan, J. G. Vitillo, E. Groppo, G. Agostini, C. Lamberti, P. D. C. Dietzel, C. Prestipino and S. Bordiga, Chem. Mater., 2008, 20, 4957–4968 CrossRef CAS.
- S. P. Nandi and P. L. Walker, Sep. Sci., 1976, 11, 441–453 CAS.
- E. D. Bloch, L. M. Murray, W. L. Queen, S. Chavan, S. N. Maximoff, J. P. Bigi, R. Krishna, V. K. Peterson, F. Grandjean, G. J. Long, B. Smit, S. Bordiga, C. M. Brown and J. R. Long, J. Am. Chem. Soc., 2011, 133, 14814–14822 CrossRef CAS PubMed.
- Y. Li and R. T. Yang, Langmuir, 2007, 23, 12937–12944 CrossRef CAS PubMed.
- T. K. Maji, R. Matsuda and S. Kitagawa, Nat. Mater., 2007, 6, 142–148 CrossRef CAS PubMed.
- J. W. Yoon, S. H. Jhung, Y. K. Hwang, S. M. Humphrey, P. T. Wood and J. S. Chang, Adv. Mater., 2007, 19, 1830–1834 CrossRef CAS.
- B. Mu, P. M. Schoenecker and K. S. Walton, J. Phys. Chem. C, 2010, 114, 6464–6471 CAS.
- M. Xue, Z. J. Zhang, S. C. Xiang, Z. Jin, C. D. Liang, G. S. Zhu, S. L. Qiu and B. L. Chen, J. Mater. Chem., 2010, 20, 3984–3988 RSC.
- Y. S. Bae, A. M. Spokoyny, O. K. Farha, R. Q. Snurr, J. T. Hupp and C. A. Mirkin, Chem. Commun., 2010, 46, 3478–3480 RSC.
- P. D. Southon, D. J. Price, P. K. Nielsen, C. J. McKenzie and C. J. Kepert, J. Am. Chem. Soc., 2011, 133, 10885–10891 CrossRef CAS PubMed.
- D. J. Xiao, E. D. Bloch, J. A. Mason, W. L. Queen, M. R. Hudson, N. Planas, J. Borycz, A. L. Dzubak, P. Verma, K. Lee, F. Bonino, V. Crocellà, J. Yano, S. Bordiga, D. G. Truhlar, L. Gagliardi, C. M. Brown and J. R. Long, Nat. Chem., 2014, 6, 590–595 CrossRef CAS PubMed.
- X.-J. Hou, P. He, H. Li and X. Wang, J. Phys. Chem. C, 2013, 117, 2824–2834 CAS.
- Y. He, R. Krishna and B. Chen, Energy Environ. Sci., 2012, 5, 9107–9120 CAS.
- H. Bux, C. Chmelik, R. Krishna and J. Caro, J. Membr. Sci., 2011, 369, 284–289 CrossRef CAS.
- Y. He, W. Zhou, R. Krishna and B. Chen, Chem. Commun., 2012, 48, 11813–11831 RSC.
- S. Chavan, F. Bonino, J. G. Vitillo, E. Groppo, C. Lamberti, P. D. C. Dietzel, A. Zecchina and S. Bordiga, Phys. Chem. Chem. Phys., 2009, 11, 9811–9822 RSC.
- S. M. Chavan, G. C. Shearer, E. Bloch and S. Bordiga, ChemPhysChem, 2012, 13, 445–448 CrossRef CAS PubMed.
- Q. Yang, D. Liu, C. Zhong and J.-R. Li, Chem. Rev., 2013, 113, 8261–8323 CrossRef CAS PubMed.
- Z. Bao, S. Alnemrat, L. Yu, L. Vasiliev, Q. Ren, X. Lu and S. Deng, Langmuir, 2011, 27, 13554–13562 CrossRef CAS PubMed.
- P. Verma, X. Xu and D. G. Truhlar, J. Phys. Chem. C, 2013, 117, 12648–12660 CAS.
- H. Kim, J. Park and Y. Jung, Phys. Chem. Chem. Phys., 2013, 15, 19644–19650 RSC.
- E. D. Bloch, W. L. Queen, R. Krishna, J. M. Zadrozny, C. M. Brown and J. R. Long, Science, 2012, 335, 1606–1610 CrossRef CAS PubMed.
- S. J. Geier, J. A. Mason, E. D. Bloch, W. L. Queen, M. R. Hudson, C. M. Brown and J. R. Long, Chem. Sci., 2013, 4, 2054–2061 RSC.
- Y. S. Bae, K. L. Mulfort, H. Frost, P. Ryan, S. Punnathanam, L. J. Broadbelt, J. T. Hupp and R. Q. Snurr, Langmuir, 2008, 24, 8592–8598 CrossRef CAS PubMed.
- S. A. FitzGerald, C. J. Pierce, J. L. C. Rowsell, E. D. Bloch and J. A. Mason, J. Am. Chem. Soc., 2013, 135, 9458–9464 CrossRef CAS PubMed.
- J. G. Vitillo, L. Regli, S. Chavan, G. Ricchiardi, G. Spoto, P. D. C. Dietzel, S. Bordiga and A. Zecchina, J. Am. Chem. Soc., 2008, 130, 8386–8396 CrossRef CAS PubMed.
- C. Otero Areán, S. Chavan, C. P. Cabello, E. Garrone and G. T. Palomino, ChemPhysChem, 2010, 11, 3237–3242 CrossRef PubMed.
- N. Nijem, J. F. Veyan, L. Z. Kong, H. H. Wu, Y. G. Zhao, J. Li, D. C. Langreth and Y. J. Chabal, J. Am. Chem. Soc., 2010, 132, 14834–14848 CrossRef CAS PubMed.
- S. A. FitzGerald, B. Burkholder, M. Friedman, J. B. Hopkins, C. J. Pierce, J. M. Schloss, B. Thompson and J. L. C. Rowsell, J. Am. Chem. Soc., 2011, 133, 20310–20318 CrossRef CAS PubMed.
- S. A. FitzGerald, J. Hopkins, B. Burkholder, M. Friedman and J. L. C. Rowsell, Phys. Rev. B: Condens. Matter Mater. Phys., 2010, 81, 104305 CrossRef.
- E. Garrone and C. Otero Arean, Chem. Soc. Rev., 2005, 34, 846–857 RSC.
- S. Bordiga, L. Regli, F. Bonino, E. Groppo, C. Lamberti, B. Xiao, P. S. Wheatley, R. E. Morris and A. Zecchina, Phys. Chem. Chem. Phys., 2007, 9, 2676–2685 RSC.
- N. Nijem, J. F. Veyan, L. Z. Kong, K. H. Li, S. Pramanik, Y. G. Zhao, J. Li, D. Langreth and Y. J. Chabal, J. Am. Chem. Soc., 2010, 132, 1654–1664 CrossRef CAS PubMed.
- Y. Liu, H. Kabbour, C. M. Brown, D. A. Neumann and C. C. Ahn, Langmuir, 2008, 24, 4772–4777 CrossRef CAS PubMed.
- J. L. C. Rowsell and O. M. Yaghi, J. Am. Chem. Soc., 2006, 128, 1304–1315 CrossRef CAS PubMed.
- S. M. Chavan, O. Zavorotynska, C. Lamberti and S. Bordiga, Dalton Trans., 2013, 42, 12586–12595 RSC.
- W. L. Queen, E. D. Bloch, C. M. Brown, M. R. Hudson, J. A. Mason, L. J. Murray, A. J. Ramirez-Cuesta, V. K. Peterson and J. R. Long, Dalton Trans., 2012, 41, 4180–4187 RSC.
- K. Sumida, C. M. Brown, Z. R. Herm, S. Chavan, S. Bordiga and J. R. Long, Chem. Commun., 2011, 47, 1157–1159 RSC.
- F. Salles, D. I. Kolokolov, H. Jobic, G. Maurin, P. L. Llewellyn, T. Devic, C. Serre and G. Férey, J. Phys. Chem. C, 2009, 113, 7802–7812 CAS.
- M. T. Kapelewski, S. J. Geier, M. R. Hudson, D. Stück, J. A. Mason, J. N. Nelson, D. J. Xiao, Z. Hulvey, E. Gilmour, S. A. FitzGerald, M. Head-Gordon, C. M. Brown and J. R. Long, J. Am. Chem. Soc., 2014, 136, 12119–12129 CrossRef CAS PubMed.
- S. R. Caskey, A. G. Wong-Foy and A. J. Matzger, J. Am. Chem. Soc., 2008, 130, 10870–10871 CrossRef CAS PubMed.
- S. Chavan, J. G. Vitillo, E. Groppo, F. Bonino, C. Lamberti, P. D. C. Dietzel and S. Bordiga, J. Phys. Chem. C, 2009, 113, 3292–3299 CAS.
- P. Canepa, N. Nijem, Y. J. Chabal and T. Thonhauser, Phys. Rev. Lett., 2013, 110, 026102 CrossRef PubMed.
- L. Valenzano, B. Civalleri, S. Chavan, G. T. Palomino, C. O. Arean and S. Bordiga, J. Phys. Chem. C, 2010, 114, 11185–11191 CAS.
- H. Wu, J. M. Simmons, G. Srinivas, W. Zhou and T. Yildirim, J. Phys. Chem. Lett., 2010, 1, 1946–1951 CrossRef CAS.
- P. Canepa, C. A. Arter, E. M. Conwill, D. H. Johnson, B. A. Shoemaker, K. Z. Soliman and T. Thonhauser, J. Mater. Chem. A, 2013, 1, 13597–13604 CAS.
- L. Valenzano, B. Civalleri, K. Sillar and J. Sauer, J. Phys. Chem. C, 2011, 115, 21777–21784 CAS.
- K. Sillar and J. Sauer, J. Am. Chem. Soc., 2012, 134, 18354–18365 CrossRef CAS PubMed.
- D. Yu, A. O. Yazaydin, J. R. Lane, P. D. C. Dietzel and R. Q. Snurr, Chem. Sci., 2013, 4, 3544–3556 RSC.
- W. L. Queen, C. M. Brown, D. K. Britt, P. Zajdel, M. R. Hudson and O. M. Yaghi, J. Phys. Chem. C, 2011, 115, 24915–24919 CAS.
- H. Wu, W. Zhou and T. Yildirim, J. Am. Chem. Soc., 2009, 131, 4995–5000 CrossRef CAS PubMed.
- M. G. Lopez, P. Canepa and T. Thonhauser, J. Chem. Phys., 2013, 138, 154704 CrossRef CAS PubMed.
- X. Kong, E. Scott, W. Ding, J. A. Mason, J. R. Long and J. A. Reimer, J. Am. Chem. Soc., 2012, 134, 14341–14344 CrossRef CAS PubMed.
- L.-C. Lin, J. Kim, X. Kong, E. Scott, T. M. McDonald, J. R. Long, J. A. Reimer and B. Smit, Angew. Chem., Int. Ed., 2013, 52, 4410–4413 CrossRef CAS PubMed.
- J. Xu, V. V. Terskikh and Y. N. Huang, J. Phys. Chem. Lett., 2013, 4, 7–11 CrossRef CAS PubMed.
- D. Britt, H. Furukawa, B. Wang, T. G. Glover and O. M. Yaghi, Proc. Natl. Acad. Sci. U. S. A., 2009, 106, 20637–20640 CrossRef CAS PubMed.
- J. Liu, Y. Wang, A. I. Benin, P. Jakubczak, R. R. Willis and M. D. LeVan, Langmuir, 2010, 26, 14301–14307 CrossRef CAS PubMed.
- J. A. Mason, K. Sumida, Z. R. Herm, R. Krishna and J. R. Long, Energy Environ. Sci., 2011, 4, 3030–3040 CAS.
- D.-A. Yang, H.-Y. Cho, J. Kim, S.-T. Yang and W.-S. Ahn, Energy Environ. Sci., 2012, 5, 6465–6473 CAS.
- T. M. McDonald, W. R. Lee, J. A. Mason, B. M. Wiers, C. S. Hong and J. R. Long, J. Am. Chem. Soc., 2012, 134, 7056–7065 CrossRef CAS PubMed.
- H.-Y. Cho, D.-A. Yang, J. Kim, S.-Y. Jeong and W.-S. Ahn, Catal. Today, 2012, 185, 35–40 CrossRef CAS.
- E. J. García, J. P. S. Mowat, P. A. Wright, J. Pérez-Pellitero, C. Jallut and G. D. Pirngruber, J. Phys. Chem. C, 2012, 116, 26636–26648 Search PubMed.
- Z. R. Herm, R. Krishna and J. R. Long, Microporous Mesoporous Mater., 2012, 151, 481–487 CrossRef CAS.
- T. Remy, S. A. Peter, S. Van der Perre, P. Valvekens, D. E. De Vos, G. V. Baron and J. F. M. Denayer, J. Phys. Chem. C, 2013, 117, 9301–9310 CAS.
- K. Sumida, D. L. Rogow, J. A. Mason, T. M. McDonald, E. D. Bloch, Z. R. Herm, T.-H. Bae and J. R. Long, Chem. Rev., 2012, 112, 724–781 CrossRef CAS PubMed.
- P. D. C. Dietzel, R. E. Johnsen, H. Fjellvåg, S. Bordiga, E. Groppo, S. Chavan and R. Blom, Chem. Commun., 2008, 5125–5127 RSC.
- D. Frenkel and B. Smit, Understanding Molecular Simulation, Elsevier Inc., 2nd edn, 2002 Search PubMed.
- J. A. Mason, K. Sumida, Z. R. Herm, R. Krishna and J. Long, Energy Environ. Sci., 2011, 4, 3030–3040 CAS.
- K. B. Lee and S. Sircar, AIChE J., 2008, 54, 2293–2302 CrossRef CAS.
- E. J. Granite and H. W. Pennline, Ind. Eng. Chem. Res., 2002, 41, 5470–5476 CrossRef CAS.
- T. M. McDonald, D. M. D’Alessandro, R. Krishna and J. R. Long, Chem. Sci., 2011, 2, 2022–2028 RSC.
- T. M. McDonald, J. A. Mason, X. Kong, E. D. Bloch, D. Gygi, A. Dani, V. Crocella, F. Giordanino, S. O. Odoh, W. S. Drisdell, B. Vlaisavljevich, A. L. Dzubak, R. Poloni, S. K. Schnell, N. Planas, K. Lee, T. Pascal, L. F. Wan, D. Prendergast, J. B. Neaton, B. Smit, J. B. Kortright, L. Gagliardi, S. Bordiga, J. A. Reimer and J. R. Long, Nature, 2015, 519, 303–308 CrossRef CAS PubMed.
- C. Serre, F. Millange, C. Thouvenot, M. Nogues, G. Marsolier, D. Louer and G. Férey, J. Am. Chem. Soc., 2002, 124, 13519–13526 CrossRef CAS PubMed.
- T. Loiseau, C. Serre, C. Huguenard, G. Fink, F. Taulelle, M. Henry, T. Bataille and G. Férey, Chem. – Eur. J., 2004, 10, 1373–1382 CrossRef CAS PubMed.
- F. Millange, N. Guillou, R. I. Walton, J.-M. Greneche, I. Margiolaki and G. Férey, Chem. Commun., 2008, 4732–4734 RSC.
- L. Chen, J. P. S. Mowat, D. Fairen-Jimenez, C. A. Morrison, S. P. Thompson, P. A. Wright and T. Düren, J. Am. Chem. Soc., 2013, 135, 15763–15773 CrossRef CAS PubMed.
- K. Barthelet, J. Marrot, D. Riou and G. Férey, Angew. Chem., Int. Ed., 2002, 41, 281–284 CrossRef CAS.
- S. Bourrelly, P. L. Llewellyn, C. Serre, F. Millange, T. Loiseau and G. Férey, J. Am. Chem. Soc., 2005, 127, 13519–13521 CrossRef CAS PubMed.
- C. Serre, S. Bourrelly, A. Vimont, N. A. Ramsahye, G. Maurin, P. L. Llewellyn, M. Daturi, Y. Filinchuk, O. Leynaud, P. Barnes and G. Férey, Adv. Mater., 2007, 19, 2246–2251 CrossRef CAS.
- F. Salles, H. Jobic, A. Ghoufi, P. L. Llewellyn, C. Serre, S. Bourrelly, G. Férey and G. Maurin, Angew. Chem., Int. Ed., 2009, 48, 8335–8339 CrossRef CAS PubMed.
- F. Salles, H. Jobic, T. Devic, P. L. Llewellyn, C. Serre, G. Férey and G. Maurin, ACS Nano, 2010, 4, 143–152 CrossRef CAS PubMed.
- N. Rosenbach, H. Jobic, A. Ghoufi, F. Salles, G. Maurin, S. Bourrelly, P. L. Llewellyn, T. Devic, C. Serre and G. Férey, Angew. Chem., Int. Ed., 2008, 47, 6611–6615 CrossRef CAS PubMed.
- F. Salles, H. Jobic, T. Devic, V. Guillerm, C. Serre, M. M. Koza, G. Férey and G. Maurin, J. Phys. Chem. C, 2013, 117, 11275–11284 CAS.
- F. M. Mulder, B. Assfour, J. Huot, T. J. Dingemans, M. Wagemaker and A. J. Ramirez-Cuesta, J. Phys. Chem. C, 2010, 114, 10648–10655 CAS.
- H. Li, M. Eddaoudi, M. O'Keeffe and O. M. Yaghi, Nature, 1999, 402, 276–279 CrossRef CAS.
- J. L. C. Rowsell, E. C. Spencer, J. Eckert, J. A. K. Howard and O. M. Yaghi, Science, 2005, 309, 1350–1354 CrossRef CAS PubMed.
- E. C. Spencer, J. A. K. Howard, G. J. McIntyre, J. L. C. Rowsell and O. M. Yaghi, Chem. Commun., 2006, 278–280 RSC.
- R. Banerjee, A. Phan, B. Wang, C. Knobler, H. Furukawa, M. O'Keeffe and O. M. Yaghi, Science, 2008, 319, 939–943 CrossRef CAS PubMed.
- A. Phan, C. J. Doonan, F. J. Uribe-Romo, C. B. Knobler, M. O’Keeffe and O. M. Yaghi, Acc. Chem. Res., 2010, 43, 58–67 CrossRef CAS PubMed.
- D. Peralta, G. Chaplais, A. Simon-Masseron, K. Barthelet, C. Chizallet, A.-A. Quoineaud and G. D. Pirngruber, J. Am. Chem. Soc., 2012, 134, 8115–8126 CrossRef CAS PubMed.
- C.-H. Kuo, Y. Tang, L.-Y. Chou, B. T. Sneed, C. N. Brodsky, Z. Zhao and C.-K. Tsung, J. Am. Chem. Soc., 2012, 134, 14345–14348 CrossRef CAS PubMed.
- K. S. Park, Z. Ni, A. P. Côté, J. Y. Choi, R. D. Huang, F. J. Uribe-Romo, H. K. Chae, M. O'Keeffe and O. M. Yaghi, Proc. Natl. Acad. Sci. U. S. A., 2006, 103, 10186–10191 CrossRef CAS PubMed.
- H. Wu, W. Zhou and T. Yildirim, J. Am. Chem. Soc., 2007, 129, 5314–5315 CrossRef CAS PubMed.
- R. Vaidhyanathan, S. S. Iremonger, G. K. H. Shimizu, P. G. Boyd, S. Alavi and T. K. Woo, Science, 2010, 330, 650–653 CrossRef CAS PubMed.
- R. Vaidhyanathan, S. S. Iremonger, K. W. Dawson and G. K. H. Shimizu, Chem. Commun., 2009, 5230–5232 RSC.
- R. Vaidhyanathan, S. S. Iremonger, G. K. H. Shimizu, P. G. Boyd, S. Alavi and T. K. Woo, Angew. Chem., Int. Ed., 2012, 51, 1816–1829 CrossRef PubMed.
- C. Villiers, J. P. Dognon, R. Pollet, P. Thuery and M. Ephritikhine, Angew. Chem., Int. Ed., 2010, 49, 3465–3468 CrossRef CAS PubMed.
- G. T. Rochelle, Science, 2009, 325, 1652–1654 CrossRef CAS PubMed.
- S. Yang, J. Sun, A. J. Ramirez-Cuesta, S. K. Callear, W. I. F. David, D. P. Anderson, R. Newby, A. J. Blake, J. E. Parker, C. C. Tang and M. Schröder, Nat. Chem., 2012, 4, 887–894 CrossRef CAS PubMed . See also: M. Savage, Y. Cheng, T. L. Easun, J. E. Eyley, S. P. Argent, M. R. Warren, W. Lewis, C. Murray, C. C. Tang, M. D. Frogley, G. Cinque, J. Sun, S. Rudić, R. T. Murden, M. J. Benham, A. N. Fitch, A. J. Blake, A. J. Ramirez-Cuesta, S. Yang and M. Schröder, Adv. Mater., 2016, 28, 8705–8711 CrossRef PubMed.
- J. R. Long and O. M. Yaghi, Chem. Soc. Rev., 2009, 38, 1213–1214 RSC.
- S. Yang, A. J. Ramirez-Cuesta and M. Schröder, Chem. Phys., 2014, 428, 111–116 CrossRef CAS.
- S. Yang, A. J. Ramirez-Cuesta, R. Newby, V. Garcia-Sakai, P. Manuel, S. K. Callear, S. I. Campbell, C. C. Tang and M. Schröder, Nat. Chem., 2015, 7, 121–129 CrossRef CAS PubMed.
- A. L. Myers and J. M. Prausnitz, AIChE J., 1965, 11, 121–127 CrossRef CAS.
- S.-C. Xiang, Z. Zhang, C.-G. Zhao, K. Hong, X. Zhao, D.-R. Ding, M.-H. Xie, C.-D. Wu, M. C. Das, R. Gill, K. M. Thomas and B. Chen, Nat. Commun., 2011, 2, 204 CrossRef PubMed.
- S. J. Geier, J. A. Mason, E. D. Bloch, W. L. Queen, M. R. Hudson, C. M. Brown and J. R. Long, Chem. Sci., 2013, 4, 2054–2061 RSC.
- B. Li, Y. Zhang, R. Krishna, K. Yao, Y. Han, Z. Wu, D. Ma, Z. Shi, T. Pham, B. Space, J. Liu, P. K. Thallapally, J. Liu, M. Chrzanowski and S. Ma, J. Am. Chem. Soc., 2014, 136, 8654–8660 CrossRef CAS PubMed.
- Y.-S. Bae, C. Y. Lee, K. C. Kim, O. K. Farha, P. Nickias, J. T. Hupp, S. T. Nguyen and R. Q. Snurr, Angew. Chem., Int. Ed., 2012, 51, 1857–1860 CrossRef CAS PubMed.
- C. P. Krap, R. Newby, A. Dhakshinamoorthy, H. García, I. Cebula, T. L. Easun, M. Savage, J. E. Eyley, S. Gao, A. J. Blake, W. Lewis, P. H. Beton, M. R. Warren, D. R. Allan, M. D. Frogley, C. C. Tang, G. Cinque, S. Yang and M. Schröder, Inorg. Chem., 2016, 55, 1076–1088 CrossRef CAS PubMed.
- M. Savage, I. da Silva, M. Johnson, J. H. Carter, R. Newby, M. Suyetin, E. Besley, P. Manuel, S. Rudić, A. N. Fitch, C. Murray, W. I. F. David, S. Yang and M. Schröder, J. Am. Chem. Soc., 2016, 138, 9119–9127 CrossRef CAS PubMed.
- M. T. Kirchner, R. Boese, W. E. Billups and L. R. Norman, J. Am. Chem. Soc., 2004, 126, 9407–9412 CrossRef CAS PubMed.
- O. K. Farha, A. O. Yazaydin, I. Eryazici, C. D. Malliakas, B. G. Hauser, M. G. Kanatzidis, S. T. Nguyen, R. Q. Snurr and J. T. Hupp, Nat. Chem., 2010, 2, 944–948 CrossRef CAS PubMed.
- H. Furukawa, N. Ko, Y. B. Go, N. Aratani, S. B. Choi, E. Choi, A. Ö. Yazaydin, R. Q. Snurr, M. O'Keeffe, J. Kim and O. M. Yaghi, Science, 2010, 329, 424–428 CrossRef CAS PubMed.
- A. Blomqvist, C. M. Araujo, P. Srepusharawoot and R. Ahuja, Proc. Natl. Acad. Sci. U. S. A., 2007, 104, 20173–20176 CrossRef CAS PubMed.
- S. S. Han and W. A. Goddard, J. Phys. Chem. C, 2008, 112, 13431–13436 CAS.
- E. Klontzas, A. Mavrandonakis, E. Tylianakis and G. E. Froudakis, Nano Lett., 2008, 8, 1572–1576 CrossRef PubMed.
- A. Mavrandonakis, E. Tylianakis, A. K. Stubos and G. E. Froudakis, J. Phys. Chem. C, 2008, 112, 7290–7294 CAS.
- P. Dalach, H. Frost, R. Q. Snurr and D. E. Ellis, J. Phys. Chem. C, 2008, 112, 9278–9284 CAS.
- Y.-S. Bae and R. Q. Snurr, Microporous Mesoporous Mater., 2010, 135, 178–186 CrossRef CAS.
- D. Cao, J. Lan, W. Wang and B. Smit, Angew. Chem., Int. Ed., 2009, 48, 4730–4733 CrossRef CAS PubMed.
- F. Nouar, J. Eckert, J. F. Eubank, P. Forster and M. Eddaoudi, J. Am. Chem. Soc., 2009, 131, 2864–2870 CrossRef CAS PubMed.
- R. C. Lochan and M. Head-Gordon, Phys. Chem. Chem. Phys., 2006, 8, 1357–1370 RSC.
- S. Yang, S. K. Callear, A. J. Ramirez-Cuesta, W. I. F. David, J. Sun, A. J. Blake, N. R. Champness and M. Schröder, Faraday Discuss., 2011, 151, 19–36 RSC.
- S. Yang, X. Lin, A. J. Blake, K. M. Thomas, P. Hubberstey, N. R. Champness and M. Schröder, Chem. Commun., 2008, 6108–6110 RSC.
- S. Yang, X. Lin, A. J. Blake, G. S. Walker, P. Hubberstey, N. R. Champness and M. Schröder, Nat. Chem., 2009, 1, 487–493 CrossRef CAS PubMed.
- S. Yang, G. S. B. Martin, J. J. Titman, A. J. Blake, D. R. Allan, N. R. Champness and M. Schröder, Inorg. Chem., 2011, 50, 9374–9384 CrossRef CAS PubMed.
- K. Biradha and M. Fujita, Angew. Chem., Int. Ed., 2002, 41, 3392–3395 CrossRef CAS.
- O. Ohmori, M. Kawano and M. Fujita, J. Am. Chem. Soc., 2004, 126, 16292–16293 CrossRef CAS PubMed.
- M. Kawano, T. Kawamichi, T. Haneda, T. Kojima and M. Fujita, J. Am. Chem. Soc., 2007, 129, 15418–15419 CrossRef CAS PubMed.
- T. Kawamichi, T. Haneda, M. Kawano and M. Fujita, Nature, 2009, 461, 633–635 CrossRef CAS PubMed.
- Y. Inokuma, S. Yoshioka, J. Ariyoshi, T. Arai, Y. Hitora, K. Takada, S. Matsunaga, K. Rissanen and M. Fujita, Nature, 2013, 495, 461–466 CrossRef CAS PubMed.
- Y. Inokuma, S. Yoshioka, J. Ariyoshi, T. Arai, Y. Hitora, K. Takada, S. Matsunaga, K. Rissanen and M. Fujita, Nature, 2013, 501, 262 CrossRef CAS.
- Y. Inokuma, S. Yoshioka, J. Ariyoshi, T. Arai and M. Fujita, Nat. Protoc., 2014, 9, 246–252 CrossRef CAS PubMed.
- S. Yoshioka, Y. Inokuma, M. Hoshino, T. Sato and M. Fujita, Chem. Sci., 2015, 6, 3765–3768 RSC.
- K. Ikemoto, Y. Inokuma, K. Rissanen and M. Fujita, J. Am. Chem. Soc., 2014, 136, 6892–6895 CrossRef CAS PubMed.
- E. V. Vinogradova, P. Müller and S. L. Buchwald, Angew. Chem., Int. Ed., 2014, 53, 3125–3128 CrossRef CAS PubMed.
- H. S. Cho, H. Deng, K. Miyasaka, Z. Dong, M. Cho, A. V. Neimark, J. Ku Kang, O. M. Yaghi and O. Terasaki, Nature, 2015, 527, 503–507 CrossRef PubMed.
| This journal is © The Royal Society of Chemistry 2017 |