Calcium-dependent hydrolysis of supported planar lipids was triggered by honey bee venom phospholipase A2 with the right orientation at the interface†
Siqi
Kai
,
Xu
Li
,
Bolin
Li
,
Xiaofeng
Han
and
Xiaolin
Lu
 *
*
State Key Laboratory of Bioelectronics, School of Biological Science and Medical Engineering, Southeast University, Nanjing 210096, China. E-mail: lxl@seu.edu.cn
First published on 2nd November 2017
Abstract
Hydrolysis of planar phospholipids catalyzed by honey bee venom phospholipase A2 (bvPLA2) was studied. Experiments demonstrated that Ca2+ ions mediated between the lipids and bvPLA2, induced reorientation of bvPLA2, and activated hydrolysis. One of the hydrolysis products, fatty acids, was desorbed, and the other one, lysophospholipids, self-organized at the interface.
Introduction
Lipids are one of the basic building blocks in organisms for compartmentalization, energy storage and signal transduction.1 The metabolism and dynamic processes of lipids are thus of fundamental importance. Lipid-associated proteins, i.e. translocases, transporters, and anabolic and catabolic enzymes, can trigger the nature-customized programming processes of membrane lipids involving flip-flop, fission, fusion, budding, etc. through physical and/or chemical interactions. One of the important lipid-associated proteins is the phospholipase A2 (PLA2) super-family, which can be found in humans, snakes, mice, snails, bees, fungi and bacteria, etc.2 The ability of PLA2 to catalyze lipid hydrolysis at the sn-2 position of the glycerol backbone and generate lysophospholipids (lyso-PCs) and fatty acids suggests that this catalysis process is one of the exquisite choices of natural evolution, which has been confirmed by plenty of studies, including positive (catalysis) and negative (blocking active site) controls.3 A well-known example to demonstrate the high efficiency of PLA2 is the strong immune response caused by biting or stinging of the attacker which can deliver PLA2 to the victim. For this reason, people have been trying to engineer this process for surface patterning4 and bactericides.5 To date, the interfacial activation mechanism of PLA2 is still a key topic in the current membrane protein enzymology, which can directly or indirectly be related to the regular biological processes like vesicle trafficking, biomembrane asymmetry/deformation, and regulation of surface charge density.To investigate the details of the catalytic mechanism at the atomic/molecular levels, fundamental studies have been run to understand the binding structural information of PLA2 with the substrate via X-ray crystallography6 and nuclear magnetic resonance.7 The binding/catalysis dynamics3a,b,f,8 can thus be extracted, in which a whole catalytic cycle includes the adsorption/binding of PLA2 onto the lipid substrate and a later structural reorganization/lipid hydrolysis/product releasing process.2 Recently, two stages (lag and burst) after adsorption of PLA2 onto the substrate were confirmed via sum frequency generation (SFG) vibrational spectroscopy and atomic force microscopy (AFM).8e,9 The reorganization of the lipid molecules occurred in the first lag stage while the hydrolysis started from the edge sites of defects in the bilayer. Additionally, the single-enzyme activity was also measured recently, which verified the high catalytic efficiency of PLA2.10 In terms of substrate morphological transformation, recent fluorescence microscopic and AFM studies demonstrated that the hydrolysis products can self-organize into certain aggregate structures which can even retain their robustness at the air/solid interface.11 We notice that few studies involved the in situ monitoring of the interfacial structural evolution at both the molecular and macroscopic levels at the same time. Furthermore, the composition of the hydrolysis product is still not fully understood yet. To approach and visualize this interfacial event vividly, using the supported lipid bilayer as the substrate, we herein monitor the substrate hydrolysis process catalyzed by honey bee venom PLA2 (bvPLA2) with three different optical techniques, i.e. sum frequency generation (SFG) vibrational spectroscopy, laser scanning confocal microscopy (LSCM), and attenuated total reflection infrared spectroscopy (ATR-IR). The vibrational/fluorescence experimental results lead us to a picturesque and clear understanding of this important interfacial biological event, which contributes to the current enzymology knowledge (see Fig. 1, where a schematic for this interfacial hydrolysis process triggered by bvPLA2 is presented).
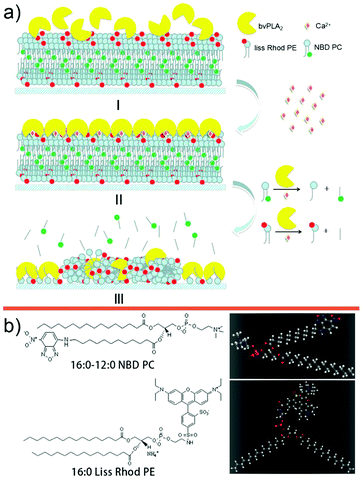 | ||
| Fig. 1 (a) Schematic diagram of the hydrolysis process. (b) Structural formulae and stick-and-ball models of NBD-PC and Liss Rhod PE. | ||
Results and discussion
Planar-supported lipid bilayers composed of 1,2-dioleoyl-sn-glycero-3-phosphocholine (DOPC) and 1,2-dipalmitoyl-sn-glycero-3-phosphocholine (DPPC) with a molar ratio of 1![[thin space (1/6-em)]](https://www.rsc.org/images/entities/char_2009.gif) :
:![[thin space (1/6-em)]](https://www.rsc.org/images/entities/char_2009.gif) 1, which is a frequently adapted composition to mimic an uncharged biomembrane, was used as the substrate. For the SFG experiment, the bilayers were prepared via the Langmuir–Blodgett (LB) and Langmuir–Schaefer (LS) methods on calcium fluoride (CaF2) prisms. For the LSCM assay and ATR-FTIR experiment, the bilayers were prepared via the vesicle fusion method on glass slides and zinc selenide (ZnSe) crystals, respectively. Details of the sample preparation can be found in the ESI.†
1, which is a frequently adapted composition to mimic an uncharged biomembrane, was used as the substrate. For the SFG experiment, the bilayers were prepared via the Langmuir–Blodgett (LB) and Langmuir–Schaefer (LS) methods on calcium fluoride (CaF2) prisms. For the LSCM assay and ATR-FTIR experiment, the bilayers were prepared via the vesicle fusion method on glass slides and zinc selenide (ZnSe) crystals, respectively. Details of the sample preparation can be found in the ESI.†
We first performed the SFG vibrational spectroscopic study for this interfacial biological event which can disclose the molecular-level structural information happening at the interface. SFG is a second-order nonlinear optical process, which is forbidden for centro-symmetric materials under the electric dipole approximation; at any interface where the inversion symmetric is necessarily broken, the SFG process is allowed.12 Here, the symmetric DPPC/DOPC lipid bilayer was used and the SFG vibrational signals in both the CH and CO ranges were monitored. Any change in the SFG vibrational signals would be caused by the bvPLA2 or/and Ca2+ added into the solution. To run the SFG experiment, the prism geometry was used with ssp polarization combination. The experimental details can be found in the ESI.†
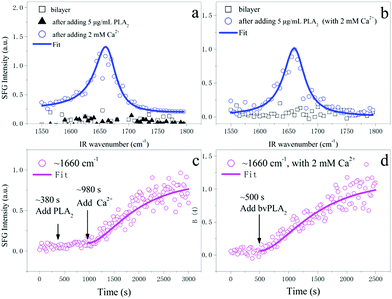
To probe the interfacial ordering of bvPLA2, we monitored the time-dependent SFG intensity variation located at 1660 cm−1, which is mainly contributed by the vibrational signal of the bvPLA2 α-helical structure (note that the unordered structure may contribute a little vibrational signal here). In order to appraise the effect of Ca2+, we let bvPLA2 be adsorbed on the surface of the supported lipid bilayer first and then added Ca2+. As shown in Fig. 2c, adding bvPLA2 (∼380 s) did not cause any signal increase of bvPLA2 (1660 cm−1, from ∼380 s to ∼980 s); only when Ca2+ was added (∼980 s), increase of the α-helical signal was observed. The LSCM experiment can prove that the time period of ∼380 s was long enough for the adsorption of bvPLA2 onto the lipid substrate surface. This indicates that the initially adsorbed bvPLA2 molecules adopted the random orientation at the interface and failed to initiate the hydrolysis; introducing Ca2+ can re-orientate the bvPLA2 molecules to an ordered state and initiate the hydrolysis process (later our LSCM experiment will doubly confirm this). Only with the ordered arrangement (the inversion symmetry is broken), the vibrational signals of the bvPLA2 molecules (α-helical structure) at the interface can be observed. Fig. 2a shows the collected static spectra initially, and on adding bvPLA2 and Ca2+ sequentially, which are in agreement with the time-dependent curve; namely, only when both bvPLA2 and Ca2+ were added, a strong amide I band from the α-helical structure of bvPLA2 can be observed. The static spectra in the CH range and OH range were also collected (see ESI†) for a DOPC/DPPC bilayer, adding bvPLA2 and adding Ca2+. Compared with the spectrum of the DOPC/DPPC bilayer, adding bvPLA2 did not affect the vibrational signals in the CH range (Fig. S4 in ESI†) since the hydrolysis did not happen. Afterwards, adding Ca2+ substantially affected the vibrational signals in the CH range (Fig. S4 in ESI†). Owing to the hydrolysis, the broken symmetry of the lipid bilayer led to strong CH vibrational signals. The other control experiment was also run with Ca2+ in the solution beforehand. As shown in Fig. 2d, once bvPLA2 was added (500 s), the α-helical signal started to increase and the signal began to level off at ∼2300 s. The corresponding static spectra before and after adding bvPLA2 are shown in Fig. 2b. The static SFG spectra in Fig. 2a and b can be fitted with a Lorentzian function (see ESI†). For the curves in Fig. 2c and d, a pseudo-absorption function can be applied to fit both curves (see ESI†). The similar curves and fitted parameters for Fig. 2c and d indicate the reorientation of bvPLA2 rather than the adsorption being the control step for the interfacial activation of bvPLA2. This result highlights the right orientation of bvPLA2, which is essential to activate the interfacial hydrolysis.
The interfacial morphological evolution of the supported bilayer and the spatial distribution of the hydrolysis can be revealed by LSCM as shown in the schematic of Fig. 1. The head-labeled and sn-2 alkyl chain-labeled fluorescent lipids, i.e. (1,2-dioleoyl-sn-glycero-3-phosphoethanolamine-N-(lissamine rhodamine B sulfonyl)) (ammonium salt) (18![[thin space (1/6-em)]](https://www.rsc.org/images/entities/char_2009.gif) :
:![[thin space (1/6-em)]](https://www.rsc.org/images/entities/char_2009.gif) 1 Liss Rhod PE) and (1-oleoyl-2-[12-[(7-nitro-2-1,3-benzoxadiazol-4-yl) amino] dodecanoyl]-sn-glycero-3-Phosphocholine (NBD-PC)) enabled us to track the hydrolysis products of the lysolipids and fatty acids.27 Fluorescein-5-isothiocyanate (FITC)-grafted PLA2 (FITC-bvPLA2) enabled us to track the bvPLA2 molecules. Therefore, by marking all three main components, the interfacial hydrolysis process can be traced. Both the FITC-bvPLA2 and the NBD-PC emit green light; and the Liss Rhod PE emits red light under the appropriate excitation bands. To avoid the cross talk between FITC-bvPLA2 and NBD-PC, in one LSCM assay, either the bvPLA2 and lysolipids, or the fatty acids and lysolipids, were tracked.
1 Liss Rhod PE) and (1-oleoyl-2-[12-[(7-nitro-2-1,3-benzoxadiazol-4-yl) amino] dodecanoyl]-sn-glycero-3-Phosphocholine (NBD-PC)) enabled us to track the hydrolysis products of the lysolipids and fatty acids.27 Fluorescein-5-isothiocyanate (FITC)-grafted PLA2 (FITC-bvPLA2) enabled us to track the bvPLA2 molecules. Therefore, by marking all three main components, the interfacial hydrolysis process can be traced. Both the FITC-bvPLA2 and the NBD-PC emit green light; and the Liss Rhod PE emits red light under the appropriate excitation bands. To avoid the cross talk between FITC-bvPLA2 and NBD-PC, in one LSCM assay, either the bvPLA2 and lysolipids, or the fatty acids and lysolipids, were tracked.
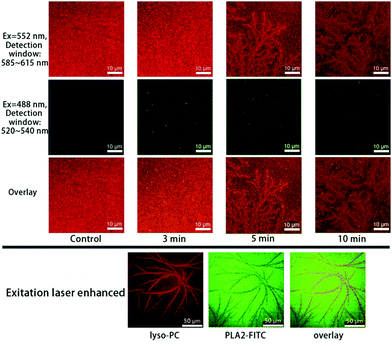
The time-sequenced experimental results in Fig. 3 show that branched microtubule structures marked with Liss Rhod PE (first row in Fig. 3, red), similar to those reported by Han et al.,11 gradually appeared; while the green fluorescence signals marked with NBD-PC as an indication of fatty acids (second row in Fig. 3, green) faded away over time. This indicates that the branched microtubule structures were mainly composed of lyso-PCs upon the bvPLA2 enzymolysis, while the other product, fatty acids, was mainly dispersed into the surrounding aqueous medium. The overlay series (third row in Fig. 3) can clearly show this lysolipid-retaining and fatty-acid-releasing process since only red light can clearly be differentiated after hydrolysis. It should be noted that the branched microtubule structures started to appear at ∼3 min and expanded to the whole surface area in less than 10 min, indicating a “minutes” time scale for this interfacial biological event under the current conditions.
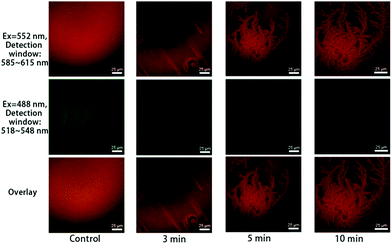 | ||
| Fig. 3 Co-localization of Liss Rhod PE (first row) and NBD-PC (second row) upon adding 5 μg mL−1 bvPLA2, with 2 mM Ca2+ in the solution. The third row shows the overlay images. | ||
A co-localization experiment was further done to track the lyso-PCs and bvPLA2 at the same time, as shown in Fig. 4. Similar branched microtubule structures were observed for the lyso-PCs (first row in Fig. 4, red). But for bvPLA2 (second row in Fig. 4, green), the uniformly excited FITC signals suggest that the bvPLA2 molecules were homogeneously adsorbed onto the bilayer surface and triggered the hydrolysis. The overlay series and the images with enhanced laser excitation intensity can semi-quantitatively disclose the interfacial distribution of the lyso-PCs and bvPLA2 (third row in Fig. 4 and the bottom images).
Although the bvPLA2 molecules were proved to be adsorbed onto the bilayer substrate surface no matter whether there was Ca2+ or not, we found that the interfacial hydrolysis cannot be activated without the help of Ca2+ under the current time scale. As shown in Fig. S2 in the ESI,† only when Ca2+ was added can the interfacial hydrolysis catalyzed by bvPLA2 be initiated, leading to the same phenomena observed as those in Fig. 3 and 4.
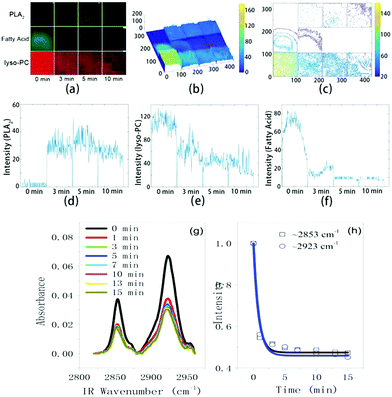
The compositional evolution at the interface can be obtained from the change in the fluorescence intensity as a function of time for each labeled molecules. As shown in Fig. 5a–f, we analyzed the time-sequenced fluorescence intensities for all three labeled molecules with Matlab. The 3D intensity distribution graphs (Fig. 5b) and the contour maps (Fig. 5c) can clearly show such intensity change over time. To be quantitative, we fixed the position of a line across the corresponding image and performed light intensity analysis for all three labeled molecules. The results are shown in Fig. 5d–f. With bvPLA2 and Ca2+ in the solution, the intensity of Liss Rhod PE (tracking lyso-PCs) decreased by 45% (from ∼110 to ∼60) in 3 min and 68% in 10 min (Fig. 5e). After that, the branched microtubule structures mainly composed of lyso-PCs were completely formed. Over the same time scale, the intensity of FITC (for bvPLA2) increased from 0 to ∼25 over the whole area (Fig. 5d) and the intensity of NBD-PC (for fatty acids) decreased nearly to zero (Fig. 5f). Again from these curves we can make a judgment that a large number of the lyso-PCs were retained at the interface and formed the branched microtubule structures while most of the fatty acids were released from the interface. And from the initial adsorption to the end of the hydrolysis, the bvPLA2 molecules were homogenously adsorbed and distributed at the interface. Such an experimental observation at least semi-quantitatively answers the following important questions: where did the hydrolysis products go and what were the microtubule structures composed of upon the bvPLA2 catalysis. Our fluorescence co-localization experiment suggests that such robust microtubule structures were not composed of bvPLA2/fatty acids but lysolipids; while during the formation of such structures, most of the fatty acids was dispersed into the surrounding aqueous solution. Besides, we also confirm the distribution of bvPLA2; the bvPLA2 turned out to be adsorbed uniformly at the interface. Such experimental observation provides an exquisite picture in the matter of the distribution of hydrolysis products at the interface.
A previous SFG study on the hydrolysis of interfacial lipids by PLA2 was focused on the CH signals, in which the hydrolysis dynamics was extracted and the hydrolysis was proved to start from the distal leaflet using the enantiomer lipid bilayer.8e Our SFG experimental observation here, together with the LSCM result, distinctly uncovers Ca2+ as a mediator to orientate the interfacial bvPLA2 and trigger the lipid substrate hydrolysis. It is worth mentioning that although people have known the effect of Ca2+ on the catalysis function of bvPLA2 for a long time, this study provides the first direct spectroscopic evidence that Ca2+ can mediate the substrate and bvPLA2, induce the orientation of bvPLA2 and then initiate the hydrolysis. Combined with the previous results,3,8 reorientation or the right orientation of the bvPLA2 molecules at the interface is very crucial, which should directly be correlated to exposure of the enzyme active sites to the interfacial lipids and then trigger the hydrolysis.
An ATR-IR experiment (Thermo Scientific Nicolet iS50) was further run to trace the lipid hydrolysis process. As shown in Fig. 5g, there were two strong bands located at ∼2853 cm−1 and ∼2923 cm−1, which are attributed to the symmetric stretching (ss) and antisymmetric stretching (as) modes of the lipid backbone methylene groups. With Ca2+ in the solution, upon adding bvPLA2, the CH vibrational signals (ss and as modes) of the interfacial lipids dropped off very quickly and levelled off at ∼5 min. If we integrated the band area and plotted it as a function of time, such data (for both ss and as modes) can be fitted using a pseudo-desorption curve (see ESI† for detail), as shown in Fig. 5h. Comparing such curves with the one in Fig. 5f, the similarity is quite remarkable. Such an observation indicates that the data in Fig. 5h mainly reflect the desorption dynamics of fatty acids from the interface upon the interfacial lipid hydrolysis. In retrospect of the study reported in this work, the results obtained from the three optical techniques show great consistency. The only remaining inconsistent fact is that the time scale for the reorientation of the bvPLA2 molecules at the interface (∼1500 s or ∼25 min in Fig. 2c and d) is different from those via LSCM (∼5 min, Fig. 5f) and ATIR-IR (∼5 min, Fig. 5h). This suggests that the reorientation of a whole layer of bvPLA2 at the interface needs longer time than the hydrolysis does. Or alternatively speaking, hydrolysis of the lipid bilayer only needs a small number of bvPLA2 molecules with the appropriate orientation at the interface. This also reflects the high catalytic activity of bvPLA2, which is consistent with a recent report where the single bvPLA2 enzyme activity can be measured.10
Conclusions
In summary, a biological event – interfacial lipid hydrolysis catalyzed by bvPLA2 was investigated in detail in this work by using SFG, LSCM and ATR-IR. Both SFG and LSCM confirm that Ca2+ was necessary to trigger this interfacial hydrolysis process. SFG highlights the right orientation of bvPLA2 toward the interfacial lipids mediated by Ca2+, which is a key step to activate the interfacial hydrolysis. The LSCM assay with the fluorescence co-localization method, combined with ATR-IR, revealed the lysolipid-retaining and fatty-acid-releasing fact, and the retained lysolipids formed the branched microtubule structures at the interface. This study provides a refreshing and comprehensible picture at the molecular and micron levels for people to understand the Ca2+-dependent interfacial lipid hydrolysis catalyzed by bvPLA2 (Fig. 1), which we believe will provoke more significant studies on a broad range of model or even live interfacial biological events by combining vibrational and fluorescence spectroscopies in the future.Conflicts of interest
The authors declare no conflict of interest.Acknowledgements
This study was supported by the State Key Development Program for Basic Research of China (2016YFA0501604), the National Natural Science Foundation of China (Grant 21574020), the Fundamental Research Funds for the Central Universities, and a project funded by the Priority Academic Program Development of Jiangsu Higher Education Institutions (PAPD).Notes and references
- M. G. Van, D. R. Voelker and G. W. Feigenson, Nat. Rev. Mol. Cell Biol., 2008, 9, 112–124 CrossRef PubMed.
- O. G. Berg, M. H. Gelb, M.-D. Tsai and M. K. Jain, Chem. Rev., 2001, 101, 2613–2653 CrossRef CAS PubMed.
- (a) O. G. Berg, B. Z. Yu, J. Rogers and M. K. Jain, Biochemistry, 1991, 30, 7283–7297 CrossRef CAS PubMed; (b) M. K. Jain, G. N. Ranadive, J. Rogers, B.-Z. Yu and O. G. Berg, Biochemistry, 1991, 30, 7306–7317 CrossRef CAS PubMed; (c) H. S. Song, M. Y. Choi, M. S. Ko, J. M. Jeong, Y. H. Kim, B. H. Jang, J. H. Sung, M. G. Kim, W. K. Whang and S. S. Sim, Arch. Pharmacal Res., 2012, 35, 905–910 CrossRef CAS PubMed; (d) J. Singh and R. Ranganathan, J. Phys. Chem. B, 2014, 118, 2077–2083 CrossRef CAS PubMed; (e) H.-K. Lin and M. H. Gelb, J. Am. Chem. Soc., 1993, 115, 3932–3942 CrossRef CAS; (f) Y.-H. Hsu, D. Bucher, J. Cao, S. Li, S.-W. Yang, G. Kokotos, V. L. Woods, J. A. McCammon and E. A. Dennis, J. Am. Chem. Soc., 2013, 135, 1330–1337 CrossRef CAS PubMed.
- P. Moraille and A. Badia, J. Am. Chem. Soc., 2005, 127, 6546–6547 CrossRef CAS PubMed.
- (a) R. I. Lehrer and X. D. Qu, Infect. Immun., 1998, 66, 2791–2797 Search PubMed; (b) C. Leidy, L. Linderoth, T. L. Andresen, O. G. Mouritsen, K. Jorgensen and G. H. Peters, Biophys. J., 2006, 90, 3165–3175 CrossRef CAS PubMed.
- (a) B. W. Dijkstra, J. Drenth and K. H. Kalk, Nature, 1981, 289, 604–606 CrossRef CAS PubMed; (b) B. W. Dijkstra, K. H. Kalk, J. Drenth, G. H. De Hass, M. R. Egmond and A. J. Slotboom, Biochemistry, 1984, 23, 2759–2766 CrossRef CAS PubMed.
- (a) Y. H. Pan, T. M. Epstein, M. K. Jain and B. J. Bahnson, Biochemistry, 2001, 40, 609–617 CrossRef CAS PubMed; (b) B. van den Berg, M. Tessari, R. Boelens, R. Dijkman, G. H. de Haas, R. Kaptein and H. M. Verheij, Nat. Struct. Biol., 1995, 2, 402–406 CrossRef CAS PubMed; (c) C. Yuan, Y. Li, I. Byeon, Y. Li and M. D. Tsai, Biochemistry, 1999, 38, 2909–2918 CrossRef CAS PubMed; (d) C. Yuan, Y. Li, I. Byeon, M. Poi and M. D. Tsai, Biochemistry, 1999, 38, 2919–2929 CrossRef CAS PubMed; (e) L. Yu and E. A. Dennis, J. Am. Chem. Soc., 1992, 114, 8757–8763 CrossRef CAS.
- (a) L. S. Jung, J. S. Shumaker-Parry, C. T. Campbell, S. S. Yee and M. H. Gelb, J. Am. Chem. Soc., 2000, 122, 4177–4184 CrossRef CAS; (b) G. M. Carman, R. A. Deems and E. A. Dennis, J. Biol. Chem., 1995, 270, 18711–18714 CrossRef CAS PubMed; (c) Y. H. Pan, T. M. Epstein, M. K. Jain and B. J. Bahnson, Biochemistry, 2001, 40, 609–617 CrossRef CAS PubMed; (d) S. A. Tatulian, Biophys. J., 2001, 80, 789–800 CrossRef CAS PubMed; (e) Y. Tong, N. Li, H. Liu, A. Ge, M. Osawa and S. Ye, Angew. Chem., Int. Ed., 2010, 49, 2319–2323 CrossRef CAS PubMed; (f) S. Suladze, S. Cinar, B. Sperlich and R. Winter, J. Am. Chem. Soc., 2015, 137, 12588–12596 CrossRef CAS PubMed.
- (a) H.-L. Wu, L. Yu, Y. Tong, A. Ge, S. Yau, M. Osawa and S. Ye, Biochim. Biophys. Acta, 2013, 1828, 642–651 CrossRef CAS PubMed; (b) H.-L. Wu, Y. Tong, Q. Peng, N. Li and S. Ye, Phys. Chem. Chem. Phys., 2016, 18, 1411–1421 RSC.
- S. R. Tabaei, M. Rabe, H. Zetterberg, V. P. Zhdanov and F. J. Höök, J. Am. Chem. Soc., 2013, 135, 14151–14158 CrossRef CAS PubMed.
- (a) C.-T. Han and L. Chao, ACS Appl. Mater. Interfaces, 2014, 6, 6378–6383 CrossRef CAS PubMed; (b) C. Y. Hong, C.-T. Han and L. Chao, Langmuir, 2016, 32, 6991–6999 CrossRef CAS PubMed.
- Y. R. Shen, The Principles of Nonlinear Optics, Wiley, New York, 1984, pp. 67–85 Search PubMed.
Footnote |
| † Electronic supplementary information (ESI) available: Supporting information related to materials, SFG/LSCM experiments, and data analysis. See DOI: 10.1039/c7cp06344j |
| This journal is © the Owner Societies 2018 |

