
 Open Access Article
 This Open Access Article is licensed under a
 Creative Commons Attribution 3.0 Unported Licence
A high-resolution natural abundance 33S MAS NMR study of the cementitious mineral ettringite
Akiko
Sasaki
a,
Luis Baquerizo
Ibarra
b and
Stephen
Wimperis
 *c
*c
aSchool of Chemistry and WestCHEM, University of Glasgow, Glasgow G12 8QQ, UK
bLafargeHolcim Research Centre, 95 Rue du Montmurier, 38070 Saint-Quentin-Fallavier, France
cDepartment of Chemistry, Faraday Building, Lancaster University, Lancaster LA1 4YB, UK. E-mail: s.wimperis@lancaster.ac.uk
First published on 22nd August 2017
Abstract
Despite the widespread occurrence of sulfur in both natural and man-made materials, the 33S nucleus has only rarely been utilised in solid-state NMR spectroscopy on account of its very low natural abundance (0.76%), low NMR frequency (ν0 = 30.7 MHz at B0 = 9.4 T), and significant nuclear quadrupole moment (spin I = 3/2, Q = −69.4 mb). Satellite-transition magic angle spinning (STMAS) is an NMR method for obtaining high-resolution spectra of half-integer quadrupolar nuclei (spin I > 1/2) in solids and is notable for its intrinsic sensitivity advantage over the similar multiple-quantum (MQMAS) method, especially for nuclei with low NMR frequencies. In this work we demonstrate the feasibility of natural abundance 33S STMAS NMR experiments at B0 = 9.4 T and 20.0 T using a model sulfate sample (Na2SO4 + K2SO4 in a 1![[thin space (1/6-em)]](https://www.rsc.org/images/entities/char_2009.gif) :1 molar ratio). Furthermore, we undertake a natural abundance 33S STMAS NMR study of the cement-forming mineral ettringite (Ca6Al2(SO4)3(OH)12·26H2O) at B0 = 9.4 T and 20.0 T, resolving a discrepancy in the literature between two previous conventional 33S MAS NMR studies and obtaining an alternative set of 33S NMR parameters that is simultaneously consistent with the MAS and STMAS data at both field strengths.
:1 molar ratio). Furthermore, we undertake a natural abundance 33S STMAS NMR study of the cement-forming mineral ettringite (Ca6Al2(SO4)3(OH)12·26H2O) at B0 = 9.4 T and 20.0 T, resolving a discrepancy in the literature between two previous conventional 33S MAS NMR studies and obtaining an alternative set of 33S NMR parameters that is simultaneously consistent with the MAS and STMAS data at both field strengths.
Introduction
Although sulfur is widespread in both nature and materials science, solid-state 33S NMR spectroscopy has been relatively little used as a technique. This is largely due to the low natural abundance of 33S nuclei (0.76%), combined with the high cost of isotopic enrichment, especially where this also involves finding new synthetic routes. In addition, with respect to its gyromagnetic ratio γ, 33S can be categorised as a low-γ nucleus (NMR frequency ν0 = 30.7 MHz at B0 = 9.4 T).1 Since the intrinsic sensitivity of NMR signals is proportional to γ5/2, this makes obtaining an acceptable signal-to-noise (S/N) ratio difficult. Furthermore, 33S is a half-integer quadrupolar nucleus (spin I = 3/2) and its NMR spectrum is subject to anisotropic broadenings arising from quadrupolar interactions, where the additional linewidth is characterised by a coupling constant, CQ = e2qQ/h, and asymmetry parameter, η = (Vxx − Vyy)/Vzz. The presence of a quadrupolar interaction thus greatly increases the S/N problems. Recently, however, high-field NMR spectrometers have been employed to advantage to overcome some of the limitations associated with low-γ quadrupolar nuclei. Not only does the intrinsic NMR sensitivity increase at higher magnetic fields but also there is a significant reduction in the linewidth arising from the second-order quadrupolar broadenings (proportional to 1/ν0). Therefore, with the increasing use of high-field (B0 > 14.1 T) solid-state NMR spectrometers, solid-state 33S NMR now shows greater potential for future applications.Solid-state 33S NMR investigations have been relatively scarce in the literature and it seems that only conventional (“one-dimensional”) spectra have been reported to date.1–26 Most of these 33S NMR studies were performed with the 33S nuclei at natural abundance, strongly reflecting the obstacles associated with 33S isotopic enrichment. The earliest solid-state 33S NMR studies date back to 1968 and the immediately ensuing investigations were performed exclusively on sulfides.2–6,8 In 1986, Eckert and Yesinowski7 reported an extensive study of “static” solid-state 33S NMR spectra recorded at B0 = 11.7 T from a total of 27 inorganic compounds including sulfides, sulfates and alums. The first 33S MAS NMR spectra were reported in 1996.10 In this study, natural abundance 33S MAS NMR spectra of sulfides, sulfates and alums were recorded at B0 = 14.1 T and this was followed by further 33S MAS NMR studies of sulfides11 and sulfates12 recorded at B0 = 17.6 T and thiosulfates at B0 = 14.1 T.13 Satellite-transition spinning sideband manifolds have been observed at B0 = 14.1 T, where the temperature dependence and a sign change in CQ were investigated in two alums,14 while extraction of unambiguous 33S chemical shift anisotropy (CSA) parameters has been achieved for two tetrathiometallates.16 These mainly medium-field 33S MAS NMR studies were focused on the investigation of simple inorganic compounds owing to the relative ease of recording NMR spectra of S sites in highly symmetric environments with small quadrupolar broadenings. For anhydrous sulfates, long T1 relaxation times have been reported as an additional limiting factor,11,12 hampering efficient signal averaging to achieve reasonable S/N ratios for spectral analysis.
During the last decade, the development of sensitivity enhancement techniques for half-integer quadrupolar nuclei and the widespread use of high-field spectrometers have been expanding the use of solid-state 33S NMR as a reliable tool for structural investigations. One of the first high-field 33S NMR studies was carried out at B0 = 19.6 T on cementitious materials containing 33S nuclei as sulfates.15 Central-transition (CT) enhancement techniques via population transfer have been successfully implemented in 33S NMR,17,19 and observation of three crystallographically distinct S sites in ettringite with CQ values of up to 1 MHz was possible at B0 = 14.1 T. The Carr–Purcell–Meiboom–Gill (CPMG) pulse sequence is known to boost the S/N ratio by accumulating signal intensity into “spikelets” and, following its success in signal enhancement of 33S-enriched disordered silicates,18 the CPMG pulse sequence has been frequently employed in high-field solid-state 33S NMR, especially where only a single S site is present.20–22,24–26 For example, acquisition using the CPMG pulse sequence at B0 = 21.1 T has enabled the observation of large CQ values (9 to 16 MHz) for a single S site at natural 33S abundance.22,24 First-principles calculations of 33S NMR parameters accompany many of the latest solid-state 33S NMR studies20,22–26 to predict and guide assignment of the experimental spectra. Prior knowledge of the magnitudes of quadrupolar broadenings, combined with acquisition at high B0 fields, has been expanding the range of materials accessible for study by experimental solid-state 33S NMR. For example, a very large CQ value of 43 MHz was predicted and experimentally observed in elemental sulfur (S8), owing to the combination of 33S isotopic enrichment, CPMG sensitivity enhancement and first-principles NMR calculations.23
In solid-state NMR spectroscopy of half-integer quadrupolar nuclei with overlapping quadrupolar-broadened lineshapes, high-resolution methods such as dynamic angle spinning (DAS),27 double rotation (DOR),28 multiple-quantum magic angle spinning (MQMAS),29 and satellite-transition magic angle spinning (STMAS)30 NMR experiments are often performed for complete spectral analysis. While the DAS and DOR methods require specialist probes, MQMAS and STMAS are performed using conventional MAS probes. Owing to its robustness and ease in implementation, MQMAS has been applied to investigations of a wide variety of materials containing half-integer quadrupolar nuclei.31 The STMAS method, on the contrary, is known to be more difficult to implement,32 owing to experimental requirements such as a stable spinning frequency, accurate setting of the spinning axis to the magic angle, and the virtual necessity of a pneumatic insert and eject system for MAS rotors. One area where MQMAS has had limited applications is in the study of low-γ quadrupolar nuclei, where the required high radiofrequency field strengths (ν1) are intrinsically difficult to achieve. The sensitivity of the MQMAS method is known to decrease considerably unless high ν1 field strengths are employed for the reconversion of multiple- to single-quantum coherences.33 Largely owing to the single-quantum nature of satellite transitions, STMAS exhibits an inherent sensitivity advantage over MQMAS and relative enhancement factors of three or more are commonly observed for NMR-sensitive nuclei such as 23Na, 87Rb (I = 3/2) and 27Al (I = 5/2).33 Previously, the suitability of the STMAS method in preference to MQMAS for the study of low-γ nuclei has been demonstrated,34 using numerical calculations and 39K (I = 3/2, ν0 = 18.7 MHz at B0 = 9.4 T, 93% natural abundance) and 25Mg (I = 5/2, ν0 = 24.5 MHz at B0 = 9.4 T, 10% natural abundance) STMAS experiments at B0 = 9.4 T. Therefore, it is tempting to investigate what can be achieved using STMAS by means of an extreme case study, such as 33S NMR at the natural 33S abundance of 0.76%.
The purpose of this paper is to demonstrate the feasibility of natural abundance 33S STMAS NMR experiments at B0 = 9.4 T and 20.0 T under favourable conditions. We discuss the technicalities with respect to successful implementation of 33S STMAS experiments at 33S natural abundance before applying the STMAS method to the NMR investigation of the cementitious mineral, ettringite. Ettringite (Ca6Al2(SO4)3(OH)12·26H2O) is a hydrous sulfate that is found naturally and also synthetically during the production of cements. Its crystal structure is known from diffraction studies,35–38 and 27Al MAS NMR studies39 have been reported previously. There have been two previous 33S solid-state NMR studies of ettringite,15,17 both at natural isotopic abundance: one at a field B0 = 19.6 T and using conventional single-pulse acquisition15 and the other at B0 = 14.1 T and employing CT enhancement techniques.17 These two studies disagree as to the number of crystallographically distinct S sites observed: the higher field study simulates a spectrum with a single S site15 while the lower field study suggests three S sites17 in accordance with the diffraction studies. Our aim is to apply the high-resolution 33S STMAS method to ettringite and resolve the ambiguity over the number of crystallographically different S sites observed by solid-state 33S NMR.
Materials and experimental methods
Na2SO4, K2SO4 and AlNH4(SO4)2·12H2O were obtained commercially as powdered solids and used as received. Ettringite was synthesised from analytical grade reagents. The main precursor in the synthesis of ettringite was tricalcium aluminate (3CaO·Al2O3), which was prepared from a 3:1 molar ratio of CaCO3 and Al2O3 at 1400 °C. Anhydrite CaSO4 was prepared by dehydration of gypsum in a muffle furnace at 550 °C overnight. Ettringite was then prepared by suspending a 1:3 molar mixture of tricalcium aluminate and anhydrite CaSO4, respectively, with a water-to-solid ratio of 20 using double-distilled CO2-free water. The mixture was stirred using a magnetic stirrer for three days and then periodically agitated over the period of a fortnight. Once purity was confirmed by X-ray diffraction, the solid was vacuum filtered under an N2 atmosphere in a glove box and subsequently aged at 25 °C for two months inside hermetic glass bottles equilibrated at 8% relative humidity using a NaOH-saturated salt solution.40
33S MAS NMR spectra were acquired at Larmor frequencies (ν0) of 30.7 and 65.2 MHz using Bruker Avance spectrometers equipped with B0 = 9.4 and 20.0 T magnets, respectively. Powdered samples were packed into either 4 mm or 7 mm MAS rotors and conventional Bruker MAS probes were employed. Spinning frequencies (νR) of 14286 and 5000–6400 Hz were used with 4 mm and 7 mm rotors, respectively. Single-pulse and rotor-synchronised spin-echo experiments were used to record one-dimensional 33S MAS spectra. The use of 1H decoupling was investigated and found to be unnecessary. The 33S chemical shift scales are given with respect to neat CS2, calibrated using AlNH4(SO4)2·12H2O as a secondary reference (δiso = 331 ppm).12 Spectral fitting and simulations of one-dimensional 33S MAS spectra were performed using Bruker TopSpin 3.2. Simulated two-dimensional 33S STMAS spectra and the corresponding isotropic projections were generated in the frequency domain using a home-written Fortran code. Further experimental and computational details are provided in the figure captions.
A powdered mixture of Na2SO4 and K2SO4 was packed into a 4 mm MAS rotor, while powdered ettringite was packed into a 7 mm rotor. The most efficient manipulation of satellite-transition (ST) coherences is achieved with high radiofrequency field strengths and, as has been shown previously, this can result in a smaller diameter rotor producing the highest STMAS sensitivity, with the beneficial effects of the higher ν1 frequency outweighing those of the reduced sample volume.34 However, after concluding our preliminary experiments with the mixture of Na2SO4 and K2SO4, we discovered that the ν1 frequencies yielded by the 4 mm and (single-channel) 7 mm MAS probes on the 20.0 T spectrometer were similar and so we used a 7 mm rotor for all the ettringite experiments at both B0 = 9.4 and 20.0 T. Obviously, whatever the rotor diameter, the use of the highest radiofrequency power available is recommended for the efficient manipulation of ST coherences, i.e., for the first two pulses in the STMAS pulse sequence. In our work, the 1 kW amplifiers produced 33S radiofrequency field strengths (ν1 = |γB1|/2π) estimated to be around 55 kHz on both the 9.4 T and 20.0 T instruments.
The phase-modulated split-t1 STMAS pulse sequence32,41 was used in all the 33S STMAS experiments in this study as it seems to be the most sensitive basic implementation of the technique.32,34 For sensitive NMR nuclei (such as 23Na, 87Rb and 27Al), it is possible to optimise the durations of each pulse experimentally and obtain the highest S/N ratio on the sample of interest. However, for low sensitivity nuclei such as 33S it is impractical to perform such pulse length optimisations unless 33S-enriched samples suitable for STMAS experiments are available (and generally these will not be, as they were not to us). Previously, numerical calculations34 have shown that, for spin I = 3/2, the optimum flip angles for the first ST excitation pulse (p1) and second ST reconversion pulse (p2) are 90° and 60°, respectively; the third pulse (p3) is a CT-selective “180°” inversion pulse, as in the second pulse of the spin-echo sequence. It should be noted that the flip angles quoted for the first two STMAS pulses are intrinsic values; e.g., the values of 2πν1τp1 and 2πν1τp2. In contrast, the third pulse is a “soft” inversion or refocusing pulse that acts only on the central transition and, for I = 3/2, has an intrinsic flip angle of 90°, with the selective nutation rate increased by a factor of I + 1/2. Our approach is then to calibrate the 33S radiofrequency field strength and then to calculate the corresponding STMAS pulse durations.34 For the calibration we employed the 33S MAS NMR signal of AlNH4(SO4)2·12H2O. The negligible value of CQ (resulting in linewidth at half height of 18 Hz) and short T1 relaxation time (0.27 s)12 of this solid makes it ideal as a setup sample for 33S MAS experiments.1 For the first two STMAS pulses, the maximum available 33S radiofrequency field strength (ν1) of 55 kHz was employed, while for the CT-selective 180° pulse, ν1(33S) = 15 kHz was appropriate. The actual pulse lengths used for p1, p2 and p3 were 4.5, 3.0 and 17.0 μs, respectively, in all our 33S STMAS experiments.
It is well known that a double-quantum filtered (DQF) version of the STMAS pulse sequence simplifies the resulting spectrum by the removal of the CT–CT autocorrelation peaks.42 However, excitation of double-quantum coherences is inefficient for spins with small CQ values32 (<1 MHz for I = 3/2 nuclei, for example), as we are expecting with 33S. Furthermore, since for I = 3/2 the optimum flip angle of 90° for the ST excitation pulse (p1) corresponds to a CT-selective “180°”, the CT–CT autocorrelation peaks are anticipated to be of low intensity even without use of a double-quantum filter. For this reason, the basic phase-modulated split-t1 STMAS experiment and not the DQF-STMAS sequence was used for the 33S NMR experiments in this work.
In STMAS, accurate setting of sample spinning axis to 54.736 ± 0.002° is a prerequisite.32 Prior to our 33S STMAS experiments, phase-modulated split-t185Rb (spin I = 5/2) DQF-STMAS experiments42 were performed on RbNO3 for accurate spinning axis calibration. There are several advantages associated with the use of 85Rb DQF-STMAS experiments performed on RbNO3: 85Rb is easily observable (72% natural abundance), the 85Rb Larmor frequency is close enough to 33S to lie within the same tuning range of an MAS probe (ν0(85Rb) = 38.6 MHz and ν0(33S) = 30.7 MHz at B0 = 9.4 T), efficient 85Rb spin–lattice relaxation (T1 ≈ 60 ms)43 saves considerable time during the stepwise adjustment of the spinning axis, the magnitude of the 85Rb quadrupolar interactions is large enough (PQ = 3.7–4.7 MHz)44 to observe the effect of angle misset easily, and the DQF version of the STMAS pulse sequence (which works well here) simplifies the resulting spectrum by the removal of CT–CT autocorrelation peaks.42 In practice, we record a one-dimensional DQF-STMAS spectrum, corresponding to a single t1 value and maximise the signal amplitude, followed by acquisition of full two-dimensional DQF-STMAS spectra to ensure the removal of any residual splitting arising from spinning angle misset. Residual splittings due to third-order quadrupolar interactions can be significant for I = 5/2 nuclei such as 85Rb (but note that they are insignificant for I = 3/2 nuclei such as 33S) and their presence should be taken into account, especially at lower B0 fields as they are proportional to 1/ν02.32,45
Once the magic angle is achieved with the RbNO3 setup sample, changing the sample, even using the Bruker pneumatic insert-eject system, has the potential to alter the spinning angle if not performed carefully. On the B0 = 9.4 T spectrometer, we used a low flow of bearing or eject gas to cushion the rotor during the insertion. However, with a 7 mm rotor on the B0 = 20.0 T magnet this still produced a change in the spinning angle, perhaps due to the greater height that the rotor has to fall in the larger magnet. Consequently, a layer of RbNO3 was added to the powdered ettringite for experiments at B0 = 20.0 T, thus avoiding the ejection and insertion procedure normally associated with the spinning axis calibration. To maximise the 33S sensitivity, powdered RbNO3 was first packed into the bottom of a 7 mm rotor (about 20% of the total volume) and the rest of the rotor was filled with the ettringite. Upon comparison of two 33S MAS spectra, one recorded with a 7 mm rotor full of ettringite and one recorded with a 7 mm rotor also containing RbNO3 at the bottom, the resulting 33S MAS spectra were confirmed to be identical except for a small difference in sensitivity proportional to the sample volume inside each rotor.
At B0 = 20.0 T, we acquired 33S spin-echo MAS spectra of ettringite with various intervals between the two pulses (3–12 ms) to determine the optimum length of the echo interval in the STMAS sequence, attempting to avoid truncation of STMAS signals while retaining sensitivity; a value of 12 ms was used in our experiments. At B0 = 9.4 T, a short echo interval (4 ms) was employed for maximum sensitivity (the optimum is possibly longer than 8 ms but the effect of signal truncation was not obvious in the resulting spectrum due to the low S/N ratio).
Results and discussion
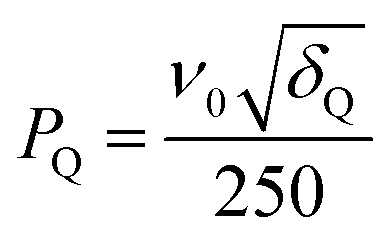
We first demonstrate the feasibility of natural abundance 33S STMAS experiments on a model system with known and undisputed NMR parameters, a 1:1 molar mixture of Na2SO4 and K2SO4, with experiments performed at B0 = 20.0 T. The 33S MAS spectrum of each sulfate has been reported previously,12,17,26 and the 33S NMR parameters from ref. 26 are summarised in Table 1. Both sulfates have similar isotropic chemical shifts (δiso shifts of 340 ppm and 336 ppm) and small quadrupolar broadenings (CQ coupling constants of 0.655 MHz and 0.988 MHz). Our simulated 33S MAS spectrum of the equimolar sulfate mixture at B0 = 20.0 T (Fig. 1a) indicates the presence of overlapping second-order broadened lineshapes and this was confirmed by the experimental 33S MAS spectrum of the sulfate mixture at B0 = 20.0 T shown in Fig. 1b. A simulated 33S STMAS spectrum of the sulfate mixture at B0 = 20.0 T using quadrupolar parameters previously reported for each sulfate is shown in Fig. 2a. The two STMAS ridges are expected to be resolved in the δ1 (isotropic) dimension and this was confirmed by our experimental natural abundance 33S STMAS spectrum of the sulfate mixture recorded at B0 = 20.0 T, shown in Fig. 2b. A total acquisition time of three days was required to obtain this spectrum, although the major limiting factor here was the long T1 relaxation times of these anhydrous sulfates (T1 = 30 s for Na2SO4 and 16 s for K2SO4).12 The poor S/N in the δ2 cross sections from Fig. 2b made any lineshape fitting unreliable but, using the δ1 and δ2 peak positions in the two-dimensional STMAS spectrum, a centre-of-mass analysis was carried out using the appropriate equations for I = 3/2 split-t1 STMAS experiments to obtain the isotropic chemical shift, δiso, and the isotropic I = 3/2 second-order quadrupolar shift, δQ = (250CQ/ν0)2(1 + η2/3):32,34| δiso = (17δ1 + 10δ2)/27 | (1a) |
| δQ = 85(δ1 − δ2)/54 | (1b) |
 | (2) |
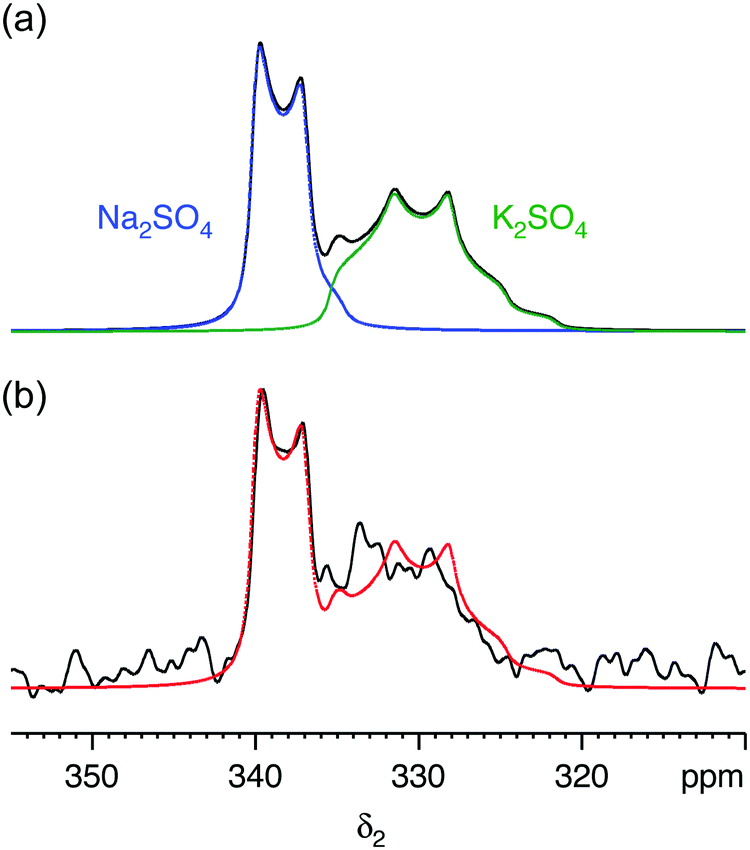 | ||
| Fig. 1 (a) Simulated and (b) experimental 33S MAS spectra of a 1:1 molar mixture of sodium sulfate (Na2SO4) and potassium sulfate (K2SO4) at B0 = 20.0 T. In (a) the 33S NMR parameters (δiso, CQ and η) were taken from ref. 26 (see Table 1). In (b) a spin-echo pulse sequence was used. The MAS frequency was 14286 Hz. A 4 mm MAS rotor was used. 4928 transients were averaged with a relaxation interval of 30 s. Total experimental time was 41 h. The complete simulated lineshape from (a) is overlaid (red) on the experimental lineshape (black). | ||
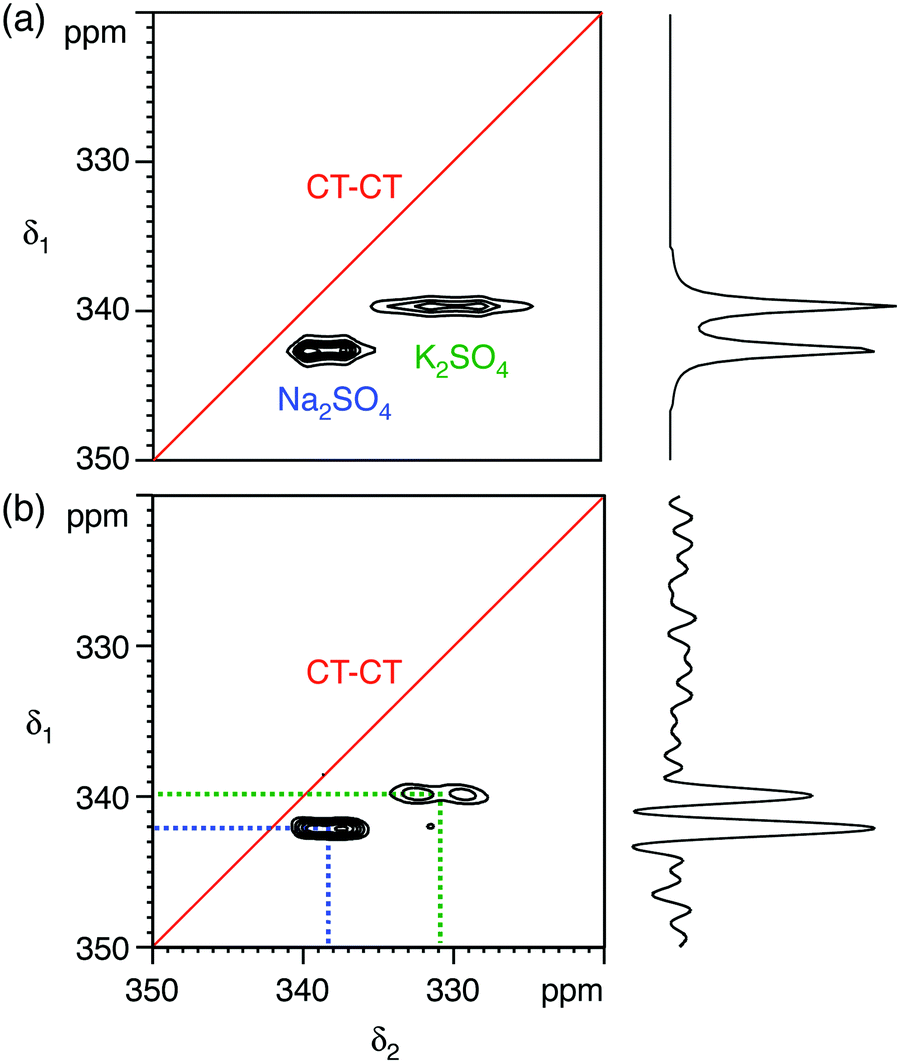 | ||
| Fig. 2 (a) Simulated and (b) experimental 33S STMAS spectra of a 1:1 molar mixture of sodium sulfate (Na2SO4) and potassium sulfate (K2SO4) at B0 = 20.0 T, with the corresponding isotropic projections. In (a) the 33S NMR parameters (δiso, CQ and η) were taken from ref. 26 (see Table 1). In (b) 192 transients were averaged for each of 67 t1 increments of 132.22 μs with a relaxation interval of 20 s. An echo interval (τ) of 12 ms was used. Total experimental time was 72 h. The MAS frequency was 14286 Hz. A 4 mm MAS rotor was used. Contour levels are drawn at 16, 32, 48, 64, 80, and 96% of the maximum value. No weighting functions were applied in (b). | ||
Following on from this successful feasibility study, our investigations of ettringite in a 7 mm MAS rotor using natural abundance 33S NMR were conducted at, initially, B0 = 20.0 T and, subsequently, B0 = 9.4 T. A set of three experiments (single-pulse, spin-echo, and STMAS) was performed each field strength. Previously, two studies reported natural abundance 33S MAS spectra of ettringite,15,17 one at B0 = 19.6 T using conventional single-pulse acquisition,15 and the other at B0 = 14.1 T employing CT enhancement techniques.17 The higher B0 field study simulates a spectrum with a single site15 while the lower B0 field study proposes three S sites17 in accordance with the diffraction studies. The chemical shift and quadrupolar parameters determined in these two studies are summarised in Table 2. Both studies employed a relaxation interval of 1 s and we have qualitatively verified this very efficient 33S spin–lattice relaxation in ettringite (the use of 0.2 s as a recycle interval gave rise to a 10% loss in sensitivity compared with the use of 0.4 s at B0 = 20.0 T). It was this efficient relaxation that encouraged us to attempt experiments at the relatively low field strength of B0 = 9.4 T.
| δ iso (ppm) | C Q (kHz) | η | δ 1 at 9.4 T (ppm) | δ 1 at 20.0 T (ppm) | |
|---|---|---|---|---|---|
| Ref. 15 | 331 | 700 | 0.45 | (339.2) | (332.8) |
| Ref. 17 | 331.1 | 516 ± 5 | 0.50 ± 0.05 | (335.6) | (332.1) |
| 329.8 | 591 ± 5 | 0.72 ± 0.05 | (336.2) | (331.2) | |
| 329.6 | 810 ± 5 | 0.97 ± 0.05 | (343.0) | (332.6) | |
| This work | 331.8 | 620 ± 20 | 0.1 ± 0.1 | 337.8 | (333.1) |
| (Fig. 3 and 4) | 332.1 | 660 ± 20 | 0.3 ± 0.1 | 339.1 | (333.7) |
| 331.0 | 800 ± 20 | 0.1 ± 0.1 | 341.0 | (333.2) | |
Fig. 3 and 4 show the natural abundance 33S single-pulse, spin-echo and STMAS spectra of ettringite in a 7 mm MAS rotor at B0 = 20.0 T and 9.4 T, respectively. It is apparent from the B0 = 20.0 T STMAS spectrum in Fig. 3d, which took 92 h to record, that, although there is some evidence of the presence of more than one two-dimensional lineshape, multiple S sites are not fully resolved. Recognising that this was likely to be the result of small second-order quadrupolar shifts at B0 = 20.0 T, we were encouraged to record the B0 = 9.4 T 33S STMAS spectrum of ettringite shown in Fig. 4d, which took 262 h to complete. Although the S/N ratio is poor and there are strong truncation artefacts at δ1 ≈ 0, the δ1 projection of the spectrum appears to show isotropically resolved S sites.
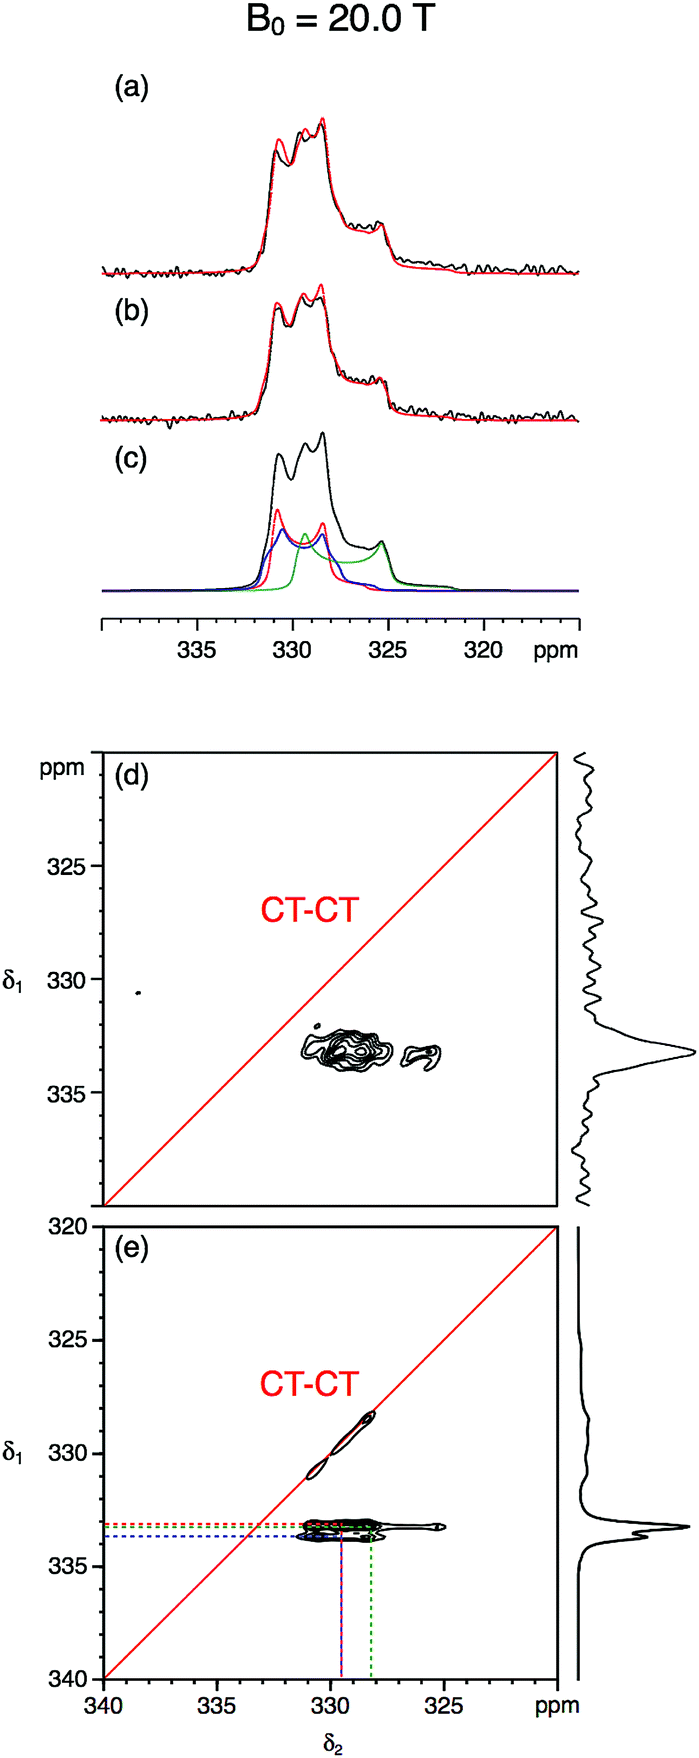 | ||
| Fig. 3 (a–c) Experimental and simulated 33S MAS and (d and e) experimental and simulated STMAS spectra of ettringite with corresponding isotropic projections at B0 = 20.0 T. In (a) a single pulse and (b) a spin-echo pulse sequence was used. In both (a) and (b) 92160 transients were averaged with a relaxation interval of 0.6 s. Total experimental time was 16 h in each case. The MAS frequency was 6.4 kHz. A 7 mm MAS rotor filled only with ettringite was used. No weighting functions were applied. (c and e) Simulated 33S MAS and STMAS spectra using the NMR parameters (δiso, CQ and η) determined in this work and given in Table 2. In (d) 11040 transients were averaged for each of 64 t1 increments of 377.78 μs with a relaxation interval of 0.45 s. An echo interval (τ) of 6 ms was used. Total experimental time was 92 h. The MAS frequency was 5 kHz. A 7 mm MAS rotor containing both RbNO3 and ettringite was used. Contour levels are drawn at 32, 44, 56, 68, 80, and 92% of the maximum value. No weighting functions were applied. | ||
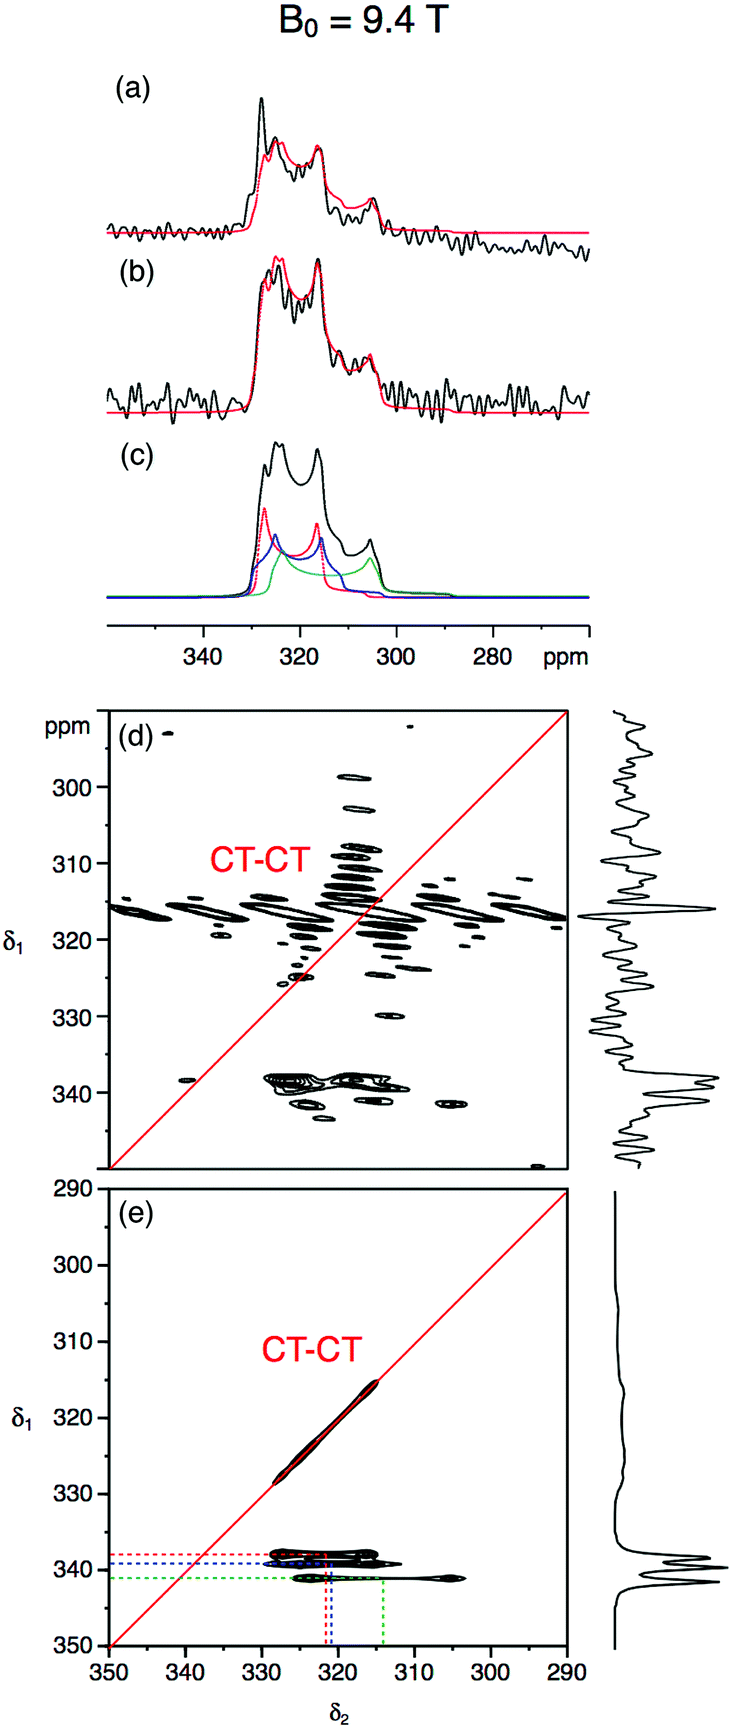 | ||
| Fig. 4 (a–c) Experimental and simulated 33S MAS and (d and e) experimental and simulated STMAS spectra of ettringite with corresponding isotropic projections at B0 = 9.4 T. In (a) a single pulse and (b) a spin-echo pulse sequence was used. In both (a) and (b), 524288 transients were averaged with a relaxation interval of 0.25 s. Total experimental time was 44 h in each case. The MAS frequency was 6.4 kHz. A 7 mm MAS rotor filled only with ettringite was used. No weighting functions were applied. (c and e) Simulated 33S MAS and STMAS spectra using the NMR parameters (δiso, CQ and η) determined in this work and given in Table 2. In (d) 40960 transients were averaged for each of 85 t1 increments of 295.14 μs with a relaxation interval of 0.25 s. An echo interval (τ) of 4 ms was used. Total experimental time was 262 h. The MAS frequency was 6.4 kHz. A 7 mm MAS rotor filled only with ettringite was used. Contour levels are drawn at 32, 44, 56, 68, 80, and 92% of the maximum value. No weighting functions were applied. | ||
Centre-of-mass analyses were performed on the two-dimensional STMAS spectra using the appropriate equations for I = 3/2 split-t1 experiments34 (eqn (1)–(2)). These provided initial estimates for the chemical shift and quadrupolar parameters for ettringite that were then used in an iterative fitting of the one-dimensional MAS spectra at the two field strengths. Further refinement of the NMR parameters was then achieved by comparing the simulated δ1 projections of the STMAS spectra at the two field strengths with the experimental projections. In this way we obtained a consistent set of chemical shift and quadrupolar parameters at B0 = 20.0 T and 9.4 T for the three crystallographically distinct S sites in ettringite, as summarised in Table 2.
Fig. 5 compares the simulated δ1 projections at B0 = 20.0 T and 9.4 T using the parameters obtained in this work with those using the parameters from ref. 17 and with the experimental 33S STMAS δ1 projections. It is apparent that the 33S NMR parameters from ref. 17 do not reproduce the experimental STMAS δ1 projections obtained in this work. With respect to this, we note that the spectra in ref. 17 were recorded with the assistance of a CT enhancement method, which may have distorted the 33S MAS lineshapes, and were subjected to significant line broadening (up to 50 Hz)17 during processing.
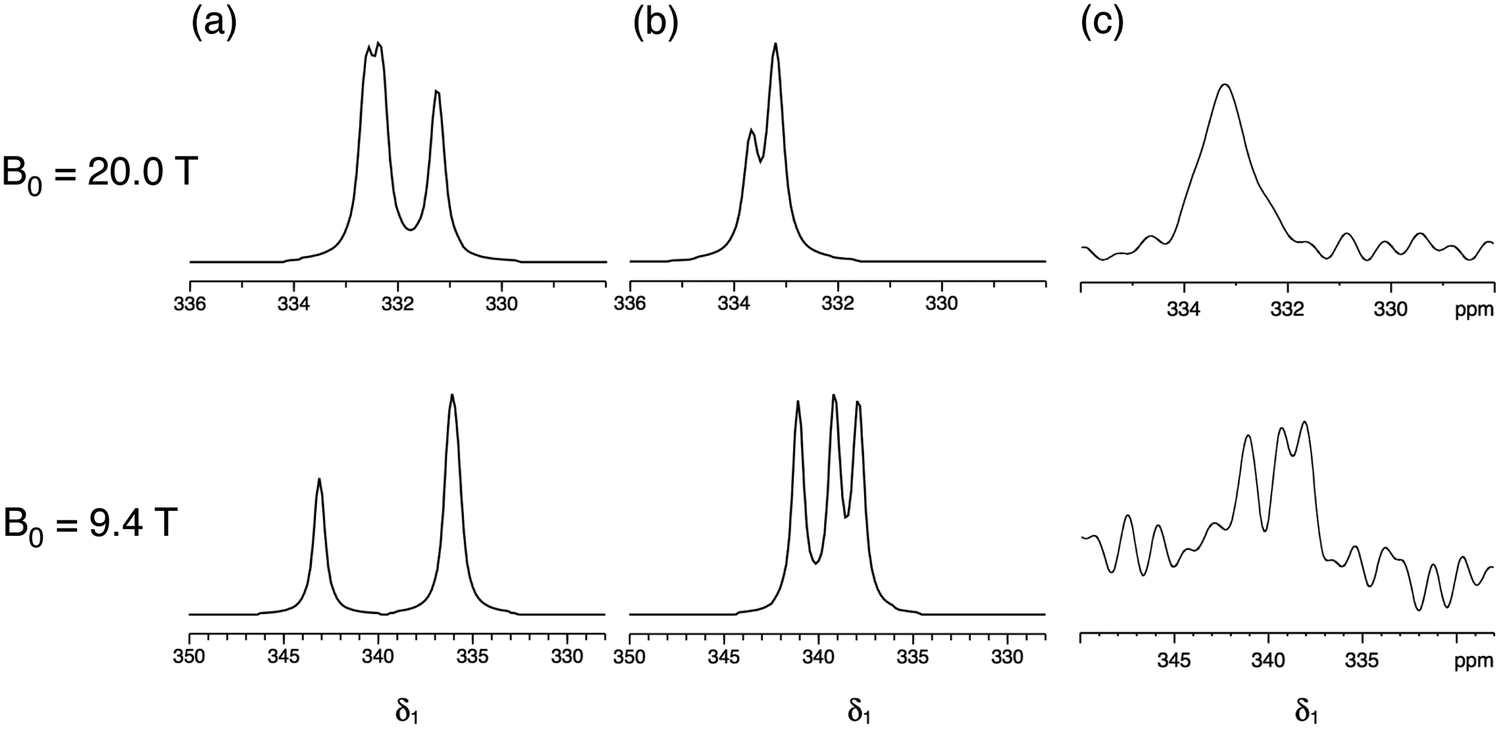 | ||
| Fig. 5 (a and b) Simulated and (c) experimental isotropic projections of two-dimensional 33S STMAS spectra of ettringite at B0 = 20.0 T and 9.4 T. 33S NMR parameters (δiso, CQ and η) were taken from (a) ref. 17 and (b) this work, as summarised in Table 2. | ||
Conclusions
We have demonstrated the feasibility of high-resolution 33S STMAS NMR experiments at B0 = 9.4 and 20.0 T and at the natural abundance of 33S (0.76%). We judge that, at 33S natural abundance in the presence of multiple S sites, 33S STMAS is feasible at B0 = 20.0 T for quadrupolar coupling constants up to 1 MHz in magnitude. If the 33S spin–lattice relaxation times are particularly short, as in the case of ettringite, then our results indicate that 33S STMAS becomes possible at lower field strengths, such as the B0 = 9.4 T used here. Total acquisition times can be very long, a week or more, and we were fortunate that our B0 = 9.4 T magnet was particularly stable. Using 33S STMAS at 33S natural abundance, we have resolved the disagreement in the 33S NMR literature as to the number of distinct S sites in the mineral ettringite in favour of ref. 17: we also find 3 distinct S sites, in further agreement with diffraction studies. We have obtained a set of 33S NMR parameters (δiso, CQ and η) for ettringite that are in consistent agreement with 33S MAS and STMAS spectra recorded at field strengths of B0 = 9.4 and 20.0 T. The importance of working at more than one magnetic field strength cannot be overstated in a challenging study such as that presented here. Finally, we note that the highly dynamic nature of the ettringite structure, as evidenced by the unusually short 33S T1 relaxation times, is expected to complicate attempts to calculate the 33S NMR parameters using first-principles methods such as WIEN2k or CASTEP, as we have confirmed in preliminary DFT studies.Conflicts of interest
There are no conflicts to declare.Acknowledgements
The authors are grateful to Bruker UK Ltd and the University of Glasgow for the award of a PhD studentship (AS). The UK 850 MHz Solid-State NMR Facility used in this research was funded by EPSRC and BBSRC (contract reference PR140003), as well as the University of Warwick including via part funding through Birmingham Science City Advanced Materials Projects 1 and 2 supported by Advantage West Midlands (AWM) and the European Regional Development Fund (ERDF). We are very grateful to Dr Dinu Iuga for collaborative assistance at the 850 MHz Facility and to Dr Tom Ball for preliminary 33S STMAS NMR work at B0 = 9.4 T.References
- M. E. Smith, Recent Progress in Solid-State NMR of Low-γ Nuclei, Annu. Rep. NMR Spectrosc., 2001, 43, 121–175 CrossRef CAS.
- C. Karr and H. D. Schultz, Wide-Line Nuclear Magnetic Resonance Spectroscopy of Sulfur-33 in Minerals, Spectrosc. Lett., 1968, 1, 205–210 CrossRef CAS.
- K. Lee, 33S Nuclear Magnetic Resonance in Paramagnetic α-MnS, Phys. Rev., 1968, 172, 284–287 CrossRef CAS.
- H. Suzuki, T. Komaru, T. Hihara and Y. Koi, Nuclear Magnetic Resonances of 33S and 77Se in EuS and EuSe, J. Phys. Soc. Jpn., 1971, 30, 288 CrossRef CAS.
- H. L. Retcofsky and R. A. Friedel, Sulfur-33 Magnetic Resonance Spectra of Selected Compounds, J. Am. Chem. Soc., 1972, 94, 6579–6584 CrossRef CAS.
- M. Haller, W. E. Hertler, O. Lutz and A. Nolle, 67Zn and 33S Nuclear Shielding in Zinc Chalcogenides, Solid State Commun., 1980, 33, 1051–1053 CrossRef CAS.
- H. Eckert and J. P. Yesinowski, Sulfur-33 NMR at Natural Abundance in Solids, J. Am. Chem. Soc., 1986, 108, 2140–2146 CrossRef CAS PubMed.
- T. J. Bastow and S. N. Stuart, NMR Study of the Zinc Chalcogenides, Phys. Status Solidi B, 1988, 145, 719–728 CrossRef CAS.
- M. J. Collins, C. I. Ratcliffe and J. A. Ripmeester, 2H and 33S NMR Line-Shape Studies of the Molecular Motion in the Lipid and Solid Phases of Hydrogen Sulfide and the Solid II of Hydrogen Selenide, J. Phys. Chem., 1989, 93, 7495–7502 CrossRef CAS.
- W. A. Daunch and P. L. Rinaldi, Natural-Abundance Solid-State 33S NMR with High-Speed Magic-Angle Spinning, J. Magn. Reson., Ser. A, 1996, 123, 219–221 CrossRef CAS.
- T. A. Wagler, W. A. Daunch, P. L. Rinaldi and A. R. Palmer, Solid State 33S NMR of Inorganic Sulfides, J. Magn. Reson., 2003, 161, 191–197 CrossRef CAS PubMed.
- T. A. Wagler, W. A. Daunch, M. Panzner, W. J. Youngs and P. L. Rinaldi, Solid-State 33S MAS NMR of Inorganic Sulfates, J. Magn. Reson., 2004, 170, 336–344 CrossRef CAS PubMed.
- S. Couch, A. P. Howes, S. C. Kohn and M. E. Smith, 33S Solid State NMR of Sulphur Speciation in Silicate Glasses, Solid State Nucl. Magn. Reson., 2004, 26, 203–208 CrossRef CAS PubMed.
- H. J. Jakobsen, A. R. Hove, H. Bildsøe and J. Skibsted, Satellite Transitions in Natural Abundance Solid-State 33S MAS NMR of Alums – Sign Change with Zero-Crossing of CQ in a Variable Temperature Study, J. Magn. Reson., 2006, 180, 170–177 CrossRef CAS PubMed.
- J.-B. d’Espinose de Lacaillerie, F. Barberon, B. Bresson, P. Fonollosa, H. Zanni, V. E. Fedorov, N. G. Naumov and Z. Gan, Applicability of Natural Abundance 33S Solid-State NMR to Cement Chemistry, Cem. Concr. Res., 2006, 36, 1781–1783 CrossRef.
- H. J. Jakobsen, A. R. Hove, H. Bildsøe, J. Skibsted and M. Brorson, Advancements in Natural Abundance Solid-State 33S MAS NMR: Characterization of Transition-Metal M
![[double bond, length as m-dash]](https://www.rsc.org/images/entities/char_e001.gif) S Bonds in Ammonium Tetrathiometallates, Chem. Commun., 2007, 1629–1631 RSC.
S Bonds in Ammonium Tetrathiometallates, Chem. Commun., 2007, 1629–1631 RSC. - M. R. Hansen, M. Brorson, H. Bildsøe, J. Skibsted and H. J. Jakobsen, Sensitivity Enhancement in Natural-Abundance Solid-State 33S MAS NMR Spectroscopy Employing Adiabatic Inversion Pulses to the Satellite Transitions, J. Magn. Reson., 2008, 190, 316–326 CrossRef CAS PubMed.
- L. A. O’Dell, K. Klimm, J. C. C. Freitas, S. C. Kohn and M. E. Smith, 33S MAS NMR of a Disordered Sulfur-Doped Silicate: Signal Enhancement via RAPT, QCPMG and Adiabatic Pulses, Appl. Magn. Reson., 2008, 35, 247–259 CrossRef.
- H. J. Jakobsen, H. Bildsøe, J. Skibsted, M. Brorson, B. R. Srinivasan, C. Näther and W. Bensch, New Opportunities in Acquisition and Analysis of Natural Abundance Complex Solid-State 33S MAS NMR Spectra: (CH3NH3)2WS4, Phys. Chem. Chem. Phys., 2009, 11, 6981–6986 RSC.
- A. Sutrisno, V. V. Terskikh and Y. Huang, A Natural Abundance 33S Solid-State NMR Study of Layered Transition Metal Disulfides at Ultrahigh Magnetic Field, Chem. Commun., 2009, 186–188 RSC.
- H. J. Jakobsen, H. Bildsøe, J. Skibsted, M. Brorson, P. Gor’kov and Z. Gan, A Strategy for Acquisition and Analysis of Complex Natural Abundance 33S Solid-State NMR Spectra of a Disordered Tetrathio Transition-Metal Anion, J. Magn. Reson., 2010, 202, 173–179 CrossRef CAS PubMed.
- I. Moudrakovski, S. Lang, S. Patchkovskii and J. Ripmeester, High Field 33S Solid State NMR and First-Principles Calculations in Potassium Sulfates, J. Phys. Chem. A, 2010, 114, 309–316 CrossRef CAS PubMed.
- L. A. O’Dell and I. L. Moudrakovski, Testing the Sensitivity Limits of 33S NMR: An Ultra-Wideline Study of Elemental Sulfur, J. Magn. Reson., 2010, 207, 345–347 CrossRef PubMed.
- P. J. Pallister, I. L. Moudrakovski and J. A. Ripmeester, High-Field Multinuclear Solid-State Nuclear Magnetic Resonance (NMR) and First Principle Calculations in MgSO4 Polymorphs, Can. J. Chem., 2011, 89, 1076–1086 CrossRef CAS.
- L. A. O’Dell and C. I. Ratcliffe, Crystal Structure Based Design of Signal Enhancement Schemes for Solid-State NMR of Insensitive Half-Integer Quadrupolar Nuclei, J. Phys. Chem. A, 2011, 115, 747–752 CrossRef PubMed.
- P. J. Pallister, I. L. Moudrakovski, G. D. Enright and J. A. Ripmeester, Structural Assessment of Anhydrous Sulfates with High Field 33S Solid State NMR and First Principles Calculations, CrystEngComm, 2013, 15, 8808–8822 RSC.
- A. Llor and J. Virlet, Towards High-Resolution NMR of More Nuclei in Solids: Sample Spinning with Time-Dependent Spinner Axis Angle, Chem. Phys. Lett., 1988, 152, 248–253 CrossRef CAS.
- A. Samoson, E. Lippmaa and A. Pines, High Resolution Solid-State N.M.R, Mol. Phys., 1988, 65, 1013–1018 CrossRef CAS.
- L. Frydman and J. S. Harwood, Isotropic Spectra of Half-Integer Quadrupolar Spins from Bidimensional Magic-Angle Spinning NMR, J. Am. Chem. Soc., 1995, 117, 5367–5368 CrossRef CAS.
- Z. Gan, Isotropic NMR Spectra of Half-Integer Quadrupolar Nuclei Using Satellite Transitions and Magic-Angle Spinning, J. Am. Chem. Soc., 2000, 122, 3242–3243 CrossRef CAS.
- NMR of Quadrupolar Nuclei in Solid Materials, ed. R. E. Wasylishen, S. E. Ashbrook and S. Wimperis, John Wiley & Sons, Ltd, Chichester, 2012 Search PubMed.
- S. E. Ashbrook and S. Wimperis, High-Resolution NMR of Quadrupolar Nuclei in Solids: The Satellite-Transition Magic Angle Spinning (STMAS) Experiment, Prog. Nucl. Magn. Reson. Spectrosc., 2004, 45, 53–108 CrossRef CAS.
- J. Amoureux, C. Fernandez and L. Frydman, Optimized Multiple-Quantum Magic-Angle Spinning NMR Experiments on Half-Integer Quadrupoles, Chem. Phys. Lett., 1996, 259, 347–355 CrossRef CAS.
- N. G. Dowell, S. E. Ashbrook and S. Wimperis, Satellite-Transition MAS NMR of Low-γ Nuclei at Natural Abundance: Sensitivity, Practical Implementation, and Application to 39K (I = 3/2) and 25Mg (I = 5/2), J. Phys. Chem. B, 2004, 108, 13292–13299 CrossRef CAS.
- A. Moore and H. F. W. Taylor, Crystal Structure of Ettringite, Nature, 1968, 218, 1048–1049 CrossRef CAS.
- A. E. Moore and H. F. W. Taylor, Crystal Structure of Ettringite, Acta Crystallogr., 1970, B26, 386–393 CrossRef.
- F. Goetz-Neunhoeffer and J. Neubauer, Refined Ettringite (Ca6Al2(SO4)3(OH)12·26H2O) Structure for Quantitative X-Ray Diffraction Analysis, Powder Diffr., 2006, 21, 4–11 CrossRef CAS.
- M. R. Hartman and R. Berliner, Investigation of the Structure of Ettringite by Time-of-Flight Neutron Powder Diffraction Techniques, Cem. Concr. Res., 2006, 36, 364–370 CrossRef CAS.
- J. Skibsted, E. Henderson and H. J. Jakobsen, Characterization of Calcium Aluminate Phases in Cements by 27Al MAS NMR Spectroscopy, Inorg. Chem., 1993, 32, 1013–1027 CrossRef CAS.
- L. Greenspan, Humidity Fixed Points of Binary Saturated Aqueous Solutions, J. Res. Natl. Bur. Stand., Sect. A, 1977, 81, 89–96 CrossRef.
- K. J. Pike, S. E. Ashbrook and S. Wimperis., Two-Dimensional Satellite-Transition MAS NMR of Quadrupolar Nuclei: Shifted Echoes, High-Spin Nuclei and Resolution, Chem. Phys. Lett., 2001, 345, 400–408 CrossRef CAS.
- H.-T. Kwak and Z. Gan, Double-Quantum Filtered STMAS, J. Magn. Reson., 2003, 164, 369–372 CrossRef CAS PubMed.
- J. T. Cheng, J. C. Edwards and P. D. Ellis, Measurement of Quadrupolar Coupling Constants, Shielding Tensor Elements, and the Relative Orientation of Quadrupolar and Shielding Tensor Principal Axis Systems for Rubidium-87 and Rubidium-85 Nuclei in Rubidium Salts by Solid-State Nuclear Magnetic Resonance, J. Phys. Chem., 1990, 94, 553–561 CrossRef CAS.
- I. Hung, A. Wong, A. P. Howes, T. Anupõld, A. Samoson, M. E. Smith, D. Holland, S. P. Brown and R. Dupree, Separation of Isotropic Chemical and Second-Order Quadrupolar Shifts by Multiple-Quantum Double Rotation NMR, J. Magn. Reson., 2009, 197, 229–236 CrossRef CAS PubMed.
- Z. Gan, P. Srinivasan, J. R. Quine, S. Steuernagel and B. Knott, Third-Order Effect in Solid-State NMR of Quadrupolar Nuclei, Chem. Phys. Lett., 2003, 367, 163–169 CrossRef CAS.
| This journal is © the Owner Societies 2017 |