
 Open Access Article
 This Open Access Article is licensed under a
 Creative Commons Attribution 3.0 Unported Licence
Properties of kinetic transition networks for atomic clusters and glassy solids
John W. R.
Morgan
 a,
Dhagash
Mehta
b and
David J.
Wales
*c
a,
Dhagash
Mehta
b and
David J.
Wales
*c
aDepartment of Chemical Engineering, University of Michigan, Ann Arbor, MI 48109-2136, USA. E-mail: jwrm@umich.edu
bDepartment of Applied and Computational Mathematics and Statistics, University of Notre Dame, Notre Dame, IN 46556, USA. E-mail: dmehta@nd.edu
cUniversity Chemical Laboratories, Lensfield Road, Cambridge CB2 1EW, UK. E-mail: dw34@cam.ac.uk
First published on 7th September 2017
Abstract
A database of minima and transition states corresponds to a network where the minima represent nodes and the transition states correspond to edges between the pairs of minima they connect via steepest-descent paths. Here we construct networks for small clusters bound by the Morse potential for a selection of physically relevant parameters, in two and three dimensions. The properties of these unweighted and undirected networks are analysed to examine two features: whether they are small-world, where the shortest path between nodes involves only a small number or edges; and whether they are scale-free, having a degree distribution that follows a power law. Small-world character is present, but statistical tests show that a power law is not a good fit, so the networks are not scale-free. These results for clusters are compared with the corresponding properties for the molecular and atomic structural glass formers ortho-terphenyl and binary Lennard-Jones. These glassy systems do not show small-world properties, suggesting that such behaviour is linked to the structure-seeking landscapes of the Morse clusters.
1 Introduction
The potential energy surface (PES)1 of an atomic cluster corresponds to the energy as a function of the coordinates specifying the configuration. The most interesting points on the surface are usually the local minima and transition states, which are stationary points where the gradient of the potential is zero. For local minima, the potential energy rises for any infinitesimal displacement of internal coordinates, while for transition states there is a unique negative Hessian (second derivative matrix) eigenvalue.2 Treating the PES as a network can provide insight into the overall structure of the energy landscape. Here the network in question is formed by considering minima as the nodes and transition states as edges between the minima they connect via steepest-descent paths.3,4 Two key questions are then whether the network is small-world and scale-free.The degree of a node is the number of edges connected to it. The degree distribution is then defined as the number of nodes with given degrees.5 A path is a sequence of nodes connected by edges, with the length of the path being the number of edges it contains. The shortest path length gives the minimum number of edges between a pair of nodes, and the average shortest path length is the shortest path length averaged over all pairs of nodes. The clustering coefficient is the ratio of the number of connections between neighbours of a node to the number of such connections that could exist.6
Two useful references are provided by models based on a lattice graph and a random graph. Random graphs have a small clustering coefficient and a slowly growing average shortest path length.5,7 In contrast, lattice graphs, which are composed of a regular array of nodes with edges only between nearest-neighbours in space, have a comparatively large average shortest path length and a larger clustering coefficient.6 Small-world networks were introduced by Watts and Strogatz6 and defined as networks that show a high degree of local clustering behaviour, similar to a lattice graph, but also a short path length, even between distant nodes, as exhibited by random graphs. The name comes from experiments performed by Milgram with letter passing, which demonstrated that most citizens of the USA are separated from each other by a surprisingly small number of social contacts.8 This result is now known in terms of “six degrees of separation” from the estimated average path length.9 Watts and Strogatz showed that networks from a wide variety of areas show small-world behaviour, including the neural network of C. elegans, the power grid of the Western USA, and the collaborations of film actors (linked to the concept of the Bacon number).10
A scale-free network has a degree distribution with a power law tail, as defined by Barabási and Albert.11,12 This distribution implies there are a small number of nodes with a very high degree, called hubs, and more nodes with a smaller degree, acting as local hubs, down to nodes with only a few connections, in a hierarchical fashion. Power laws were fitted for a variety of available networks, including the World Wide Web and the film actor collaboration graph, and a preferential attachment model was suggested to explain how the behaviour arises. Following this work, power laws were fitted to many other networks, such as the interactions between solar magnetic loops leading to a solar flare,13 and aftershocks of earthquakes.14 However, few of these studies used robust statistical methods to determine whether or not a power law was a good fit to the data, and many of the results have been called into question by Clauset et al.15
Doye and Massen16,17 studied Lennard-Jones (LJ) clusters and concluded that the networks were both small-world and scale-free. Small-world behaviour is believed to have implications for self-assembly, as it suggests that the global minimum can be reached from anywhere on the PES by a relatively short transition pathway. One would therefore expect that systems with a funnel-like PES, characteristic of structure-seekers, may display small-world behaviour.18 Scale-free behaviour was more surprising, as there is no obvious analogy to the addition of new nodes in the preferential attachment model, the most straightforward route to a power law distribution. However, noticing a correlation between minima with a high degree and a low potential energy, it was suggested that due to the larger basins of attraction for low energy minima, any other minimum was more likely to be connected to a low energy minimum than a high energy one, thus establishing an analogy to preferential attachment. This possibility was further investigated using Apollonian packings,19 concluding that the contacts between discs in the 2D Apollonian packing form a scale-free network with a spatial distribution that may resemble the catchment basins of a PES.
Other energy landscapes have been studied with a view to analysing the same properties. Protein folding networks have been considered by Rao and Caflisch.20 They used molecular dynamics to generate snapshots of the structure and then derived a conformation based on the secondary structure each residue belonged to. These snapshots do not precisely correspond to minima on the PES, so the formation of the network is not equivalent to the LJ results considered above, but the idea is similar. A power law was fitted to the degree distribution with the conclusion was that the network was scale-free, drawing attention to the hubs present in the network.
Bowman and Pande studied a Markov state model for another protein folding landscape.21 They noted that native states were hubs and suggested that this was characteristic of a scale-free network, but without consideration of the degree distribution. Similarly, Chakraborty et al. considered an RNA folding network, noting that it may be scale-free due to the presence of hubs, but without providing the degree distribution.22 It is, however, possible to construct networks with hubs that are not scale-free, the simplest example being the star network,5 in which there is one central node to which all others are attached and there no other edges. Therefore, although scale-free networks do contain hubs, the presence of hubs is not in itself enough evidence to conclude that a network is scale-free. Recently, Mehta et al.23 constructed stationary point databases for the Thomson problem24 up to 150 particles. They demonstrated that the networks show small-world behaviour, and that the presence of hubs suggested the possibility of the networks being scale-free, but acknowledged that further statistical testing was required. Recently, an analysis of networks of minima for machine learning problems has also been initiated.25
Potential energy surfaces for glassy systems have a large number of competing low-lying amorphous minima with similar energies, separated by high barriers.1 Here we consider two examples: bulk ortho-terphenyl (OTP), which is often represented by a course-grained model consisting of a LJ site at the centre of each benzene ring;26 and bulk binary Lennard-Jones (BLJ), in which there are two different types of particles, interacting via LJ potentials with different parameters.27,28 If the small-world behaviour observed for atomic clusters is the result of a funnelled landscape, then we anticipate that glassy systems will be different.
The Morse potential29 is a widely used pairwise representation for modelling atomic clusters.30–37 The functional form is
| VM(R) = εeρ(1−R/Re)(eρ(1−R/Re) − 2), | (1) |
The Morse potential is pairwise additive so the total energy of the system is a sum over the interaction between all pairs of particles. This approximation neglects many-body interactions, which can be important in some systems, especially when the particle interaction range is large.44 The pair approximation has been successfully used to predict experimental properties, in colloids for example, when the range is small.39
In the present work we explore the PES for small atomic clusters bound by the Morse potential with a range of values for ρ, namely 3, 6, 10, 14 and 30. Our databases are almost complete, meaning that they were expanded until no new minima were found, but the search methods used do not rigorously guarantee that all the minima have been located. Disconnectivity graphs are used to visualise the potential energy landscape.45,46 Previously, global minima and some low-lying minima have been described,31–37,42,47 but attempts to generate relatively complete databases have been made only for a few specific cases.30,43
2 Methods
2.1 Generating databases
Clusters in two and three dimensions bound by the Morse potential were analysed. For each number of particles N and range ρ a database of potential energy minima and the transition states connecting them was generated. First, the global minimum and other low-lying minima were located by basin-hopping global optimisation1,48–52 as implemented in GMIN.53 104 basin-hopping steps were run from each of three random starting configurations. The twenty lowest minima from each run, or all minima if there were fewer than twenty, were then connected via transition states located using the doubly-nudged54–56 elastic band57–61 and eigenvector-following62 algorithms in OPTIM.63 These minima and transition states were imported into PATHSAMPLE,64 at which point duplicate minima and transition states were removed. Additional single-ended transition state searches62,65,66 and searches using the UNTRAP67 procedure were performed to expand the database. After no more transition states were located, a further 50 single-ended searches were performed for each minimum. At this point we can be reasonably confident that practically all the minima and transition states have been found.For each database, a network was constructed by considering the minima as nodes with edges between any two minima directly connected by a transition state. The barrier height for the transition state was ignored and the path through the transition state can be followed in either direction, so the network was treated as undirected and unweighted. The network was analysed using the Python NetworkX package.68 A further check on the completeness of the database was to ensure that all minima were connected to each other by one or more transition states, i.e. that the network was connected. Finally, transition states connecting the same pair of minima as an earlier pathway were removed, to leave at most one transition state connecting any pair. Transition states that connected permutation-inversion isomers of the same minimum, which correspond to degenerate rearrangements,69 were also removed.
We chose to study clusters with ρ = 3, 6, 10, 14 and 30, in both two and three dimensions. These range parameters correspond to previous values used for the Morse potential and give a good spread of physically relevant pair potentials. The number of particles was chosen to produce databases with between several hundred and a few thousand minima. Selecting these sizes meant we could be confident of generating essentially complete databases in a reasonable time, improving the reliability of statistical tests. The symbol MxDN is used to refer to a Morse cluster in x dimensions with N particles.
2.2 Degree distribution
A node s has degree ks, defined as the number of edges connected to s. The degree distribution pk is the number of nodes with degree k, or after normalisation the fraction of nodes with degree k, or the probability of a selected node having degree k.5We are interested in whether the degree distribution follows a power law,11 such that
| pk = Ck−α, |
ln![[thin space (1/6-em)]](https://www.rsc.org/images/entities/char_2009.gif) pk = lnC − αlnk, pk = lnC − αlnk, | (2) |
 | (3) |
Typically, a power law is only obeyed in the tail of the distribution, so a cutoff kmin above which the power law applies needs to be determined. Clauset et al. also have a method for determining the best value of kmin.71 A fit is calculated for all possible values of kmin and the value which gives the smallest Kolmogorov–Smirnov (KS) statistic72 is chosen.
A goodness-of-fit test is used to check whether the proposed power law is a plausible fit for the measured data.15 Data sets are generated from the power law and compared to the measured data. The p value is the fraction of generated data sets that are a worse fit than the measured data. The fit is rejected if the p value is less than 0.05. If p > 0.05, it does not necessarily indicate that the power law is a good fit, merely that we do not have sufficient evidence to reject it.
Other distributions must be considered that could be a better fit to the data, such as the log-normal distribution. If we cannot say that a power law is a better fit than the log-normal, we should not conclude that the data follows a power law.15 A likelihood ratio test is used to compare the fit of two distributions, indicating which distribution is more likely, and a p value is used to judge whether the result is significant.73 A small p value (<0.05) means there is sufficient evidence to accept the result of the tests.
2.3 Clustering
Clustering in a network is the degree to which the neighbours of a node are also neighbours of each other. A local clustering coefficient can be defined for an individual node s as:6 | (4) |
The local clustering coefficient can be extended to a global clustering coefficient for the network in two ways. The average clustering coefficient is the mean of the local clustering coefficients:6
 | (5) |
 | (6) |
 . The algorithmic complexity depends on the degree distribution, but in the worst case is O(n2).
These two measures differ in the weighting they give to nodes of small degree. Such nodes have a small number of possible neighbour pairs, so they have a small denominator in their local clustering coefficient. They therefore dominate the sum in eqn (5). In networks with a large number of small degree nodes, the average clustering coefficient does not depend much on the larger degree nodes. In PES networks, the large degree nodes tend to be those with a low potential energy, which are considered more important for the properties of the network. We therefore prefer the transitivity to the average clustering coefficient.
To determine whether or not the transitivity should be considered large or small, it is useful to compare it to the value for an Erdös-Rényi random network75 with the same number of nodes and edges. In this model, every edge has an equal probability of being present, independent of the existence of any other edge. Therefore the probability of a given triad being a triangle, which is the probability of the final edge being present, is the probability of any edge existing. The maximum number of edges is the number of possible pairs of nodes, n(n − 1)/2, so given the number of edges (m) and nodes (n), the transitivity is:
 | (7) |
2.4 Average shortest path length
A path in a network is a sequence of steps between nodes along edges. For any pair of nodes the shortest path (or geodesic path) is defined as the one connecting the two nodes containing the least number of edges.5 The shortest path need not be unique, but here we are concerned only with its length, which is the number of edges it contains. If no path exists between a pair of nodes, then the network is unconnected. The complete network for a PES must be connected, as it is impossible to have minima on the surface that cannot be reached from any other minima through transition states for models with continuous degrees of freedom. The length of the shortest path between one node s and all others can be calculated using a breadth-first search.762.5 Assortativity
The assortativity77 of a network is a measure of the tendency of nodes to have connections with other similar nodes. Specifically, the degree assortativity refers to whether nodes connect to other nodes of a similar degree. The assortativity coefficient takes values between 1 and −1, where 1 indicates connections between nodes of similar degree, 0 indicates no preference and −1 means that high degree nodes have a preference to connect to low degree nodes. The definition is, | (8) |
3 Results
Table 1 shows the number of minima and transition states found for the largest network considered at each range in two and three dimensions, after the removal of transition states corresponding to alternative connections of the same minima and degenerate rearrangements. Fig. 1 illustrates the number of minima and transition states for all the clusters considered.| Dimensions | ρ | N | Minima | Transition states |
|---|---|---|---|---|
| 2 | 3 | 27 | 1135 | 17006 |
| 2 | 6 | 14 | 805 | 13098 |
| 2 | 10 | 14 | 840 | 19965 |
| 2 | 14 | 14 | 843 | 20552 |
| 2 | 30 | 13 | 358 | 6966 |
| 3 | 3 | 30 | 663 | 6678 |
| 3 | 6 | 13 | 1478 | 25173 |
| 3 | 10 | 12 | 2258 | 41441 |
| 3 | 14 | 12 | 2980 | 60615 |
| 3 | 30 | 11 | 1127 | 13752 |
 | ||
| Fig. 1 The number or minima (black) and transition states (red) for all the two-dimensional (top) and three-dimensional (bottom) clusters considered. | ||
Some general patterns are clear: 3D clusters have more minima for the same range and number of particles than 2D clusters, except at very long-range with ρ = 3. The well-known approximate exponential growth of the number of minima and transition states with system size is present.4,79 A shorter-range potential produces an energy landscape that is locally rough, having more minima, but globally smooth with a less overall funnelled structure.42 To avoid the databases growing too large to be confident of finding the complete network, it was necessary to restrict the number of particles in the cluster as the range decreased. The difference in the database size is more apparent in three dimensions than two dimensions. This effect is evident in the disconnectivity graphs in Fig. 2, where the funnel for a ρ = 6 landscape is apparent, suggesting structure-seeking behaviour, but there is no such structure for ρ = 30, where the landscape is more frustrated in the region of the global minimum.
 | ||
| Fig. 2 Disconnectivity graphs for M3D13 with ρ = 6 (left) and M3D11 with ρ = 30 (right). The difference in the global structure of the landscape is clear. | ||
3.1 Small-world behaviour
To test whether or not the networks show small-world behaviour, the average shortest path length and the transitivity were considered. The average shortest path lengths for all the clusters are given in Fig. 3, and they show the expected logarithmic dependence on the number of nodes. The path lengths become slightly smaller as the range decreases. The number of transition states increases more rapidly with decreasing range than the number of minima, so a small decrease in the path length with decreasing range is not surprising. | ||
| Fig. 3 Plots of the average shortest path length against the number of minima for all the 2D clusters (top) and all the 3D clusters (bottom). Note the logarithmic scale on the horizontal axis. | ||
The transitivity for a small-world network is expected to be larger than for the equivalent random graph with the same number of minima and edges.6 The transitivity scaled by the value for a random graph with the same number of nodes and edges is plotted for all the clusters in Fig. 4. The expected small-world behaviour is again apparent, with the transitivity larger than for a random graph in all the clusters, except for three-dimensional systems with very few minima, where finite size effects dominate. There is no significant difference between the values for different ranges, except for ρ = 3, which appears to have a slightly higher transitivity. The long range of the potential produces a smoother landscape, which makes it more likely that minima in distant parts of configuration space are directly connected. Short-range clusters do not display the structure-seeking properties of long-range clusters, since their landscapes are not funnelled, and there are relatively large barriers separating some minima with similar energies. Since the present analysis accounts only for the existence of connections, regardless of barrier heights, we find that the small-world properties of the network are similar for short- and long-range clusters.
 | ||
| Fig. 4 Plots of the ratio of the transitivity of each network to the transitivity of a random graph with the same number of nodes and edges, against the number of minima for all the 2D clusters (top) and all the 3D clusters (bottom). | ||
Insight into the structure of the landscape and network can be obtained by inspecting a plot of the degree of the nodes against their potential energy, shown in Fig. 5 for M3D13 with ρ = 6 and the M3D11 with ρ = 30. The funnelled landscape for the ρ = 6 cluster has one node with a significantly lower potential energy, as seen in the disconnectivity graph (Fig. 2), which is also the node with the highest degree. Over a third of the minima in the network are directly connected to the global minimum. At higher energies, although there are many minima with different degrees at similar energies, the maximum degree for a given energy decreases as the energy increases. These observations can be related to funnels on the landscape: the global minimum has a large basin of attraction, which occupies a significant volume in configuration space, giving a large boundary surface containing many transition states. High energy minima have small basins of attraction with a small boundary surface and fewer transition states. In comparison, the global minimum for M3D11 with ρ = 30 is not the minimum with the highest degree, and the most highly connected minimum has transition states linking it to less than a quarter of the other minima. The general trend for higher energy minima to have a lower degree is still present. The prominent vertical stripes are a result of the short-ranged potential. Since the potential energy is primarily determined by the number of nearest-neighbour contacts, an integer, it is approximately discretised.80–84
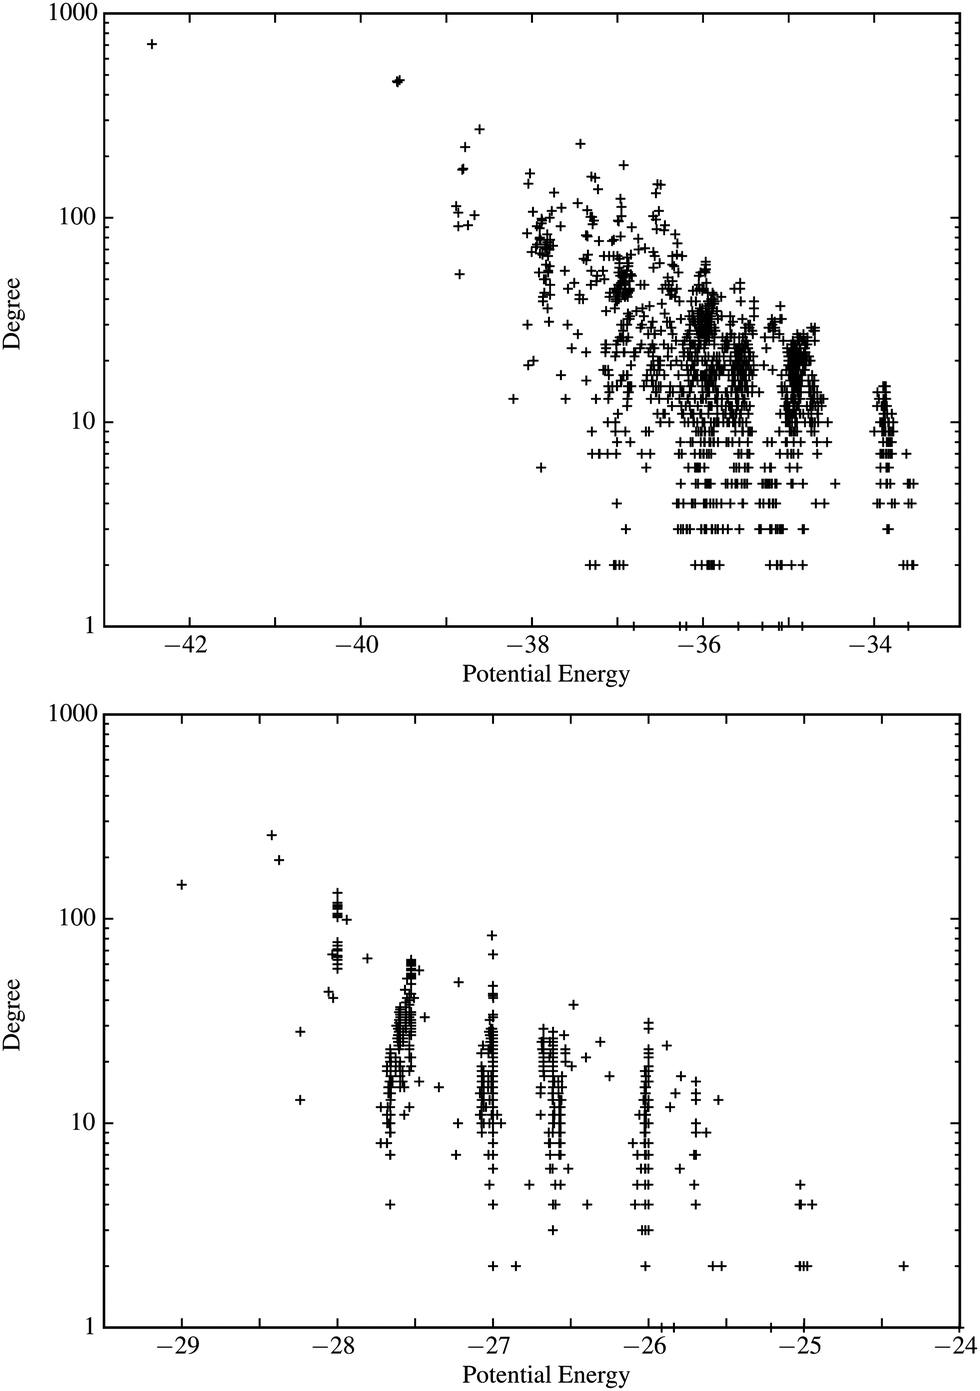 | ||
| Fig. 5 Degree of each minimum as a function of potential energy for M3D13 with ρ = 6 (top) and M3D11 with ρ = 30 (bottom). | ||
3.2 Scale-free behaviour
To test whether a network is scale-free, we must determine whether the degree distribution (or cumulative degree distribution) follows a power law, at least in the high degree range. The fitted α and kmin parameters [see eqn (2)] and p values from the goodness-of-fit tests for the largest cluster for each dimension and range parameter are shown in Table 2. We also show ntail, the number of minima remaining after those with degree less than kmin have been removed. If p < 0.05, there is good evidence to reject the hypothesis that a power law is a good fit to the data; otherwise the power law may be a good fit. A large value of kmin and a small value of ntail indicates the fit is only applicable for a small range of the data and is unreliable.| Dimensions | ρ | N | α | k min | n tail | p |
|---|---|---|---|---|---|---|
| 2 | 3 | 27 | 2.32 ± 0.32 | 23 ± 12 | 255 | 0.00 |
| 2 | 6 | 14 | 3.50 ± 0.16 | 26 ± 4 | 302 | 0.00 |
| 2 | 10 | 14 | 2.55 ± 0.14 | 18 ± 7 | 765 | 0.00 |
| 2 | 14 | 14 | 2.03 ± 0.21 | 10 ± 5 | 840 | 0.00 |
| 2 | 30 | 13 | 2.90 ± 0.15 | 17 ± 4 | 332 | 0.00 |
| 3 | 3 | 30 | 2.79 ± 0.17 | 10 ± 2 | 219 | 0.18 |
| 3 | 6 | 13 | 2.66 ± 0.16 | 19 ± 8 | 698 | 0.02 |
| 3 | 10 | 12 | 2.56 ± 0.09 | 28 ± 3 | 498 | 0.03 |
| 3 | 14 | 12 | 2.37 ± 0.12 | 65 ± 11 | 174 | 0.02 |
| 3 | 30 | 11 | 3.30 ± 0.25 | 48 ± 8 | 47 | 0.16 |
| 3 | LJ | 14 | 2.82 ± 0.10 | 37 ± 8 | 513 | 0.07 |
The cumulative degree distribution is plotted in Fig. 6 for M3D13 clusters with ρ = 6 (top) and M3D11 with ρ = 30 (bottom), along with the best power law fit calculated by the MLE method. The low degree end does not follow a power law, because the number of minima for a cluster is finite. Above kmin, the distribution appears to be approximately linear. However, the goodness-of-fit test for the ρ = 6 cluster gives p < 0.05, indicating the power law is not a good fit for the data.
 | ||
| Fig. 6 Plots of the normalised cumulative degree distribution for M3D13 with ρ = 6 (top) and M3D11 with ρ = 30 (bottom). The calculated best fit is indicated by the black dashed line. | ||
In fact, according to the suggested criteria, only two clusters have a p value compatible of a power law fit: M3D30 with ρ = 3 and M3D11 with ρ = 30. Both of these clusters have a large value of kmin compared to the number of minima in the cluster, giving a small value of ntail. Therefore the fit should be considered unreliable, especially as it is clearly the case that these clusters do not generally display scale-free behaviour.
3.3 Lennard-Jones clusters
Doye and Massen17 studied Lennard-Jones (LJ) clusters and concluded that the degree distribution follows a power law and that the networks show scale-free behaviour. However, they did not give a statistical analysis, as the appropriate tools had not been identified at that time, simply stating that ‘as the size of the clusters increase a clear power law tail develops.’ Using their data for the cluster with 14 particles,85 which includes 4196 minima and 61085 transition states, we have now applied the goodness-of-fit tests, as for the Morse clusters. These data are shown in Table 2 and the cumulative degree distribution and fit are shown in Fig. 7. Since p > 0.05, this distribution is a candidate for a power law fit. However, we tested the power law fit against a log-normal fit. The log-likelihood ratio R = 0.80, but p = 0.41, so the test is inconclusive. Clauset et al. comment that deciding between a power law fit and a log-normal fit can be problematic.15 We conclude that the distribution approximately follows a power law.
 | ||
| Fig. 7 Plot of the normalised cumulative degree distribution for LJ14. | ||
3.4 Bulk ortho-terphenyl
A database of minima and transition states for a bulk representation of the molecular glass-former ortho-terphenyl (OTP) was provided by Niblett and coworkers.26 The details of the model are described in their paper. The database was relatively large, containing 313651 minima and 334272 transition states. After removing alternative transition states linking the same pairs of minima and self-connections (degenerate rearrangements), 332774 transition states remained. In contrast to the Morse and Lennard-Jones clusters considered above, the database is certainly very far from complete, since finding all the minima and transition states for such a glassy landscape is unfeasible.
Testing whether the incomplete OTP database is likely to be representative of the full network was assessed by taking increasingly large subsets of the database and looking at the convergence of the network properties. Here the appropriate network properties are the ones that are global, but do not directly depend on the size of the network. The average shortest path length is therefore unsuitable, as it is expected to increase with the network size. Three properties were chosen: the transitivity, the average clustering coefficient (the mean of the local clustering coefficients) and the assortativity.
All three properties are only defined for a connected network, but an arbitrary subset of the database will not generally be connected because of the way it was constructed. Hence transition states were added to the network one by one, in the order located by the original search, and the largest connected component selected. Whenever the largest connected component increased in size, the network properties were calculated. Graphs of the three properties against the number of transition states in the connected component are shown in Fig. 8. There are fluctuations in the values, but all three seem to be approaching a limit. However, caution is needed in interpreting these results. Sampling biases in generating the database could potentially lead to limiting values of these properties without truly being a representative sample of the network.
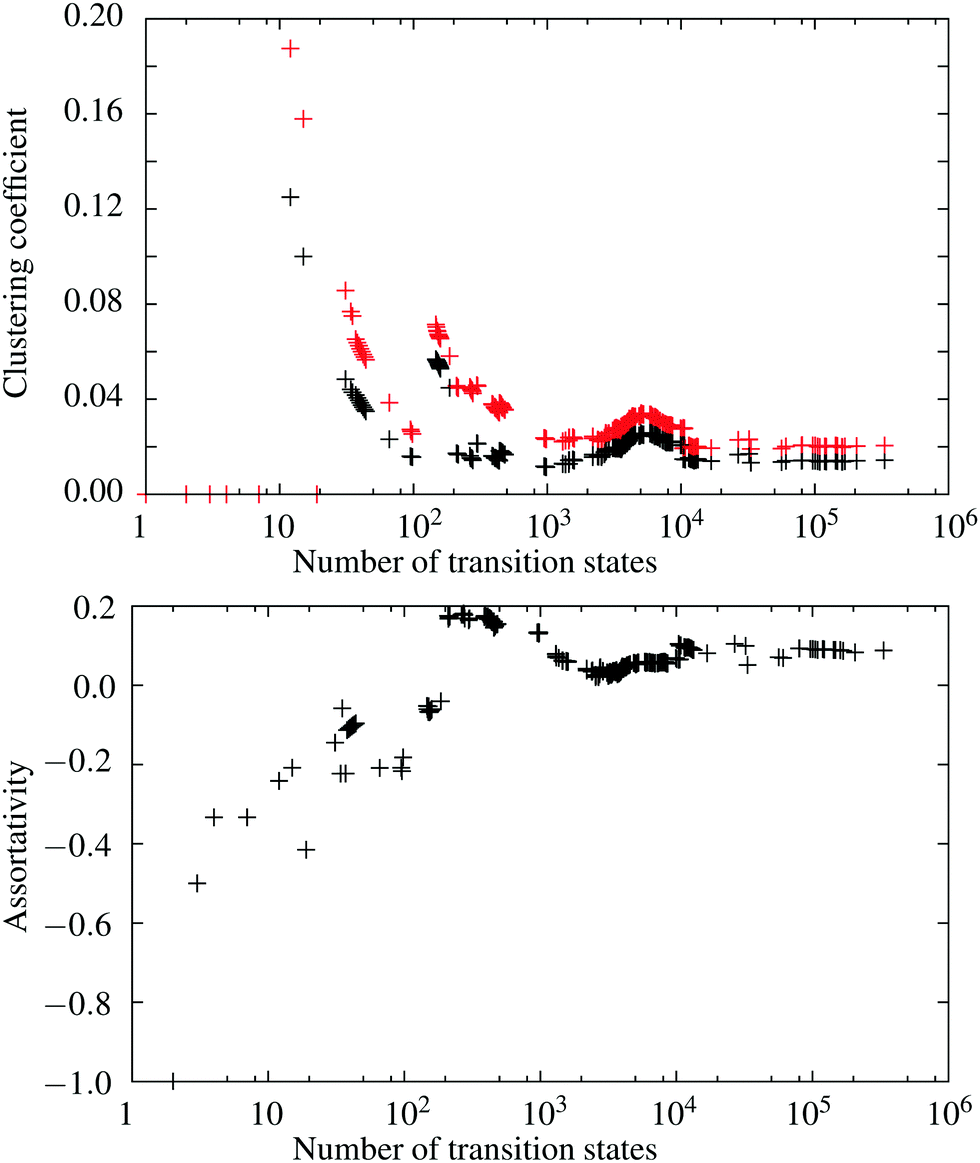 | ||
| Fig. 8 Top: The variation of the average clustering coefficient (black) and transitivity (red) as the largest connected component of the OTP database grows. Bottom: The corresponding plot for the assortativity. | ||
To test for small-world properties, the values of the average shortest path length and transitivity can be compared to those of a random graph. These ratios are plotted in Fig. 9 for increasingly large connected subgraphs of the network. The transitivity and average shortest path length increase more quickly than the values for the equivalent random graph suggesting that the network (or at least this subset of the full PES) exhibits lattice graph properties, rather than small-world behaviour. The network is mildly assortative, although the value is close to zero, indicating a slight preference for minima to connect to other minima with similar degree. Assortative networks tend to have cores of highly connected nodes with a periphery of low degree nodes.5 This pattern could arise in a glassy landscape, with well connected groups of structurally closely related minima, and higher energy minima forming the periphery between the numerous groups.
 | ||
| Fig. 9 The ratio of average shortest path length for the largest connected component of the OTP database to that of the equivalent random graph (black) and the corresponding ratio for the transitivity (red). | ||
Scale-free networks are small-world, so this network is also not scale-free. We found p = 0.0 for the power law goodness-of-fit test.
3.5 Bulk binary Lennard-Jones
A database for a bulk BLJ system was provided by de Souza and Wales.27,28 The system contained 60 atoms, 48 of type A and 12 of type B, with interaction parameters σAA = 1.0, σAB = 0.8, σBB = 0.88, εAA = 1.0, εAB = 1.5 and εBB = 0.5. These parameters are known to give rise to a glassy landscape.86,87 Periodic boundary conditions were used with a cubic box of length 3.587. The database was connected and contained 11538 minima and 13088 transition states, dropping to 12957 transition states after removing alternative transition states linking the same pairs of minima and degenerate rearrangements.
The database was expanded until it contained 703827 minima and 360836 transition states. However, the largest connected component consisted of only 12905 minima and 14363 transition states.
Our analysis followed the steps described above for OTP. The convergence of the average clustering coefficient, transitivity and assortativity are shown in Fig. 10, and the ratios of the average shortest path length and transitivity to those for the equivalent random graph are shown in Fig. 11. The results are qualitatively similar to OTP, although the convergence of the average clustering coefficient and transitivity is less clear due to the smaller sample size. The value of the assortativity is negative, indicating slight disassortativity compared to the slight assortativity of the OTP system. Park and Newman suggest that disassortativity can arise due to the exclusion of alternative and self-connections,88 so this result is unsurprising, although it is unclear why the opposite behaviour to OTP is observed. The growing ratios of average shortest path length and transitivity to the equivalent random graph suggest the same conclusion: that the system is showing lattice graph behaviour rather than small-world behaviour.
 | ||
| Fig. 10 Top: Variation of the average clustering coefficient (black) and transitivity (red) as the largest connected component of the BLJ database grows. Bottom: The corresponding plot for the assortativity. | ||
 | ||
| Fig. 11 The ratio of average shortest path length for the largest connected component of the BLJ database to that of the equivalent random graph (black) and the corresponding ratio for the transitivity (red). | ||
4 Conclusions
Networks of minima and transition states for Morse clusters with different ranges in the interatomic potential were analysed. The networks exhibited small-world properties, but statistical testing using recent methods demonstrated that they are probably not scale-free. The LJ14 cluster was re-evaluated using these new statistical methods and the tests were inconclusive: we cannot firmly conclude the network is scale-free, but it remains a possibility.The Morse networks were compared with glassy systems, which have very different energy landscapes characterised by numerous low energy amorphous structures separated by relatively high barriers. The two glassy networks did not show small-world behaviour, which suggests that the small-world properties of the LJ and Morse networks are a feature of their single-funnel potential energy landscapes. However, further investigation is required. Larger clusters with more minima and transition states will make statistical tests for scale-free behaviour more reliable.
Using the convergence of network properties to test whether a sample is representative opens the possibility of studying systems where it is impractical to find the complete network. While it remains computationally intractable to find the complete network for glassy systems, as the number of minima and transition states is far too large, we believe the approach here will allow further insight for such systems. It is certainly possible to generate and analyse larger samples, and if databases generated by different schemes converge on the same properties we can have greater confidence about whether the samples are truly representative. Analysing the network properties of a representative sample will provide deeper understanding of the behaviour of bulk glasses. The LJ38 cluster, which has a double-funnel landscape,89 could produce interesting results if the two funnels are considered separately and together. Studying a fast-folding protein network would also be insightful. On the basis of the results here, we anticipate that the folding network is not really scale-free, but due to its known structure-seeking nature, small-world character is likely.
Conflicts of interest
There are no conflicts of interest to declare.Acknowledgements
JM acknowledges the support of a Sackler Studentship from the University of Cambridge. Part of this work was performed while DM was a member of the Department of Chemistry at the University of Cambridge, financially supported by the Engineering and Physical Sciences Research Council and the European Research Council. Data can be accessed at http://doi.org/10.5281/zenodo.580085.References
- D. J. Wales, Energy landscapes, Cambridge University Press, 2003 Search PubMed.
- J. N. Murrell and K. J. Laidler, Trans. Faraday Soc., 1968, 64, 371–377 RSC.
- F. H. Stillinger and T. A. Weber, Phys. Rev. A: At., Mol., Opt. Phys., 1982, 25, 978–989 CrossRef CAS.
- F. H. Stillinger and T. A. Weber, Science, 1984, 225, 983–989 CAS.
- M. E. J. Newman, Networks: An Introduction, Oxford University Press, 2010 Search PubMed.
- D. J. Watts and S. H. Strogatz, Nature, 1998, 393, 440–442 CrossRef CAS PubMed.
- A. Fronczak, P. Fronczak and J. A. Holyst, Phys. Rev. E: Stat., Nonlinear, Soft Matter Phys., 2002, 70, 056110 CrossRef PubMed.
- S. Milgram, Psychol. Today, 1967, 2, 60–67 Search PubMed.
- J. Guare, Six Degrees of Separation: A Play, Vintage Books, New York, 1990 Search PubMed.
- The Oracle of Bacon, http://oracleofbacon.org/, accessed: 8th August 2016.
- A.-L. Barabási and R. Albert, Science, 1999, 286, 509–512 CrossRef.
- R. Albert and A.-L. Barabási, Rev. Mod. Phys., 2002, 74, 47–97 CrossRef.
- D. Hughes, M. Paczuski, R. O. Dendy, P. Helander and K. G. McClements, Phys. Rev. Lett., 2003, 90, 131101 CrossRef CAS PubMed.
- M. Baiesi and M. Paczuski, Phys. Rev. E: Stat., Nonlinear, Soft Matter Phys., 2004, 69, 066106 CrossRef PubMed.
- A. Clauset, C. R. Shalizi and M. E. J. Newman, SIAM Rev., 2009, 51, 661–703 CrossRef.
- J. P. K. Doye, Phys. Rev. Lett., 2002, 88, 238701 CrossRef PubMed.
- J. P. K. Doye and C. P. Massen, J. Chem. Phys., 2005, 122, 084105 CrossRef PubMed.
- J. M. Carr and D. J. Wales, J. Phys. Chem. B, 2008, 112, 8760–8769 CrossRef CAS PubMed.
- J. P. K. Doye and C. P. Massen, Phys. Rev. E: Stat., Nonlinear, Soft Matter Phys., 2005, 71, 016128 CrossRef PubMed.
- F. Rao and A. Caflisch, J. Mol. Biol., 2004, 342, 299–306 CrossRef CAS PubMed.
- G. R. Bowman and V. S. Pande, Proc. Natl. Acad. Sci. U. S. A., 2010, 107, 10890–10895 CrossRef CAS PubMed.
- D. Chakraborty, R. Collepardo-Guevara and D. J. Wales, J. Am. Chem. Soc., 2014, 136, 18052–18061 CrossRef CAS PubMed.
- D. Mehta, J. Chen, D. Z. Chen, H. Kusumaatmaja and D. J. Wales, Phys. Rev. Lett., 2016, 117, 028301 CrossRef PubMed.
- J. J. Thomson, London, Edinburgh Dublin Philos. Mag., 1904, 7, 237–265 CrossRef CAS.
- A. J. Ballard, R. Das, S. Martiniani, D. Mehta, L. Sagun, J. D. Stevenson and D. J. Wales, Phys. Chem. Chem. Phys., 2017, 19, 12585–12603 RSC.
- S. P. Niblett, V. K. de Souza, J. D. Stevenson and D. J. Wales, J. Chem. Phys., 2016, 145, 024505 CrossRef CAS PubMed.
- V. K. de Souza and D. J. Wales, Phys. Rev. B: Condens. Matter Mater. Phys., 2006, 74, 134202 CrossRef.
- V. K. de Souza and D. J. Wales, J. Chem. Phys., 2008, 129, 164507 CrossRef PubMed.
- P. M. Morse, Phys. Rev., 1929, 34, 57–64 CrossRef CAS.
- P. A. Braier, R. S. Berry and D. J. Wales, J. Chem. Phys., 1990, 93, 8745–8756 CrossRef CAS.
- J. P. K. Doye, D. J. Wales and R. S. Berry, J. Chem. Phys., 1995, 103, 4234–4249 CrossRef CAS.
- D. T. Mainz and R. S. Berry, Mol. Phys., 1996, 88, 709–726 CrossRef CAS.
- J. P. K. Doye and D. J. Wales, Science, 1996, 271, 484–487 CAS.
- J. P. K. Doye and D. J. Wales, J. Phys. B: At., Mol. Opt. Phys., 1996, 29, 4859–4894 CrossRef CAS.
- J. P. K. Doye and D. J. Wales, J. Chem. Soc. Faraday Today, 1997, 93, 4233–4243 RSC.
- L. Cheng and J. Yang, J. Phys. Chem. A, 2007, 111, 5287–5293 CrossRef CAS PubMed.
- Y. Feng, L. Cheng and H. Liu, J. Phys. Chem. A, 2009, 113, 13651–13655 CrossRef CAS PubMed.
- L. A. Girifalco and V. G. Weizer, Phys. Rev., 1959, 114, 687–690 CrossRef CAS.
- D. J. Wales, ChemPhysChem, 2010, 11, 2491–2494 CrossRef CAS PubMed.
- A. Malins, S. R. Williams, J. Eggers, H. Tanaka and C. P. Royall, J. Phys.: Condens. Matter, 2009, 21, 425103 CrossRef PubMed.
- J. Taffs, A. Malins, S. R. Williams and C. P. Royall, J. Phys.: Condens. Matter, 2010, 22, 104119 CrossRef PubMed.
- F. Calvo, J. P. K. Doye and D. J. Wales, Nanoscale, 2012, 4, 1085–1100 RSC.
- J. W. R. Morgan and D. J. Wales, Nanoscale, 2014, 6, 10717–10726 RSC.
- J. W. Merrill, S. K. Sainis and E. R. Dufresne, Phys. Rev. Lett., 2009, 103, 138301 CrossRef PubMed.
- O. M. Becker and M. Karplus, J. Chem. Phys., 1997, 106, 1495–1517 CrossRef CAS.
- D. J. Wales, M. A. Miller and T. A. Walsh, Nature, 1998, 394, 758–760 CrossRef CAS.
- L. Cheng and J. Yang, J. Phys. Chem. A, 2007, 111, 2336–2342 CrossRef CAS PubMed.
- Z. Li and H. A. Scheraga, Proc. Natl. Acad. Sci. U. S. A., 1987, 84, 6611–6615 CrossRef CAS.
- Z. Li and H. A. Scheraga, THEOCHEM, 1988, 179, 333 CrossRef.
- D. J. Wales and J. P. K. Doye, J. Phys. Chem. A, 1997, 101, 5111–5116 CrossRef CAS.
- D. J. Wales and H. A. Scheraga, Science, 1999, 285, 1368–1372 CrossRef CAS PubMed.
- D. J. Wales and T. V. Bogdan, J. Phys. Chem. B, 2006, 110, 20765–20776 CrossRef CAS PubMed.
- D. J. Wales, GMIN: A program for basin-hopping global optimisation, http://www-wales.ch.cam.ac.uk/software.html.
- S. A. Trygubenko and D. J. Wales, J. Chem. Phys., 2004, 120, 2082–2094 CrossRef CAS PubMed.
- S. A. Trygubenko and D. J. Wales, J. Chem. Phys., 2004, 120, 7820 CrossRef CAS.
- D. Sheppard, R. Terrell and G. Henkelman, J. Chem. Phys., 2008, 128, 134106 CrossRef PubMed.
- G. Mills and H. Jónsson, Phys. Rev. Lett., 1994, 72, 1124–1127 CrossRef CAS PubMed.
- G. Mills, H. Jónsson and G. K. Schenter, Surf. Sci., 1995, 324, 305–337 CrossRef CAS.
- H. Jónsson, G. Mills and K. W. Jacobsen, Classical and Quantum Dynamics in Condensed Phase Simulations, World Scientific, Singapore, 1998 Search PubMed.
- G. Henkelman, B. P. Uberuaga and H. Jónsson, J. Chem. Phys., 2000, 113, 9901–9904 CrossRef CAS.
- G. Henkelman and H. Jónsson, J. Chem. Phys., 2000, 113, 9978–9985 CrossRef CAS.
- L. J. Munro and D. J. Wales, Phys. Rev. B: Condens. Matter Mater. Phys., 1999, 59, 3969–3980 CrossRef CAS.
- D. J. Wales, OPTIM: A Program for Optimizing Geometries and Calculating Reaction Pathways, http://www-wales.ch.cam.ac.uk/software.html.
- D. J. Wales, PATHSAMPLE: A program for generating connected stationary point databases and extracting global kinetics, http://www-wales.ch.cam.ac.uk/software.html.
- D. J. Wales, J. P. K. Doye, M. A. Miller, P. N. Mortenson and T. R. Walsh, Adv. Chem. Phys., 2000, 115, 1–111 CrossRef.
- Y. Kumeda, D. J. Wales and L. J. Munro, Chem. Phys. Lett., 2001, 341, 185–194 CrossRef CAS.
- B. Strodel, C. S. Whittleston and D. J. Wales, J. Am. Chem. Soc., 2007, 129, 16005–16014 CrossRef CAS PubMed.
- A. A. Hagberg, D. A. Schult and P. J. Swart, Proceedings of the 7th Python in Science Conference (SciPy2008), Pasadena, CA USA, 2008, pp. 11-15.
- R. E. Leone and P. von R. Schleyer, Angew. Chem., Int. Ed., 1970, 9, 860–890 CrossRef CAS.
- A. N. M. Muniruzzaman, Calcutta Statist. Assoc. Bull., 1957, 7, 115–126 CrossRef.
- A. Clauset, M. Young and K. S. Gleditsch, J. Confl. Resolut., 2007, 51, 58–87 CrossRef.
- W. H. Press, S. A. Teukolsky, W. T. Vetterling and B. P. Flannery, Numerical Recipes in C: The Art of Scientific Computing, Cambridge University Press, 2nd edn, 1992 Search PubMed.
- Q. H. Vuong, Econometrica, 1989, 57, 307–333 CrossRef.
- R. D. Luce and A. D. Perry, Psychometrika, 1949, 14, 95–116 CrossRef CAS PubMed.
- P. Erdös and A. Rényi, Publ. Math. Debrecen, 1959, 6, 290–297 Search PubMed.
- E. F. Moore, The shortest path through a maze, Bell Telephone System, 1959 Search PubMed.
- M. E. J. Newman, Phys. Rev. Lett., 2002, 89, 208701 CrossRef CAS PubMed.
- K. Pearson, Proc. R. Soc., 1895, 58, 240–242 CrossRef.
- D. J. Wales and J. P. K. Doye, J. Chem. Phys., 2003, 119, 12409–12416 CrossRef CAS.
- D. J. Wales, J. Chem. Soc. Faraday Trans., 1994, 90, 1061–1063 RSC.
- J. P. K. Doye and D. J. Wales, Chem. Phys. Lett., 1996, 262, 167–174 CrossRef CAS.
- J. P. K. Doye, A. Dullweber and D. J. Wales, Chem. Phys. Lett., 1997, 269, 408–412 CrossRef CAS.
- W. Branz, N. Malinowski, A. Enders and T. P. Martin, Phys. Rev. B: Condens. Matter Mater. Phys., 2002, 66, 094107 CrossRef.
- F. Calvo, M. Benali, V. Gerbaud and M. Hemati, Comput. Lett., 2005, 1, 183–191 CrossRef.
- LJN networks, http://doye.chem.ox.ac.uk/networks/LJn.html, accessed: 7th October 2016.
- W. Kob and H. C. Andersen, Phys. Rev. Lett., 1994, 73, 1376–1379 CrossRef CAS PubMed.
- W. Kob and H. C. Andersen, Phys. Rev. E: Stat. Phys., Plasmas, Fluids, Relat. Interdiscip. Top., 1995, 51, 4626–4641 CrossRef CAS.
- J. Park and M. E. J. Newman, Phys. Rev. E: Stat., Nonlinear, Soft Matter Phys., 2003, 68, 026112 CrossRef PubMed.
- J. P. K. Doye, M. A. Miller and D. J. Wales, J. Chem. Phys., 1999, 110, 6896–6906 CrossRef CAS.
| This journal is © the Owner Societies 2017 |