
 Open Access Article
 This Open Access Article is licensed under a
 Creative Commons Attribution 3.0 Unported Licence
Dynamics of poly(vinyl butyral) studied using dielectric spectroscopy and 1H NMR relaxometry†
Silvia
Pizzanelli
 *a,
Daniele
Prevosto
b,
Massimiliano
Labardi
b,
Tommaso
Guazzini
b,
Simona
Bronco
b,
Claudia
Forte
a and
Lucia
Calucci
a
*a,
Daniele
Prevosto
b,
Massimiliano
Labardi
b,
Tommaso
Guazzini
b,
Simona
Bronco
b,
Claudia
Forte
a and
Lucia
Calucci
a
aCNR-ICCOM, Istituto di Chimica dei Composti OrganoMetallici, Consiglio Nazionale delle Ricerche-CNR, Via G. Moruzzi, 1, 56124 Pisa, Italy. E-mail: silvia.pizzanelli@pi.iccom.cnr.it; Tel: +39 0503152549
bCNR-IPCF, Istituto per Processi Chimico-Fisici, Consiglio Nazionale delle Ricerche-CNR, Via G. Moruzzi, 1, 56124 Pisa, Italy
First published on 13th November 2017
Abstract
Dielectric Spectroscopy (DS) and 1H Fast Field-Cycling (FFC) NMR relaxometry were applied for understanding the dynamic behavior of the amorphous ter-polymer poly(vinyl butyral) (PVB) across the glass transition temperature (Tg = 70 °C by Differential Scanning Calorimetry). Above Tg, main chain segmental motions (α relaxation) were detected and characterized using both DS and FFC NMR relaxometry. The correlation times extracted by the analysis of DS and FFC NMR relaxometry data agreed within a factor of three and showed a Vogel–Fulcher–Tammann temperature dependence, with an associated Tg of 69 °C and a fragility of 155 for PVB glass. Below Tg, a secondary process (β relaxation) was revealed by DS, and was ascribed to reorientations of the vinyl alcohol dipoles due to local twisting motions with an associated activation barrier of 11 kcal mol−1. The β process was also found to contribute to 1H NMR relaxation above Tg.
1. Introduction
Poly(vinyl butyral) (PVB) is a random ter-polymer of vinyl butyral, vinyl alcohol and vinyl acetate (Fig. 1). The random structure of PVB results in an amorphous polymer showing excellent optical clarity, adhesive properties, toughness, and flexibility. Thanks to these properties, PVB is widely employed as an interlayer material in the manufacture of safety glass laminates, particularly in automotive and architectural glass. It is also used in solar photovoltaic modules and as a binder in various coatings, enamels, adhesives, and inks.1–3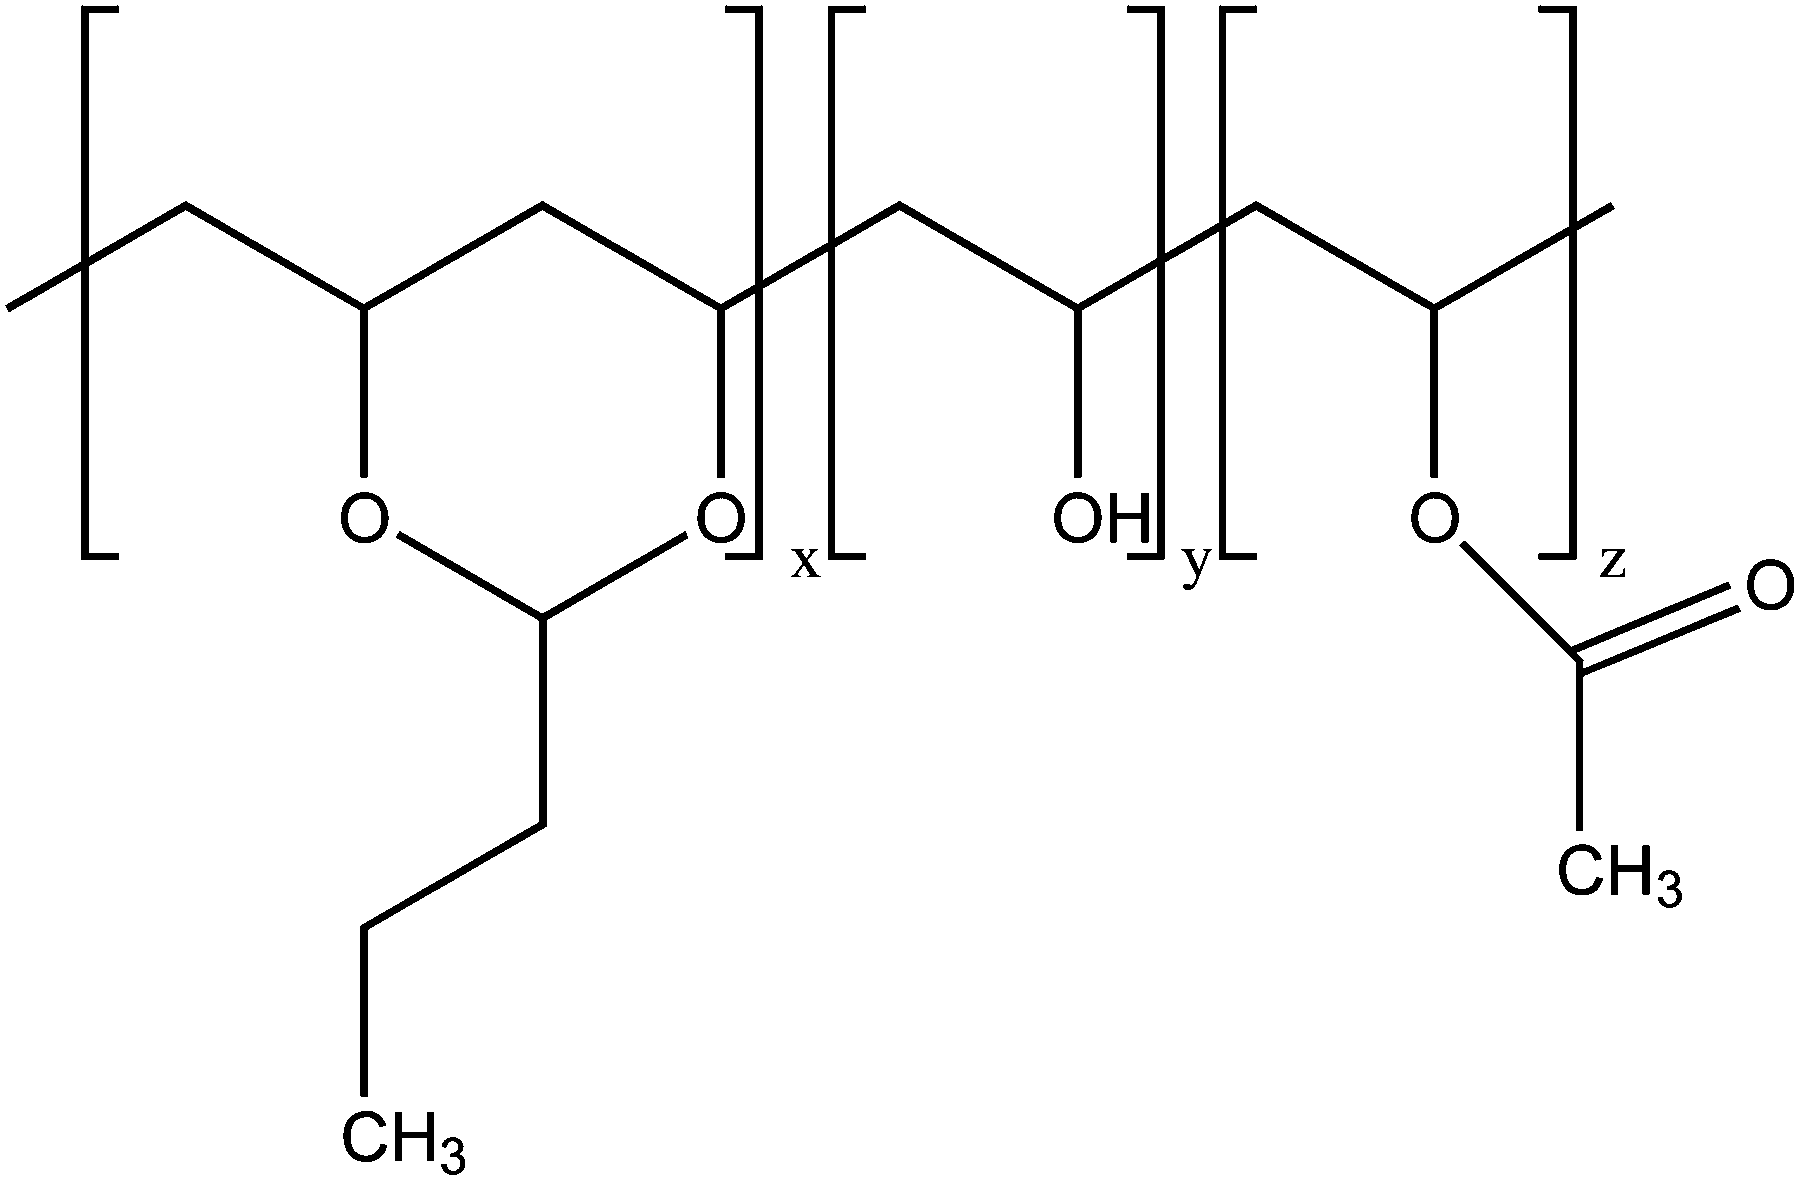 | ||
| Fig. 1 Chemical structure of PVB. For the sample investigated in this work, the molar fractions of vinyl butyral (x), vinyl alcohol (y), and vinyl acetate (z) units are 0.55–0.57, 0.41–0.45, and 0–0.02, respectively. | ||
In spite of a large number of industrial applications, the microscopic structural and dynamic properties of PVB have not been thoroughly characterized. In particular, chemical composition, molecular weight, and glass transition temperature of commercial PVB films were investigated using standard analytical techniques.4,5 Viscoelastic studies were recently performed on PVB films containing additives6–8 and on neat PVB,9 the latter study providing a rather low average molecular weight between entanglements (Me = 2670 g mol−1). As far as the dynamic properties of PVB are concerned, dielectric spectroscopy (DS) investigations were reported quite long ago, sometimes in combination with mechanical measurements.10–13 However, the results shown in the different publications seem incoherent, possibly because of the different, often unspecified, PVB composition and/or the different sample treatments. More recently, DS data were reported only at a few temperatures above the PVB glass transition in comparative studies of pristine PVB and PVB either UV irradiated14 or loaded with alumina particles.1513C solid state NMR spectroscopy experiments highlighted the formation of regions with different polymer mobility in plasticized PVB and the dynamics of some functional groups could be qualitatively investigated at room temperature as a function of the plasticizer content.16–18 All this considered, the dynamic properties of PVB remain largely unexplored.
DS and 1H Fast Field-Cycling (FFC) NMR relaxometry19–21 are two extremely informative techniques for investigating the reorientation of side groups and segmental dynamics of polymeric systems over a broad frequency range. In particular, DS can be used to investigate motions associated with orientation rearrangements of permanent electric dipoles with characteristic frequency scales ranging from about 10−3 to 1010 Hz. This is achieved by measuring the polarization current induced by dipole reorientation after the application of an alternating electric field. Motions of lateral chains and cooperative segmental motions are usually indicated as β and α relaxation processes and they dominate DS spectra at low and high temperatures, respectively. 1H FFC NMR relaxometry allows polymer dynamics to be investigated by measuring the dependence (dispersion) of the proton spin–lattice relaxation time T1 on the Larmor frequency. 1H relaxation originates from fluctuations of dipole–dipole interactions between proton pairs due to polymer motions. With commercial FFC relaxometers the frequency range from 0.01 to 40 MHz is covered, this range being further extendable to lower frequencies with home-made relaxometers22 and to higher frequencies with high field superconducting spectrometers.
Dynamics of melt-like polymer chains can be depicted as a hierarchy of processes starting from very fast and local conformational rearrangements (i.e. isomeric motions in side chains and local reorientations of the chains within the so-called Kuhn segment) and extending to slow, diffusive and collective motions of the polymer chains.23–25 Local dynamics (also referred to as glassy dynamics), which is related to the glass transition phenomenon, usually dominates 1H NMR longitudinal relaxation at low temperature and high frequency, while polymer chain dynamics prevails at high temperature and low frequency.20,21 In recent papers, it was shown that the combination of DS and 1H FFC NMR relaxometry can give detailed information on the dynamics of melt polymers, not attainable when a single method is used.21,26,27
In the present work, DS and 1H FFC NMR were applied to investigate the dynamic properties of a PVB film, with a composition representative of that used for interlayer films in the safety glass industry, both below and above the glass transition (Tg = 70 °C, as determined using Differential Scanning Calorimetry, DSC). In particular, dynamic processes occurring in the glassy state were studied using DS, reaching temperatures as low as 130 K below Tg, while both DS and 1H FFC NMR were applied to investigate the polymer dynamics above Tg. However, due to the technical limitations and the necessity to ensure polymer stability, we could reach temperatures only up to 120 °C, that is only 50 K above Tg; this limited the investigation to chain segmental dynamics. The obtained results were discussed taking into account motions of different polymer moieties that, given the quite complex structure of PVB, may contribute to dielectric relaxation and/or 1H longitudinal relaxation at the investigated frequencies and temperatures. In fact, reorientations of permanent dipoles present in both butyral and vinyl alcohol moieties contribute to dielectric relaxation, with butyral dipoles being unable to reorient independently of the main chain and vinyl alcohol dipoles reorienting because of both backbone segmental motions and local motions. On the other hand, contributions to 1H T1's may arise from reorientations of both main chain segments and side groups, in particular propyl chains of butyral monomers.
2. Experimental
2.1 Sample preparation
PVB (trade name Butvar B98) was purchased from Sigma-Aldrich. The molecular weight, Mw, determined using size exclusion chromatography, was 79 kg mol−1 with a polydispersity of 2.4. The molar fractions of the vinyl butyral, vinyl alcohol, and vinyl acetate units, verified by means of 1H NMR in CDCl3 according to ref. 28, were 0.55–0.57, 0.41–0.45 and 0–0.02, respectively.For DSC and NMR measurements, a film was prepared by dissolving PVB in ethanol at 75 °C at a concentration of about 4 wt% and stirring for 30 min. Then the solution was transferred into a teflon Petri dish and let dry in air until complete evaporation of the alcohol, which occurred after several days. The thickness of the obtained film was about 200 μm, as measured by means of a caliper. Before measurements, the film was heated at 70 °C at a pressure of 10−2 Torr for 12 hours and afterwards kept under a nitrogen atmosphere.
For the dielectric spectroscopy measurements, a film of PVB was cast from an ethanol solution (about 8 wt%) onto a steel plate, obtaining a 50 μm thick film. The sample was heated at 70 °C under vacuum for 60 hours. Before measurements, the film was capped by an indium coated upper plate to form a parallel plate capacitor.
The heat treatment under reduced pressure ensured the removal of residual water and ethanol. No signal was detected for mobile water or ethanol in 1H Free Induction Decay (FID) analyses of the PVB film.29 On the other hand, no evidence of constrained ethanol was present in the 13C Cross Polarization Magic Angle Spinning NMR spectra (see Fig. S1 in the ESI†). Moreover, residual ethanol was found to be 4.2 ± 0.5 mg per kg of the polymer using headspace solid-phase microextraction coupled with gas chromatography mass spectrometry (HS-SPME-GCMS)30 performed on the PVB film after heating at 80 °C for 1 hour.
2.2 Molecular weight determination
M w and polydispersity were determined by size exclusion chromatography using an Agilent Technologies 1200 Series instrument equipped with two PLgel 5 μm MiniMIX-D columns (flux 0.3 mL min−1) and a refraction index detector. Monodisperse poly(styrene) samples were used as calibration standards. The analysis was performed on a PVB solution in chloroform (2 mg mL−1) filtered through a 0.2 μm filter prior to the measurement.2.3 Differential scanning calorimetry
The glass transition temperature of the film was determined by means of DSC, performed on a Seiko SII ExtarDSC7020 calorimeter using the following thermal protocol: first cooling from 20 to 0 °C; 0 °C for 2 min; first heating from 0 to 110 °C; 110 °C for 2 min; second cooling from 110 to 0 °C; 0 °C for 2 min; second heating from 0 to 110 °C; 110 °C for 2 min; third cooling from 110 to 20 °C. The cooling/heating rate was always 10 K min−1 except for the last cooling process, when it was fixed to 30 K min−1. The sample amount was ∼5 mg.2.4 Dielectric spectroscopy
Dielectric relaxation spectra were recorded using an Alpha Analyzer from Novocontrol (frequency interval 10−2–107 Hz). The temperature was controlled through a heated flow of nitrogen gas by means of a Quatro Cryosystem integrated to the spectrometer. During the whole measurement period the sample was kept in a pure nitrogen atmosphere. Measurements were performed upon cooling in the interval from 86 to −60 °C and subsequently upon heating from 70 to 116 °C. The spectra acquired between 70 and 86 °C upon either heating or cooling were reproducible. Different measurement sessions were performed showing good agreement among measurements at different dates.DS data were fitted using the software Grafity,31 version 0.4.5.
2.5 1H FFC NMR relaxometry
The 1H longitudinal relaxation times T1 were measured at different Larmor frequency values over the range 10 kHz–30 MHz using a Spinmaster FFC-2000 (Stelar srl, Mede, Italy) relaxometer. The measurements were performed using the prepolarized (PP) and nonpolarized (NP) pulse sequences below and above 10 MHz, respectively.19 In the former case, a polarizing field of 0.7 T, corresponding to a 1H Larmor frequency of 30.0 MHz, was used. The detection field was 0.5 T, corresponding to a 1H Larmor frequency of 21.5 MHz and the switching time was 3 ms. The 90° pulse duration was 9.7 μs and 2 scans were accumulated. All the other experimental parameters were optimized for each experiment. Each relaxation trend was acquired with at least 16 values of the variable delay t and was then fitted to the following equation| M(t) = Mrelax + (Mpol − Mrelax)exp(−t/T1) | (1) |
The analysis of the experimental 1H FFC NMR data in terms of models for longitudinal relaxation was performed using the least-squares minimization procedure implemented in the Fitteia environment.32,33
3. Results and discussion
3.1 Dielectric spectroscopy
Dielectric spectra were acquired on the PVB film as a function of frequency at different temperatures from −60 to 116 °C. The frequency dependence of the dielectric loss, ε′′, is shown in Fig. 2a and b for selected temperatures below and above the glass transition, respectively. Below Tg a peak attributed to a secondary (β) relaxation process was observed, with the peak maximum moving towards higher frequencies upon heating (Fig. 2a). Around the glass transition, another more intense peak appeared in the spectra due to cooperative segmental motions of the main chain (α relaxation); the trend of this peak upon heating is similar to those reported in ref. 10 and 15. In the 50 to 70 °C temperature range, motions responsible for β relaxation were so fast that the peak maxima occurred above the available frequency range and motions associated with α relaxation contributed to the spectra in a frequency range where the effect of conductivity is dominant (Fig. 2a). Indeed a conductivity contribution to the signal was observed starting from 40 °C; this contribution, showing the usual ν−1 dependence,19 was subtracted from the spectra shown in Fig. 2b to highlight the α process.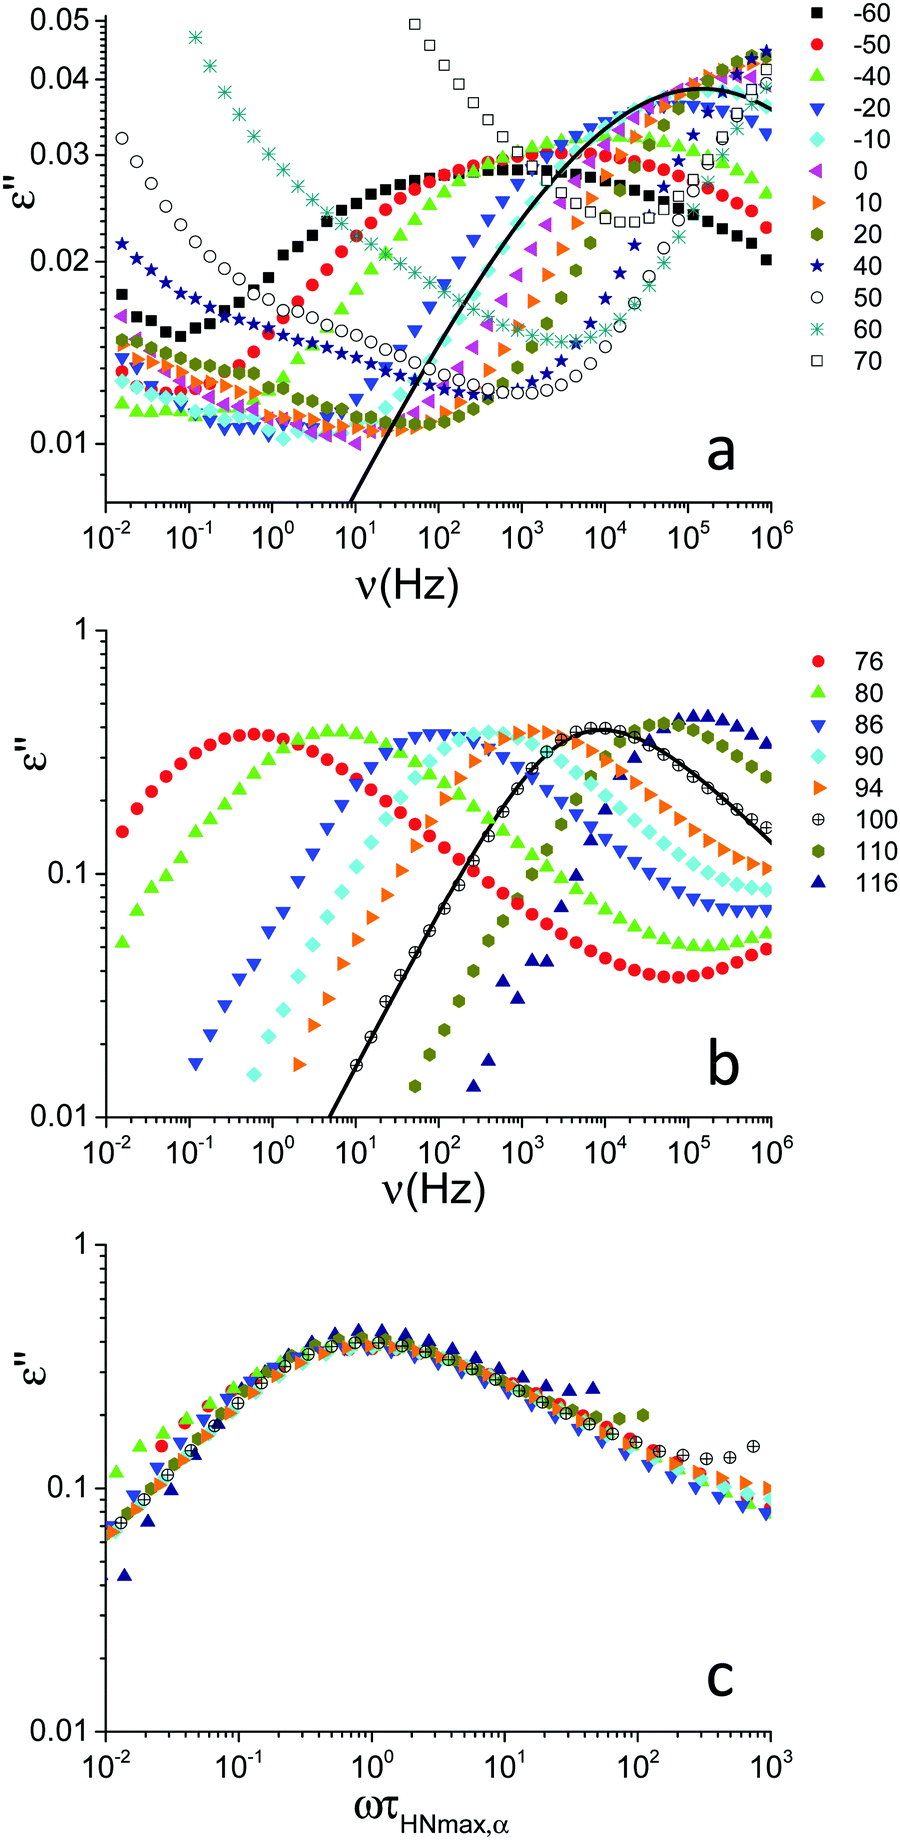 | ||
| Fig. 2 Frequency dependence of the dielectric loss, ε′′, for PVB at the indicated temperatures (expressed in °C) below (a) and above (b) the glass transition temperature (Tg = 70 °C). The spectra shown in (b) were obtained after subtraction of the conductivity contribution. For the spectra at −10 and 100 °C, the curves obtained by data fitting are shown as examples. At −10 °C, the solid line represents the HN function (eqn (2) and (3), see the text) describing the β relaxation. The fitting parameters are τ(DS)HN,β = (1.1 ± 0.7) × 10−6 s, Δεβ = 0.33 ± 0.04, aβ = 0.29 ± 0.03 (bβ was fixed to 1). At 100 °C, the solid line represents the HN function pertaining to the α relaxation. The fitting parameters are τ(DS)HN,α =(4.8 ± 2.0) × 10−5 s, Δεα = 1.80 ± 0.06, aα = 0.66 ± 0.04, bα = 0.51 ± 0.09. (c) Frequency-temperature superposition of the spectra shown in (b). | ||
Frequency-temperature superposition (FTS) applied for the α process, as shown in Fig. 2c, indicating that the DS spectral shape of the structural relaxation only slightly changes with temperature in the rubbery state, as observed for other polymers.21
Quantitative information on the α and β relaxation processes was obtained analyzing the ε′′(ν) data using the imaginary part of the empirical Havriliak–Negami (HN) function.34–36ε′′(ν) can be expressed in terms of the relaxation strength of the process, Δε, and the HN spectral density, JHN(ν), by the following equation:
| ε′′(ν) = Δε·π·JHN(ν) | (2) |
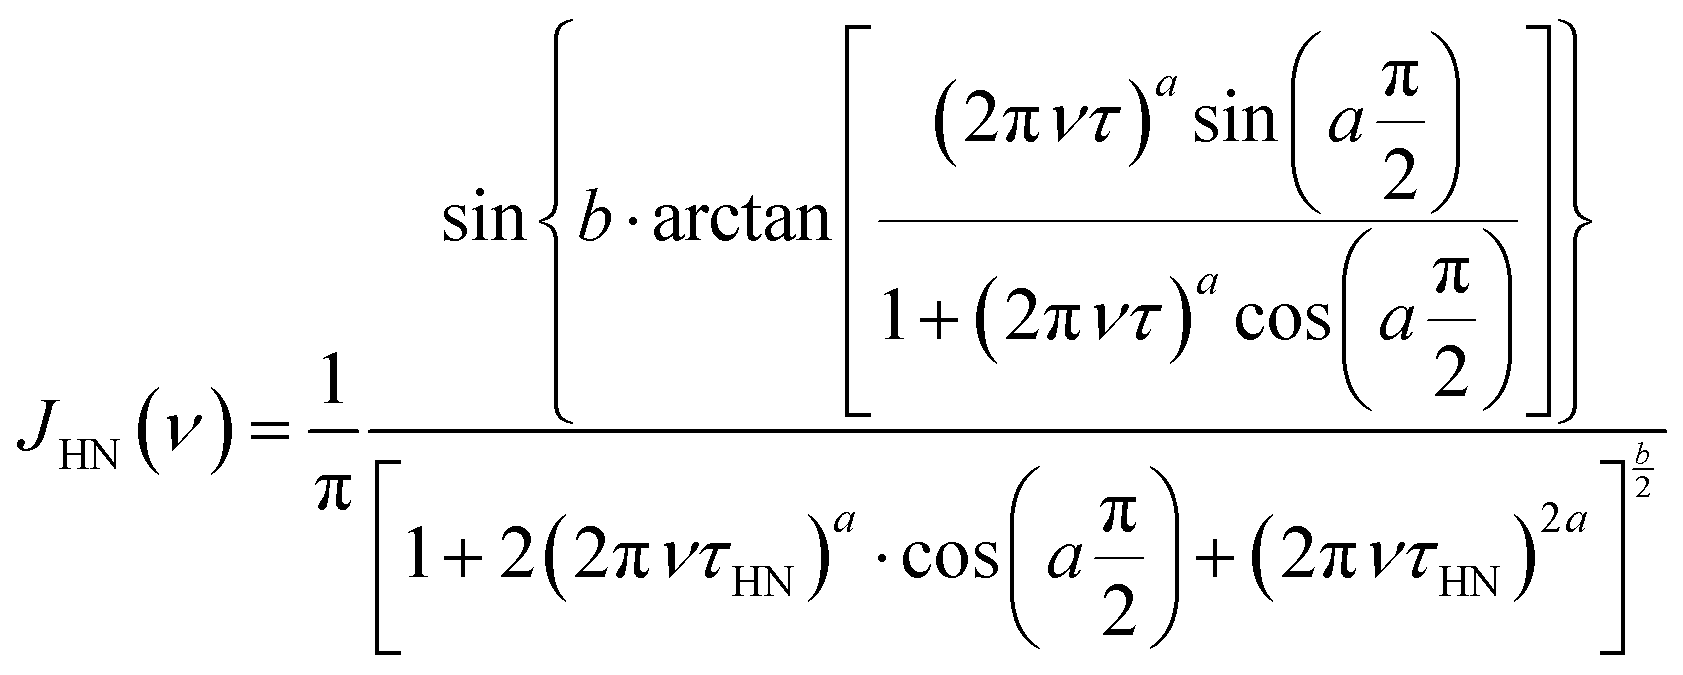 | (3) |
The parameter a of the β process, aβ, was found to be 0.30 ± 0.04 in the temperature range from −60 to 40 °C, whereas bβ was ∼0.4 below −10 °C and was fixed to 1 at temperatures ≥−10 °C. Low values of aβ indicate that the β relaxation is characterized by a broad distribution of correlation times, typically attributed to the existence of a large variety of environments experienced by the reorienting dipoles. Δεβ did not depend significantly on temperature, as commonly observed for β processes below Tg,38 and showed values scattered around 0.4. In order to facilitate the comparison with the literature data for similar systems, the correlation time, τHNmax, equal to the inverse angular frequency at the HN function maximum (τHNmax = 1/(2πνmax)), was derived from the parameter τHN according to the following formula39,40
 | (4) |
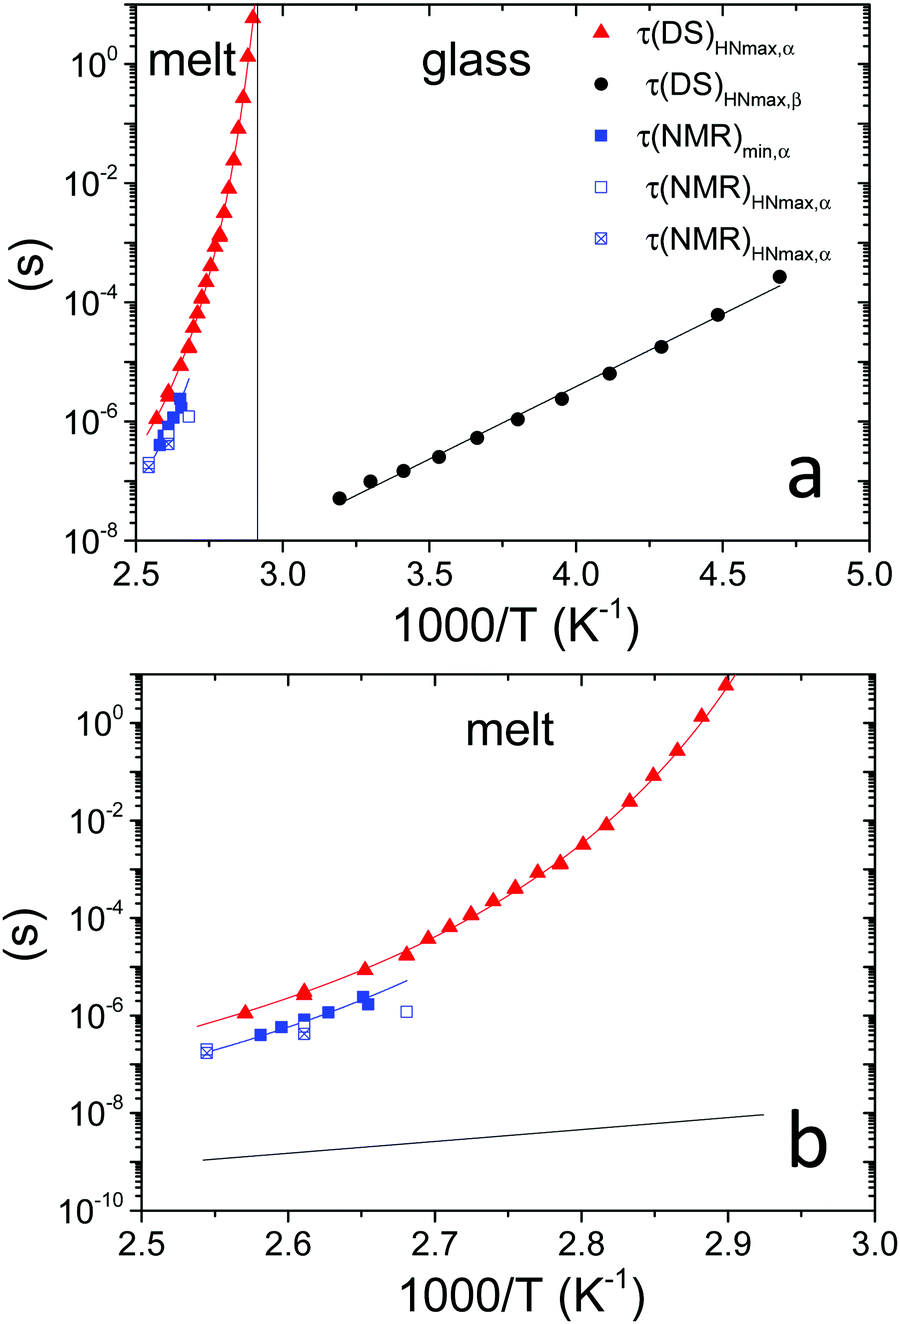 | ||
Fig. 3 (a) Temperature dependence of: τ(DS)HNmax,α (red triangles) and τ(DS)HNmax,β (black circles) derived from DS data; τ(NMR)min,α (blue squares) extracted from FFC NMR data represented in Fig. 4b exploiting the condition 2πνminτ(NMR)min,α ≅ 0.616; τ(NMR)HNmax,α extracted from the analysis of  shown in Fig. 5 considering two (blue empty squares) and one (blue crossed empty squares) processes, as described in the text. The solid lines represent the best fitting curves for each data set: τ(DS)HNmax,α and τ(NMR)min,α are described by the VFT equation (D = 2.6 ± 0.4, T0 = 41 ± 3 °C), whereas an Arrhenius equation fits τ(DS)HNmax,β (Eact = 11.1 ± 0.2 kcal mol−1). The vertical line marks the glass transition temperature. (b) Expansion of (a) for temperatures above Tg. The black line represents an extrapolation of τ(DS)HNmax,β to temperatures above Tg. shown in Fig. 5 considering two (blue empty squares) and one (blue crossed empty squares) processes, as described in the text. The solid lines represent the best fitting curves for each data set: τ(DS)HNmax,α and τ(NMR)min,α are described by the VFT equation (D = 2.6 ± 0.4, T0 = 41 ± 3 °C), whereas an Arrhenius equation fits τ(DS)HNmax,β (Eact = 11.1 ± 0.2 kcal mol−1). The vertical line marks the glass transition temperature. (b) Expansion of (a) for temperatures above Tg. The black line represents an extrapolation of τ(DS)HNmax,β to temperatures above Tg. | ||
For the α process, investigated between 76 and 116 °C, the parameter a increased upon heating from 0.65 to 0.75, whereas b was scattered in the range 0.45–0.60, and Δε tended to decrease from 1.9 to 1.7. Deviations of the DS peaks from the Debye behavior, that is peak broadening and asymmetry, were also observed by Funt in a PVB sample containing 12–13% of vinyl alcohol.11 The temperature dependence of τHNmax for the α process, τ(DS)HNmax,α, derived from τHN using eqn (4),39,40 was fitted according to the Vogel–Fulcher–Tammann (VFT) equation
 | (5) |
 | (6) |
3.2 1H FFC NMR relaxometry
Fig. 4a shows the 1H T1 dispersions acquired on the PVB film in the temperature range from 70 to 120 °C. At all temperatures and frequencies a single T1 value was obtained, as usually found for amorphous melt polymers, indicating that spin diffusion was effective. At Larmor frequencies >105 Hz, T1 values were strongly dependent on frequency and decreased with increasing temperature,46 while at frequencies <105 Hz and for temperatures above 90 °C, the T1 values reached a plateau, suggesting that the motions entered the extreme narrowing regime.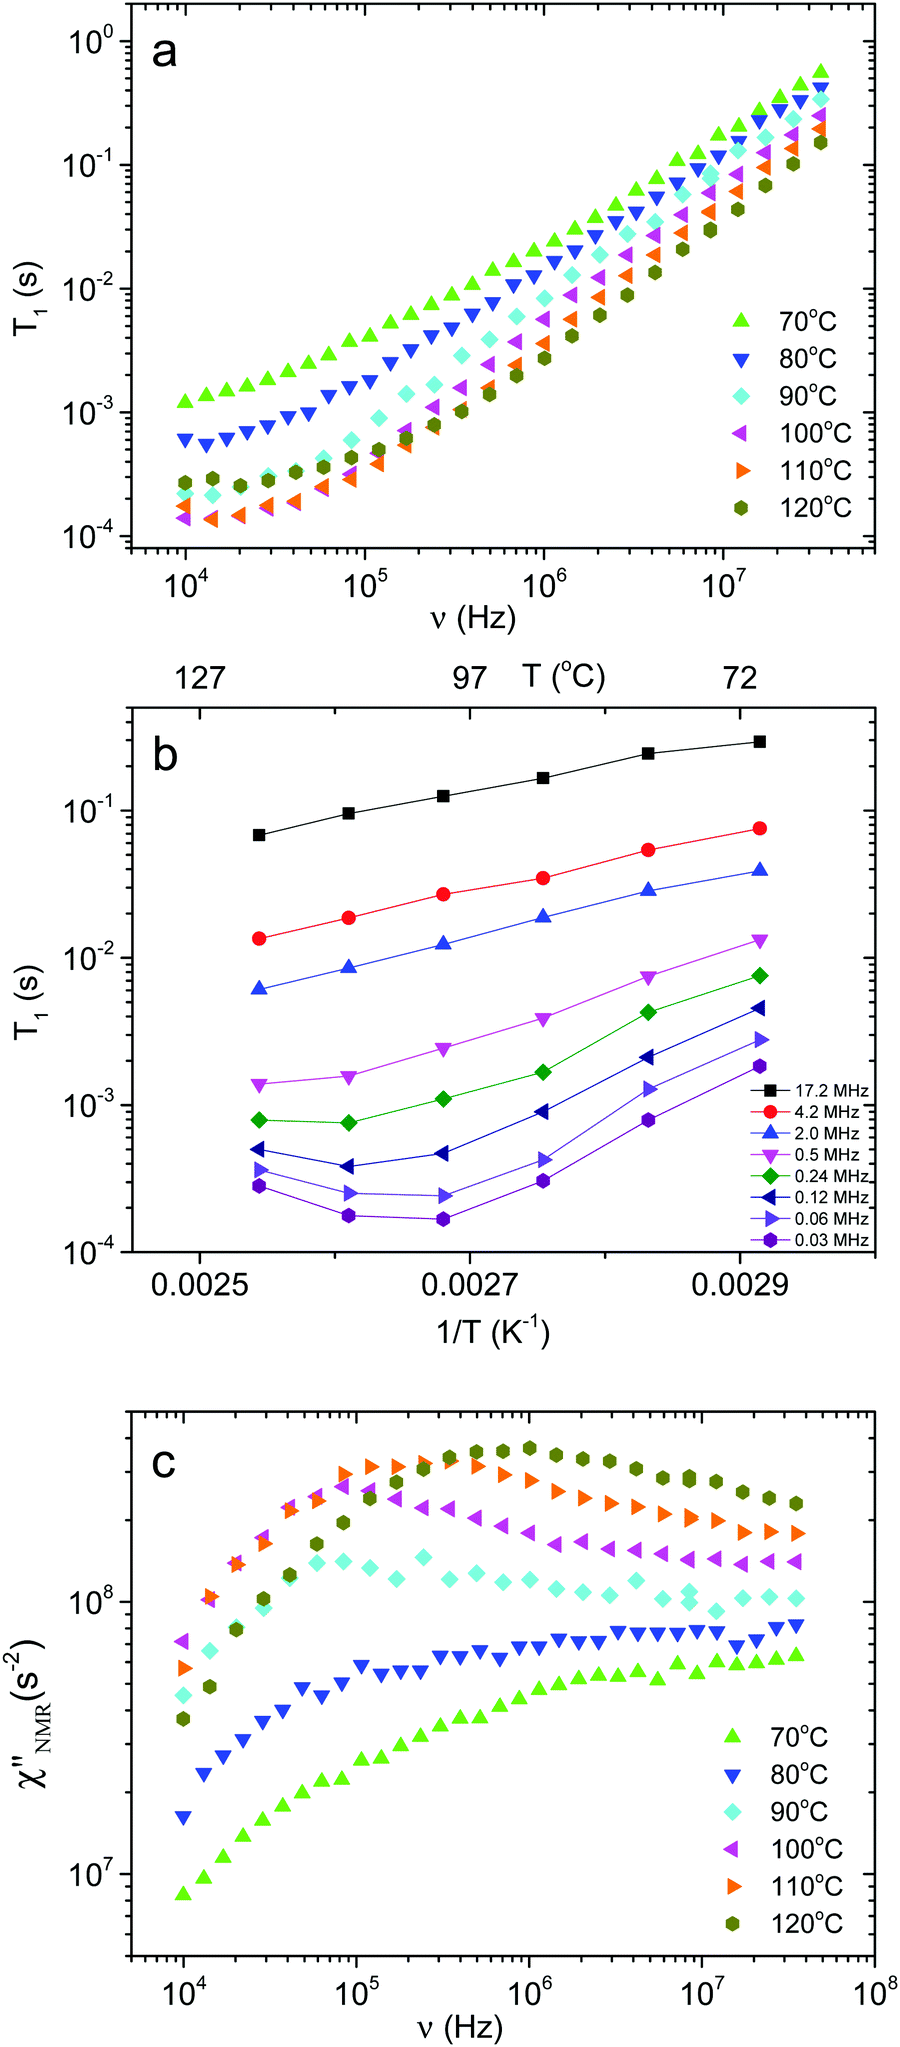 | ||
Fig. 4 (a) 1H T1 dispersions for PVB at different temperatures. (b) 1H T1vs. 1/T at selected Larmor frequencies for PVB (lines are drawn to guide the eyes). (c) 1H  dispersions for PVB at different temperatures. dispersions for PVB at different temperatures. | ||
T 1 trends as a function of the inverse absolute temperature (Fig. 4b) allowed the presence of dynamic processes contributing to proton relaxation in the investigated frequency range to be better identified. At frequencies <0.5 MHz, a minimum was clearly observed between 100 and 120 °C, which shifted to higher temperatures as the frequency was increased; at frequencies >0.5 MHz, only the “low” temperature side of the trend was observed. An estimate of the motional correlation time at the temperature corresponding to the minimum, τ(NMR)min, was obtained by the relationship 2πνminτ(NMR)min,α ≅ 0.616, where νmin indicates the frequency at which the minimum is observed. The derived τ(NMR)min,α values are reported in Fig. 3. Considering the DS findings, we can infer that the α process is responsible for the NMR minima, although the τ(NMR)min,α values are systematically shorter than the corresponding τ(DS)HNmax,α by a factor of about 3. This difference, also observed by other authors,26 may be ascribed to a diffusional process for which τDS = 3τNMR is theoretically predicted.47 It should be noticed that the τ(NMR)min,α values showed the same temperature dependence as τ(DS)HNmax,α.
In order to directly compare 1H FFC NMR and DS data, dispersions of “NMR susceptibility”, defined as  ,21 were used (Fig. 4c). In this representation the presence of peaks is related to the occurrence of dynamic processes governing relaxation in the investigated frequency range. For temperatures between 100 and 120 °C, the
  curves showed a distinct maximum ascribable to the α process which shifted to higher frequencies upon heating.
The amplitude of  decreased with decreasing temperature, indicating that FTS did not apply rigorously, and the high frequency side of the peaks was rather flat with respect to DS data (see Fig. S2 in the ESI,† where the shapes of ε′′ and
  curves acquired above Tg are directly compared after scaling the amplitude and the time scale). The amplitude decrease could be due to: (i) a broadening of the α relaxation peak upon cooling; (ii) the emergence of a secondary process associated with local motions of the main and/or side chains, such as the β relaxation process identified by DS measurements;26 (iii) a decrease in the proton fraction involved in the α relaxation with decreasing temperature (vide infra). The possible contribution of secondary relaxation processes could also account for the shape of the
  peaks on the high frequency side.
In order to elucidate the role of the factors determining the shape of  curves, these curves were analyzed on the basis of relaxation theory. Following Bloembergen, Purcell and Pound,
  can be associated with the spectral densities of motion, J(ν), by the equation:48,49
 | (7) |
 , with γ representing the proton gyromagnetic ratio and ΔM2 the reduction of the second moment caused by the motion.50,51 We considered conformational and segmental reorientation dynamics of proton pairs on the same segment, disregarding contributions arising from interactions between different segments on the same macromolecule, which are of lower magnitude,52 and used the HN function, JHN(ν) (eqn (3)), to express the associated spectral density.37 For PVB, 1H longitudinal relaxation is mainly determined by the reorientations of the inter-proton CH2 vector and, assuming isotropic motion, A* = 2.5 × 10⁹ s−2.
The experimental curves at 110 and 120 °C could be satisfactorily reproduced with a single HN function (see Fig. 5a and b), with a ∼ 1, b = 0.15, and Aα* equal to 2.0 × 10⁹ s−2 and 2.4 × 10⁹ s−2, respectively. The τ(NMR)HNmax,α values, derived from the best fit τHN using eqn (4), are in good agreement with τ(NMR)min,α (Fig. 3). For a = l, the HN equation reduces to the Davidson–Cole one, a function usually employed to model glassy dynamics of polymers. Departures of  trends from this function, observed at temperatures much higher than Tg, have been ascribed to contributions to relaxation arising from slower collective polymer dynamics.21,52–56 Hence, in our case the obtained values of a indicate that the collective dynamics does not significantly contribute to relaxation, most probably because the measurements were performed only up to 50 K above the glass transition. Since glassy dynamics is not influenced by the chain length,21 the polymer polydispersity is expected to play a minor role. The value of b was quite small and much smaller than those found by DS for the α process. Moreover, a single HN function could not satisfactorily reproduce the
  curve at 100 °C.
 | ||
Fig. 5 Experimental (circles) and calculated (black lines)  at the indicated temperatures. In (a and b) the at the indicated temperatures. In (a and b) the  curves are fitted with a single HN function with the parameter values reported in the text. In (c–h) the fitting functions result from the sum of the HN contributions associated with the β (blue line) and α (red line) relaxation processes. The fitting parameters are reported in Table 1. curves are fitted with a single HN function with the parameter values reported in the text. In (c–h) the fitting functions result from the sum of the HN contributions associated with the β (blue line) and α (red line) relaxation processes. The fitting parameters are reported in Table 1. | ||
The introduction of a second faster relaxation process, besides accounting for the observed FTS inapplicability, might also allow the  vs. frequency trends between 100 and 120 °C to be well reproduced with larger values of the b parameter for the HN function describing the α process. In this case, the NMR susceptibility can be written as:57,58
 | (8) |
 introduced in eqn (7). In eqn (8), the contribution of methyl protons to
  can be neglected since, at the investigated temperatures, the rotation about the C3 axis certainly occurs at frequencies much higher than those explored here (see the ESI†). The contribution of protons in “slow” segments, related to the occurrence of dynamic heterogeneity and revealed by us through FID analysis,29 can be safely neglected given their much longer T1. Indeed, dynamic heterogeneity has been reported for amorphous polymers up to a few tens of degrees above Tg.59,60
Since the  dispersions did not show features suitable for a univocal quantitative analysis in terms of two dynamic processes, we tentatively assumed that the secondary process was the β relaxation process detected by DS measurements. In particular, this process was modeled with the Cole–Cole function (bβ = 1) and the correlation times (τHN,β) were fixed to values extrapolated at the temperatures of interest according to the temperature dependence of τ(DS)HNmax,β (see the black line in Fig. 3b). On the basis of the preliminary fittings of the curves at 110 and 120 °C mentioned above, the α process was modeled with the Davidson–Cole function (aα = 1). With these assumptions, we could fit the experimental curves between 100 and 120 °C (Fig. 5c, d and f) with the parameters reported in Table 1. It must be noted that the fitting parameter Ai is equal to fi·Ai*. Interestingly, a combination of the α and β relaxation processes with the same assumptions on the parameters allowed the
  curves at 80 and 90 °C to be well reproduced (Fig. 5e and h); the curve at 70 °C could be satisfactorily described considering the sole β process (Fig. 5g). Also for these curves, the best fit parameters are reported in Table 1. The best fit correlation times for the α process were converted to the corresponding τ(NMR)HNmax,α; the obtained values, shown in Fig. 3, are in agreement with those derived from the T1 minima.
| T (°C) | A α (s−2) | τ HN,α (s) | a α | b α | A β (s−2) | τ HN,β (s) | a β | b β |
|---|---|---|---|---|---|---|---|---|
| a Fixed parameter. | ||||||||
| 70 | 3.7 × 10⁸ | 8.8 × 10⁻⁹ | 0.42 | 1 | ||||
| 80 | 6.4 × 10⁷ | 2.3 × 10⁻⁶ | 1 | 0.40 | 5.4 × 10⁸ | 5.6 × 10⁻⁹ | 0.37 | 1 |
| 90 | 3.6 × 10⁸ | 2.3 × 10⁻⁶ | 1 | 0.34 | 6.6 × 10⁸ | 3.6 × 10⁻⁹ | 0.30 | 1 |
| 100 | 8.0 × 10⁸ | 2.7 × 10⁻⁶ | 1 | 0.36 | 6.6 × 10⁸ | 2.4 × 10⁻⁹ | 0.40 | 1 |
| 110 | 1.2 × 10⁹ | 1.4 × 10⁻⁶ | 1 | 0.34 | 6.6 × 10⁸ | 1.6 × 10⁻⁹ | 0.42 | 1 |
| 120 | 1.3 × 10⁹ | 5.1 × 10⁻⁷ | 1 | 0.34 | 6.6 × 10⁸ | 1.1 × 10⁻⁹ | 0.46 | 1 |
Throughout the temperature range examined, no significant changes were found for the shape parameters bα and aβ. For the β process, the Aβ factor initially slightly increased with increasing temperature, reaching a constant value at 90 °C. The low limiting value compared to that expected for a methylene isotropic motion indicates that the β motion covers a restricted solid angle range, a feature expected for local motions. In the case of the α process, Aα increased in the whole temperature range, tending to a plateau at the highest temperatures. This trend can be accounted for considering that the fraction of protons involved in the α process, fα, increases with the temperature up to a limit value. In fact, the fraction of the “mobile” protons progressively increases with temperature above Tg at the expense of the rigid fraction. Dynamic heterogeneity with residual slow segments in an increasing rubbery matrix, with chain segments hierarchically entering the motional averaging regime, has been highlighted in other studies for temperatures up to Tg + 40 K.60 The same phenomenon may involve the protons subject to the β process, thus justifying the initial increase of Aβ. The limiting value of Aα is compatible with an isotropic motion involving the CH2 groups on the main chain, for which a molar fraction of about 0.6 is estimated on the basis of the polymer composition.
On the basis of this analysis, we can state that the β process detected using DS is relevant also for NMR relaxation in the high frequency range, where motions of the CH2 groups in the propyl side chains could also contribute.
4. Conclusions
The dynamics of PVB, including motions of the main chain and of the side groups, was studied across the glass transition acquiring information from both DS and FFC relaxometry.Above Tg, a primary process (α relaxation) due to segmental motions of the polymer chain was quantitatively characterized by DS measurements, covering wide temperature and frequency ranges on which FTS was found to apply. The analysis of DS data provided information on the change of the dynamic properties at the glass transition and, therefore, on the fragility of glassy PVB, exploiting the VFT equation. The α process was also detected using 1H FFC NMR, which provided correlation times in agreement with those determined using DS data analysis.
In the glassy state, a secondary process (β relaxation) associated with local motions of the chains inducing reorientations of the vinyl alcohol dipoles was clearly observed using DS, with an energy barrier of 11.1 ± 0.2 kcal mol−1. 1H FFC NMR relaxometry data, acquired above Tg, were consistent with the occurrence of this β process, contributing to relaxation in the high frequency side of the investigated range. Nevertheless, propyl side chain motions, to which DS is not sensitive, could also concur to relaxation in the same frequency region. We safely excluded the relevance of the methyl motion for relaxation at the investigated temperatures and frequencies.
From a methodological point of view, we can state that, for PVB, characterized by a complex structure and a rather high Tg, DS has revealed to provide dynamic information more straightforwardly with respect to 1H FFC NMR. In fact, at temperatures close to Tg, the interpretation of 1H FFC data may be complicated by incomplete motional narrowing and by spin diffusion between protons in dynamically different domains. Nonetheless, 1H FFC NMR could grant additional information if suitable strategies are adopted. In particular, the use of instrumentation allowing measurements at temperatures higher than 120 °C could give access to detailed information on segmental and collective motions. Furthermore, the investigation of PVB samples selectively labeled with deuterium on different methylene groups, planned in our laboratory, is expected to allow the different contributions of main and side chains to the relaxation to be unraveled.
Conflicts of interest
There are no conflicts of interest to declare.Acknowledgements
We thank C. De Monte (IPCF-CNR, Pisa) and M. Onor (ICCOM-CNR, Pisa) for technical assistance and S. Capaccioli (University of Pisa) for enlightening discussions. This work was partially supported by the Tuscany Region in the framework of the project SELFIE (Bando FAR-FAS 2014-Programma PAR FAS 2007–2013-Linea d’Azione 1.1). We are grateful to Beneficentia Stiftung for supporting the acquisition of our FFC relaxometer.References
- L. C. K. Liau and D. S. Viswanath, Ind. Eng. Chem. Res., 1998, 37, 49 CrossRef CAS.
- V. M. Boddu, D. S. Viswanath, G. Natarajan and J. V. Knickerbocker, J. Am. Ceram. Soc., 1990, 73, 1620 CrossRef.
- C. Carrot, A. Bendaoud and C. Pillon, in Handbook of Thermoplastics, ed. O. Olabisi and K. Adewale, CRC Press, Taylor & Francis Group, Boca Raton, 2nd edn, 2016, ch. 3 Search PubMed.
- E. Corroyer, M.-C. Brochier-Salon, D. Chaussy, S. Wery and M. Naceur Belgacem, Int. J. Polym. Anal. Charact., 2013, 18, 346 CrossRef CAS.
- A. K. Dhaliwal and J. N. Hay, Thermochim. Acta, 2002, 391, 245–255 CrossRef CAS.
- P. A. Hooper, B. R. K. Blackman and J. P. Dear, J. Mater. Sci., 2012, 47, 3564 CrossRef CAS.
- L. Andreozzi, S. Briccoli Bati, M. Fagone, G. Ranocchiai and F. Zulli, Constr. Build. Mater., 2014, 65, 1 CrossRef.
- L. Andreozzi, S. Briccoli Bati, M. Fagone, G. Ranocchiai and F. Zulli, Constr. Build. Mater., 2015, 98, 757 CrossRef.
- S. Arayachukiat, M. Siriprumpoonthum, S. Nobukawa and M. Yamaguchi, J. Appl. Polym. Sci., 2014, 131, 40337 CrossRef.
- Y. Takahashi, J. Phys. Soc. Jpn., 1961, 16, 1024 CrossRef CAS.
- B. L. Funt, Can. J. Chem., 1952, 30, 84 CrossRef CAS.
- P. C. Mehendru, K. Jain and N. Kumar, Thin Solid Films, 1980, 70, 7 CrossRef CAS.
- P. C. Mehendru, N. Kumar, V. P. Arora and N. P. Gupta, J. Chem. Phys., 1982, 77, 4232 CrossRef CAS.
- G. R. Saad, E. El-Shafee and M. W. Sabaa, Polym. Degrad. Stab., 1995, 47, 209 CrossRef CAS.
- U. A. Handge, M. F. H. Wolff, V. Abetz and S. Heinrich, Polymer, 2016, 82, 337 CrossRef CAS.
- J. Schaefer, J. R. Garbow, E. O. Stejskal and J. A. Lefelar, Macromolecules, 1987, 20, 1271 CrossRef CAS.
- A. A. Parker, J. J. Marcinko, Y. T. Shieh, C. Shields, D. P. Hedrick and W. M. Ritchey, Polym. Bull., 1989, 21, 229 CrossRef CAS.
- A. A. Parker, D. P. Hedrick and W. M. Ritchey, J. Appl. Polym. Sci., 1992, 46, 295 CrossRef CAS.
- A. Schönhals and F. Kremer, in Broadband Dielectric Spectroscopy, ed. F. Kremer and A. Schönhals, Springer-Verlag, Berlin, 2003 Search PubMed.
- R. Kimmich and E. Anoardo, Prog. Nucl. Magn. Reson. Spectrosc., 2004, 44, 257 CrossRef CAS.
- D. Kruk, A. Herrmann and E. A. Rössler, Prog. Nucl. Magn. Reson. Spectrosc., 2012, 63, 33 CrossRef CAS PubMed.
- B. Kresse, M. Becher, A. F. Privalov, M. Hofmann, E. A. Rössler, M. Vogel and F. Fujara, J. Magn. Reson., 2017, 277, 79 CrossRef CAS PubMed.
- R. C. Ball, P. T. Callaghan and E. T. Samulski, J. Chem. Phys., 1997, 106, 7352 CrossRef CAS.
- P. T. Callaghan and E. T. Samulski, Macromolecules, 1998, 31, 3693 CrossRef CAS.
- R. Kimmich and N. Fatkullin, Adv. Polym. Sci., 2004, 170, 1 CAS.
- R. Meier, R. Kahlau, D. Kruk and E. A. Rössler, J. Phys. Chem. A, 2010, 114, 7847 CrossRef CAS PubMed.
- R. Meier, D. Kruk and E. A. Rössler, ChemPhysChem, 2013, 14, 3071 CrossRef CAS PubMed.
- M. D. Fernández, M. J. Fernández and P. Hoces, J. Appl. Polym. Sci., 2006, 102, 5007 CrossRef.
- S. Pizzanelli, C. Forte, S. Bronco, T. Guazzini, C. Serraglini and L. Calucci, in preparation.
- T. E. Siebert, H. E. Smyth, D. L. Capone, C. Neuwöhner, K. H. Pardon, G. K. Skouroumounis, M. J. Herderich, M. A. Sefton and A. P. Pollnitz, Anal. Bioanal. Chem., 2005, 381, 937 CrossRef CAS PubMed.
- The software is freely available at http://grafitylabs.com/.
- P. J. Sebastiaõ, Fitteia. Fitting Environment Interfaces for All. http://fitteia.org (date last accessed: July 14, 2017).
- P. J. Sebastiaõ, Eur. J. Phys., 2014, 35, 015017 CrossRef.
- S. Havriliak and S. Negami, J. Polym. Sci., Part C: Polym. Symp., 1966, 14, 99 CrossRef.
- L. A. Dissado and R. M. Hill, Nature, 1979, 279, 685 CrossRef CAS.
- L. A. Dissado and R. M. Hill, Philos. Mag. B, 1980, 41, 625 CAS.
- P. A. Beckmann, Phys. Rep., 1988, 171, 85 CrossRef.
- M. Vogel, P. Medick and E. A. Rössler, Annu. Rep. NMR Spectrosc., 2005, 56, 231–298 CrossRef CAS.
- A. Boersma, J. van Turnhout and M. Wübbenhorst, Macromolecules, 1998, 31, 7453 CrossRef CAS.
- C. J. F. Böttcher and P. Bordewijk, Theory of Electric Polarization, vol. 2: Dielectrics in time-dependent fields, Elsevier Science B.V., Amsterdam, 1978 Search PubMed.
- K.-I. Shida and Y. Wada, J. Appl. Polym. Sci., 1966, 10, 1483 CrossRef CAS.
- I. Cendoya, D. López, A. Alegría and C. Mijangos, J. Polym. Sci., Part B: Polym. Phys., 2001, 39, 1968–1975 CrossRef CAS.
- N. G. McCrum, B. E. Read and G. Williams, Anelastic and Dielectric Effects in Polymeric Solids, John Wiley & Sons, London, 1967, ch. 9 Search PubMed.
- R. Boehmer and C. A. Angell, Phys. Rev. B: Condens. Matter Mater. Phys., 1992, 45, 10091 CrossRef CAS.
- K. Kunal, C. G. Robertson, S. Pawlus, S. F. Hahn and A. P. Sokolov, Macromolecules, 2008, 41, 7232 CrossRef CAS.
- S. Kariyo and S. Stapf, Macromol. Chem. Phys., 2005, 206, 1300 CrossRef CAS.
- A. Abragam, The Principles of Nuclear Magnetism, Oxford University Press, Oxford, 1961, p. 299 Search PubMed.
- N. Bloembergen, E. M. Purcell and R. V. Pound, Phys. Rev., 1948, 73, 679 CrossRef CAS.
- R. Kubo and K. Tomita, J. Phys. Soc. Jpn., 1954, 9, 888 CrossRef CAS.
- E. C. Reynhardt and L. Latanowicz, Chem. Phys. Lett., 1996, 251, 235 CrossRef CAS.
- J. Jenczyk, M. Dobies, M. Makrocka-Rydzyk, A. Wypych and S. Jurga, Eur. Polym. J., 2013, 49, 3986 CrossRef CAS.
- N. Fatkullin, A. Gubaidullin and S. Stapf, J. Chem. Phys., 2010, 132, 094903 CrossRef CAS PubMed.
- R. Kimmich, N. Fatkullin, R.-O. Sitter and K. Gille, J. Chem. Phys., 1998, 108, 2173 CrossRef CAS.
- M. Kehr, N. Fatkullin and R. Kimmich, J. Chem. Phys., 2007, 126, 094903 CrossRef PubMed.
- M. Kehr, N. Fatkullin and R. Kimmich, J. Chem. Phys., 2007, 127, 084911 CrossRef PubMed.
- M. Hofmann, B. Kresse, A. F. Privalov, L. Willner, N. Fatkullin, F. Fujara and E. A. Rössler, Macromolecules, 2014, 47, 7917 CrossRef CAS.
- G. Voigt and R. Kimmich, Polymer, 1980, 21, 1001 CrossRef CAS.
- J. E. Anderson and W. P. Slichter, J. Phys. Chem., 1965, 69, 3099 CrossRef CAS.
- U. Tracht, M. Wilhelm, A. Heuer, H. Feng, K. Schmidt-Rohr and H. W. Spiess, Phys. Rev. Lett., 1998, 81, 2727 CrossRef CAS.
- K. Schäler, M. Roos, P. Micke, Y. Golitsyn, A. Seidlitz, T. Thurn-Albrecht, H. Schneider, G. Hempel and K. Saalwächter, Solid State Nucl. Magn. Reson., 2015, 72, 50 CrossRef PubMed.
Footnote |
| † Electronic supplementary information (ESI) available. See DOI: 10.1039/c7cp02595e |
| This journal is © the Owner Societies 2017 |