 Open Access Article
Li-ion diffusion in Li intercalated graphite C6Li and C12Li probed by μ+SR
Izumi
Umegaki
 *a,
Shigehiro
Kawauchi
a,
Hiroshi
Sawada
a,
Hiroshi
Nozaki
a,
Yuki
Higuchi
a,
Kazutoshi
Miwa
a,
Yasuhito
Kondo
a,
Martin
Månsson
b,
Mark
Telling
c,
Fiona C.
Coomer
c,
Stephen P.
Cottrell
c,
Tsuyoshi
Sasaki
a,
Tetsuro
Kobayashi
a and
Jun
Sugiyama
a
aToyota Central R&D Laboratories, Inc., Nagakute, Aichi, 480-1192, Japan. E-mail: umegaki@mosk.tytlabs.co.jp; Fax: +81-561-63-6448; Tel: +81-561-71-8111
bDepartment of Materials and Nanophysics, KTH Royal Institute of Technology, Electrum 229, SE-16440 Kista, Sweden
cISIS Muon Facility, Rutherford Appleton Laboratory, Didcot, Oxfordshire, OX11 0QX, UK
First published on 12th July 2017
Abstract
In order to study a diffusive behavior of Li+ in Li intercalated graphites, we have measured muon spin relaxation (μ+SR) spectra for C6Li and C12Li synthesized with an electrochemical reaction between Li and graphite in a Li-ion battery. For both compounds, it was found that Li+ ions start to diffuse above 230 K and the diffusive behavior obeys a thermal activation process. The activation energy (Ea) for C6Li is obtained as 270(5) meV, while Ea = 170(20) meV for C12Li. Assuming a jump diffusion of Li+ in the Li layer of C6Li and C12Li, a self-diffusion coefficient DLi at 310 K was estimated as 7.6(3) × 10−11 (cm2 s−1) in C6Li and 14.6(4) × 10−11 (cm2 s−1) in C12Li.
1 Introduction
1.1 Li intercalated graphites
Graphite1 is the most common material for Li-ion batteries,2 because of its high rechargeable capacity, low voltage, high cycle performance, and relatively low cost. During a charge (discharge) reaction in the Li-ion batteries, Li+ ions are intercalated into (deintercalated from) graphite.Fig. 1 illustrates schematic structures of three Li intercalated graphites (LIG), namely, graphite, C12Li, and C6Li, where C6Li corresponds to the structure for a fully charged state. The structure of LIG is an alternating stack along the c-axis with a graphene layer (G) and Li layer (L). That is, C12Li is represented as GGLGGL, whereas C6Li as LGLG. Such a structure is usually called a stage structure and the stage number (n) is defined as the number of graphene layers between two adjacent Li layers.
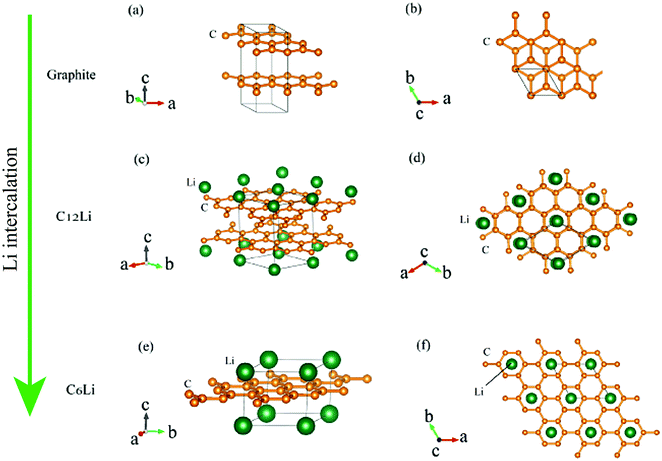 | ||
| Fig. 1 The crystal structure of (a) and (b) graphite, (c) and (d) C12Li, and (e) and (f) C6Li. (b, d, and f) Show a c-axis view of graphite, C12Li, and C6Li, in which Li locates at the center of six-member rings of carbon. The structures were drawn with VESTA.3 | ||
In the c plane of C12Li, and C6Li, one third of the centers of six-member carbon rings are occupied by Li ions, leading to the formation of a  super lattice structure [Fig. 1(d) and (f)]. The structural parameters of graphite, C12Li, and C6Li are summarized in Table 1. Note that, although the c-axis length changes with n, the a-axis length is independent of n for C12Li, and C6Li.
1.2 Motivation for measuring Li diffusion
Li diffusion in solids is one of the most important parameters to determine the charge and discharge rate of the Li-ion batteries. Particularly, we have the following two motivations to measure a diffusion coefficient of Li+ (DLi) in LIG with muon spin relaxation (μ+SR).• Intrinsic DLi
Since Li+ ions are thought to diffuse very rapidly in the LIG lattice due to the layered structure, many researchers have believed that DLi in LIG is larger than that in the positive electrode materials, such as, LixCoO2,6 LixNiO2,7 LixFePO4,8,9 and (LixCo1/3Ni1/3Mn1/3)O2.10 However, according to recent Li-NMR measurements on C6Li, DLi was reported as 3.8 × 10⁻¹¹ cm2 s−1 (= 3.8 × 10⁻⁴ m2 s−1) at 314 K,11 which ranges roughly in the same order of DLi in LixCoO2. Although there are many reports on DLi in LIG with electrochemical techniques, which provide property in a device or setup, not property intrinsic for LIG itself. It is very difficult to determine the intrinsic DLi with such techniques due to the lack of information on the correct reaction surface area of the LIG electrode in a liquid electrolyte.10
On the contrary, μ+SR is known to provide a very reasonable DLi for several positive electrode materials.6–10,12,13 This is because μ+SR “sees” the change in local magnetic environments due to Li diffusion. As a result, we obtain intrinsic DLi in battery materials. Therefore, we have attempted to investigate a diffusive behavior in LIG with μ+SR.
• In operando measurements in the near future
For the present Li-NMR and μ+SR measurements, battery materials have to be removed from a battery. However, it is highly preferable to observe the diffusive behavior both in positive electrode and anode as a function of the state of charge (SOC). In other words, we need to measure DLi of battery materials in a living battery in an in operando manner.14,15
Fortunately, the range of the surface muons, which is the most common muon beam in the muon facilities in the world, is about 150 mg cm−2 (= 1.5 kg m−2). Based on a simple Montecarlo simulation,16 such surface muons stop in a LixCoO2 electrode with 50 μm thickness through an aluminum plate with 630 μm thickness. This means that we can measure DLi of electrode materials in functioning Li-ion batteries in the near future. For such a purpose, we also have to initiate measurement of DLi in negative electrode materials with μ+SR.
Here, we report the μ+SR results on LIG with two different stage structures, that is, C12Li, and C6Li. Particularly, in order to apply to in operando measurements in the near future, we have not used pure LIG material but an negative electrode sheet, for which the mixture of LIG and binder (PVdF) is coated on the Cu foil.
2 Experimental
2.1 Fabrication of test cell
In order to prepare C6Li (C12Li), a graphite half (pouch) cell was fabricated with graphite and Li metal as electrodes. At first, a graphite electrode sheet was prepared by casting the slurry, which consists of 95% of artificial graphite (OMAC, Osaka Gas Chemicals Co., Ltd) and 5 wt% of polyvinylidene fluoride in the N-methyl 2-pyrrolidone solvent, onto a Cu foil with 10 μm thickness. Then, the electrode sheet was dried and pressed so as to reduce the thickness down to 82 μm and increase the areal density up to 9.89 mg cm−2. And then, the pouch cell was assembled in an Ar-filled glove box. The electrolyte was 1 M LiPF6 dissolved in ethylene carbonate (EC) and diethyl carbonate (DEC) (3/7 v/v) solution.2.2 Electrochemical preparation
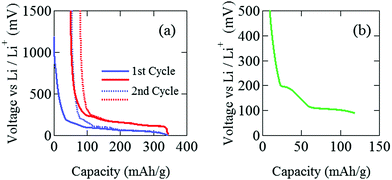
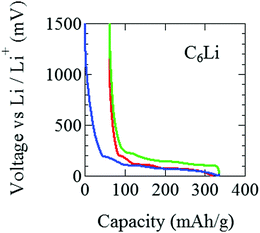
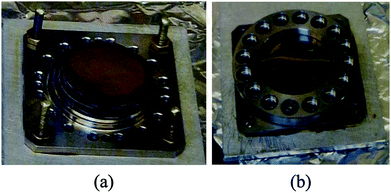
The pouch cell was charged and discharged under a constant current condition at 0.04 C in the voltage (E) range between 0 and 1500 mV. Note that 1 C means the charge (discharge) rate from empty (full) to full (empty) with one hour. The current and the current density were 3 mA and 0.2 mA cm−2. Electrochemical measurements were performed at 25 °C by an electrochemical analyzer (ACD-01, Aska Electronic co., Ltd) to determine the initial capacity. Fig. 2(a) shows initial charge and discharge cycles, where Li+ ions are intercalated into the graphite when E decreases, while Li+ ions are deintercalated from the graphite when E increases. After the initial two cycles, the pouch cell was discharged down to E = 88 mV [Fig. 2(b)], which is estimated as E for C12Li in Open Circuit Voltage measurements. Then, E was kept at 88 mV to obtain a homogeneous C12Li sheet.For C6Li, after the initial one cycle between 1500 mV and 5 mV (Fig. 3), the test cell was discharged to E = 5 mV and wrapped with an aluminum foil so as to achieve E = 0 V and kept for a week. The color of the obtained C6Li was typical golden yellow [Fig. 4(a)] and E was lower than 1 mV. From now on, we call the charged electrode C6Li and/or C12Li sheet. The composition of C6Li and C12Li was confirmed by the ICP-OES technique (CIROS 120EOP, Rigaku).
2.3 μ+SR
The C6Li and C12Li sheets were removed from the pouch cells, rinsed with dimethyl carbonate (DMC) solvent, and then dried for 20 minutes. Then, eight sheets were packed in a gold O-ring sealed titanium (Ti) cell (see Fig. 4), because LIG is very sensitive to moisture in the air. The surface muons penetrate a Ti window with 50 μm thickness, but stop into the sheets with 82 × 8 μm thickness.The μ+SR experiments were performed on the EMU17 surface muon beam line at ISIS of Rutherford Appleton Laboratory in U.K. In order to know a small change in an internal nuclear magnetic field due to Li-diffusion, the μ+SR spectra were measured in zero field (ZF), a weak longitudinal field (LF), and a weak transverse field (wTF) in the temperature (T) range between 50 and 500 K using a cryo-oven. The sample in the Ti-cell was mounted on the Cu holder of the cryo-oven, which is cooled down to around 10 K with a closed cycle refrigerator and heated up to around 600 K without setup change.
μ+SR is a common technique for investigating magnetic properties in solids through a direct measurement of an internal magnetic field (Hint), particularly in condensed matter physics.18,19 Recently, μ+SR also becomes popular in materials science,6,20,21 because ion diffusion in solids was detected with μ+SR from a small deviation of Hint caused by a dynamic behavior of ions.6,10,12,22–25 More correctly, Hint is observed through the muon spin depolarization function of time [P(t)]. Here, the initial muon spin at t = 0 is perfectly antiparallel to its momentum due to parity violation of weak interaction, i.e. P(0) = 1. P(t) is obtained by counting a number of decay positrons (e+) using scintillation counters, because e+ is emitted preferably along the direction of the muon spin, when the muon decays. The experimental technique of μ+SR is described elsewhere.18,19 The detailed explanation how to detect ion diffusion in solids with μ+SR is given elsewhere.6,10,12
The implanted muons naturally stop both in LIG and the Cu collector in our arrangement mentioned above. Since the fraction of the implanted muons stopped in each phase of a sample is proportional to a volume fraction of each phase, a μ+SR spectrum provides mainly two components corresponding to LIG and the Cu collector. Thus, the μ+SR spectra for the Cu foil were also measured using the same setup as that for the LIG sheet, while twelve Cu foil sheets were placed into the Ti-cell.
3 Results
3.1 C6Li
Fig. 5(a) shows the ZF- and LF-μ+SR time spectra for the C6Li sheets recorded at 50 K. The spectra clearly indicate that the internal magnetic field (Hint) detected by μ+ is static. Since the applied LF = 10 Oe (= 10![[thin space (1/6-em)]](https://www.rsc.org/images/entities/char_2009.gif) 000/4π A m−1) significantly suppresses a relaxation due to Hint,26 the magnitude of Hint ranges around 10 Oe and matches the nuclear magnetic field mainly caused by the nuclear moments of 6Li, 7Li, 63Cu, and 65Cu. However, the ZF-μ+SR spectrum becomes dynamic with increasing temperature and finally exhibits a small relaxation at 370 K [see Fig. 5(b)]. This means that the distribution of Hint becomes homogeneous at high temperatures due to Li-diffusion, as in the case for the other electrode materials.
000/4π A m−1) significantly suppresses a relaxation due to Hint,26 the magnitude of Hint ranges around 10 Oe and matches the nuclear magnetic field mainly caused by the nuclear moments of 6Li, 7Li, 63Cu, and 65Cu. However, the ZF-μ+SR spectrum becomes dynamic with increasing temperature and finally exhibits a small relaxation at 370 K [see Fig. 5(b)]. This means that the distribution of Hint becomes homogeneous at high temperatures due to Li-diffusion, as in the case for the other electrode materials.
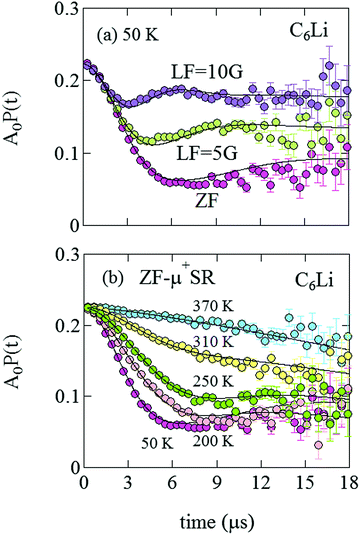 | ||
| Fig. 5 (a) ZF- and LF-μ+SR time spectra for C6Li measured at 50 K. The magnitude of LF was 5 and 10 Oe. (b) The temperature variation of the ZF-μ+SR spectrum from 50 to 370 K. | ||
In order to extract Hint in LIG, the ZF- and LF-μ+SR spectra of the sheet were fitted by a combination of two dynamic Gaussian Kubo-Toyabe (KT) functions (GDGKT)27 and a time-independent offset signal. Here, the two KT components correspond to the signals from C6Li and the Cu foil, and the offset component comes from the muons stopped in the Ti-cell;
| A0P(t) = AC6LiGDGKT(ΔC6Li,νC6Li,t) + ACuGDGKT(ΔCu,νCu,t) + ABG. | (1) |
Fig. 6 shows the temperature dependences of ΔCu and νCu estimated by fitting the ZF- and LF-μ+SR spectra for the Cu foil with eqn (1) but AC6Li = 0. Both the ΔCu(T) and νCu(T) curves exhibit a typical μ+ diffusion behavior in a metal, in which μ+ does not make a stable bond with negative ions, above around 125 K. That is, as temperature increases from 50 K, ΔCu, which corresponds to a spin–spin relaxation rate (1/T2), is temperature independent up to around 125 K, and then starts to decrease with further increasing temperature, and finally becomes almost 0 above around 300 K. Such behavior is well known as a motional narrowing. Also, νCu, which corresponds to a spin–lattice relaxation rate (1/T1), increases with increasing temperature, and reaches a maximum at around 200 K, then rapidly decreases with further increasing temperature, and becomes 0 above 350 K. Here, νCu indicates the hopping rate of μ+, and above 200 K, the hopping rate is too fast to be detected by μ+SR. Although this muon diffusion can be also described by the behavior of the fixed Δ and increasing ν,49 we dared not to fix Δ in order to exhibit that the internal magnetic field due to the nuclear magnetic moments of Cu seems to decrease with increasing temperature from diffusing muons.
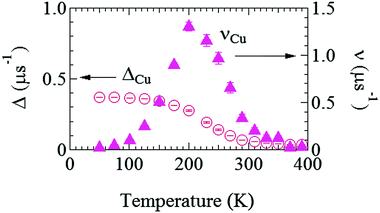 | ||
| Fig. 6 The temperature dependences of field distribution width (ΔCu) (left) and field fluctuation rate (νCu) (right) of the Cu foil. The data were obtained by fitting the μ+SR spectra for the Cu foil with eqn (1) but AC6Li = 0. | ||
Using these values for the ACu signal in the C6Li sheet, both ΔC6Li and νC6Li were successfully determined at each temperature with common AC6Li, ACu, and ABG, namely, AC6Li = 0.111(2), ACu = 0.068(2), and ABG = 0.041(1). Since Ai is roughly proportional to the volume fraction (VF) of i-th phase, VF of C6Li is estimated as 58% and that of Cu as 42% in the anode sheet. Such estimation is comparable with VF calculated from the thickness of the graphite layer and Cu foil in the sheet, that is, 53% and 47%.
Fig. 7(a) and (b) show the temperature dependences of ΔC6Li and νC6Li, which also exhibit a motional narrowing behavior above ∼230 K. The origin of such behavior is naturally thought to be either μ+ diffusion or Li+ diffusion. Note that very similar behavior was also reported with the past ZF-μ+SR measurements on C6Li.28 Furthermore, since Li-NMR shows a motional narrowing behavior above ∼240 K,11 the diffusive behavior detected with μ+SR is most likely caused by Li-diffusion. In fact, first principles calculations predicts that the implanted μ+ makes a bond with C, and as a result, μ+ is more stable than Li+ in the C6Li lattice, as described later.
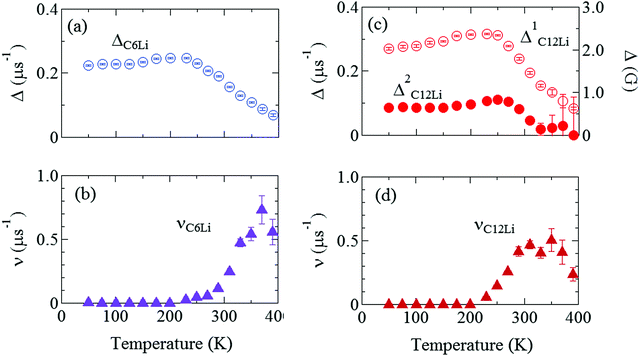 | ||
Fig. 7 The temperature dependences of the μ+SR parameters for C6Li and C12Li; (a) the field distribution width for C6Li (ΔC6Li), (b) field fluctuation rate for C6Li (νC6Li), (c) field distribution widths for C12Li  , and (d) field fluctuation rate for C12Li (νC12Li). The data were obtained by fitting the μ+SR spectra for C6Li with eqn (1) [for C12Li with eqn (2)]. , and (d) field fluctuation rate for C12Li (νC12Li). The data were obtained by fitting the μ+SR spectra for C6Li with eqn (1) [for C12Li with eqn (2)]. | ||
3.2 C12Li
Fig. 8(a) shows the ZF- and LF-μ+SR spectra for the C12Li sheets recorded at 50 K. The spectra also indicate a KT type relaxation caused by the nuclear moments of Li and Cu, as in the case for C6Li. The temperature variation of the ZF-μ+SR spectrum is similar to C6Li (Fig. 5) too. However, in order to fit these spectra, we need an additional KT signal, i.e. | (2) |
 and
and  (i = 1, 2) are asymmetries and field distribution width for the two KT signals. Note that the νC12Li is common for the two AC12Li signals. The fit provided that
  = 0.0399(4),
  = 0.0539(7), ACu = 0.0657(7), and ABG = 0.0645, respectively. Thus, VFs of the two KT signals from C12Li were estimated as 25% and 34%, and that of Cu foil as 49% in the C12Li sheet. These values are also comparable with the calculated VF, that is, 53% for graphite and 47% for Cu.
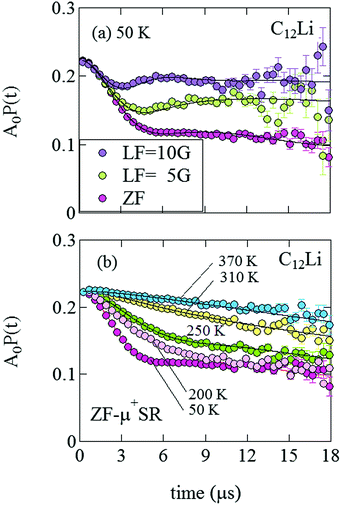 | ||
| Fig. 8 (a) The ZF- and LF-μ+SR time spectra for C12Li measured at 50 K. The magnitude of LF was 5 and 10 Oe. (b) The temperature variation of the ZF-μ+SR spectrum from 50 to 370 K. | ||
Fig. 7(c) and (d) show the temperature dependences of  (i = 1, 2) and νC12Li for C12Li. As temperature increases from 50 K, both
  (i = 1, 2) are almost temperature independent (or slightly increases) up to 230 K, then they start to decrease above 250 K, and decrease monotonically with temperature. On the other hand, νC12Li is eventually zero up to ∼230 K, but νC12Li starts to increase further with increasing temperature, reaches a maximum around 350 K, and then decreases with further increasing temperature. This behavior is very similar to that of C6Li, implying of the occurrence of Li diffusion above 230 K. Since
  (50 K) ∼ 3 ×
  (50 K), the second muon site in the C12Li lattice is most to be likely far away from the Li layer.
It should be noted that  (50 K) is almost equivalent to ΔC6Li (50 K). This suggests that the local environment at μ+ in C6Li is very similar to that in C12Li. It should be also emphasized that the number of muons implanted into the C6Li (C12Li) sample is so small (105 s−1)29 that we can ignore the interaction between μ+ s.
4 Discussion
4.1 Muon site
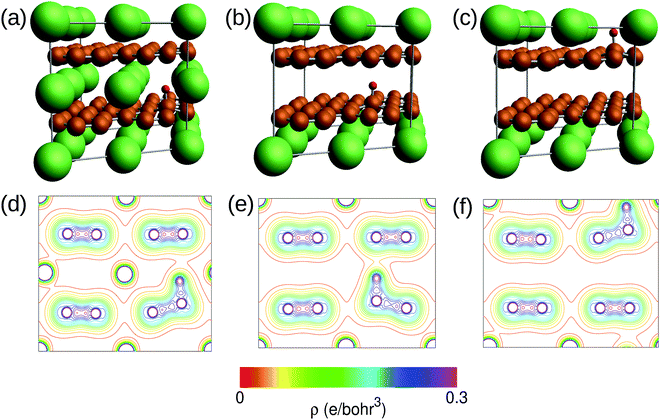
Prior to the discussion of the Experimental data, we need to know the muon site(s) and situation in the C6Li and C12Li lattices. First principles calculations based on density functional theory30,31 revealed that the implanted μ+ forms a stable bond with C in the graphene layer like a C–H bond with sp3 orbital hybridization [Fig. 10(d)] and, as a result, sits at = (0.35, 0.37, 0.08). The same calculations for C12Li indicated that there are two stable muon sites, namely, at
  = (0.37, 0.37, 0.04) in the Li layer and at
  = (0.67, 0.66, 0.47) in the graphene layer. μ+ s at both sites also form a stable C–μ bond [Fig. 10(e) and (f)], as in C6Li.
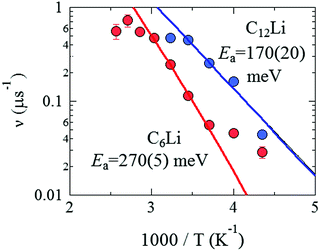 | ||
| Fig. 9 The relationship between ν and inverse temperature for C6Li and C12Li. The solid lines represent the best fit using eqn (3) with Ea = 270 ± 5 meV for C6Li in the temperature range between 270 and 330 K and Ea = 170 ± 20 meV for C12Li in the temperature range between 230 and 290 K. | ||
Details of the calculations are described in Appendix. Consequently, these results demonstrate that μ+ is more stable than Li+ in both C6Li and C12Li lattice and support that the extracted ν from the μ+SR data corresponds to the hopping rate of Li+.
The predicted muon sites and Δ, which was given by dipole field calculations with DipElec,32 are summarized in Table 2. It is found that the calculated results are qualitatively consistent with the experimental results. Note that, since the dipole field calculations provide Δcal at 0 K without thermal vibration, Δcal is usually larger than Δmea.33 The fact that Δcal ∼ 2/3Δmea only for  would imply either an insufficient accuracy of the DFT calculations, a limited time window of μ+SR, or the presence of imperfection in the samples. For the second factor, if Δ < 0.65 Oe, we need to measure the μ+SR spectrum until 25 μs to estimate Δ. However, such measurements are eventually impossible due to a lifetime of μ (∼2.2 μs).
4.2 Temperature dependence of ν
In order to compare ν for C6Li with that for C12Li, Fig. 9 shows νC6Li and νC12Li as a function of inverse temperature (1/T). When ν is caused by Li-diffusion, a thermal activation process is naturally applicable for explaining the temperature dependence, i.e.ν = ν0![[thin space (1/6-em)]](https://www.rsc.org/images/entities/char_2009.gif) exp(−Ea/kBT) + νBG, exp(−Ea/kBT) + νBG, | (3) |
From the linear relationship between log(ν) and 1/T, Ea is estimated as 270(5) meV for C6Li in the T range between 270 and 310 K and 170(20) meV for C12Li in the T range between 230 and 290 K. Such a difference in Ea is probably caused by the strength of an interlayer interaction with Li+ ions in the adjacent Li layers.
4.3 Temperature dependence of Δ
As described in Sections 3.1 and 3.2, ΔC6Li and ΔC12Li are roughly temperature independent below 230 K, at which Li+ ions are static. More correctly, as temperature increases from 50 to 200 K, both ΔC6Li and increase by about 15%, for reasons currently unknown. Note that graphite34,35 and alkali-metal intercalated graphites36 exhibit negative thermal expansion along the ab-plane (αa) below room temperature and αa ranges between −1 and −4 × 10⁻⁶ K−1. The reduction of the distance between μ+ and Li+ is naturally expected to increase Δ. However, the effect of such negative thermal expansion on Δ was estimated as 0.1% over 200 K, which is too small to explain the experimental result (∼15%).
In order to further discuss the temperature dependence of Δ below 230 K, we need to know the detailed displacement of the intercalated Li with temperature.
4.4 Diffusion coefficient of Li+
Assuming that Li+ diffuses through interstitial sites in the Li layer, the self diffusion coefficient (DLi) is given by37 | (4) |
 Å (= 2.48 × 10⁻¹⁰ m), and Zv,i = 1. Therefore, we obtain that DμSRLi = 7.6 × 10⁻¹¹ (cm2 s−1) for C6Li and DμSRLi = 1.5 × 10⁻¹⁰ (cm2 s−1) for C12Li at 310 K (Fig. 11).
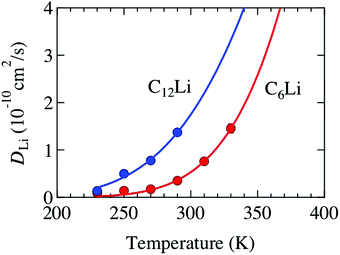 | ||
| Fig. 11 The temperature dependence of the diffusion coefficient (DLi) for C6Li and C12Li. Solid lines represent the estimate from eqn (3) and (4). | ||
Then, we discuss the reliability of DLi estimated with μ+SR. Table 3 lists several DLi for C6Li and C12Li reported with different techniques. The present μ+SR showed that DLi for C6Li and C12Li ranges in the order of 10−11–10−10 cm2 s−1 and DLi for C6Li is slightly smaller than DLi for C12Li. This is very consistent with DLi(C6Li) determined by the recent Li-NMR measurements, i.e. DLiNMR = 3.8 × 10⁻¹¹ (cm2 s−1) at 314 K.11 Also, DμSRLi is comparable to DLi predicted by first principles calculations. Furthermore, the past NMR11 and electrochemical measurements38–40 are likely to support the present result, i.e. DLi(C6Li) < DLi(C12Li), although the latter provided not DLi but a chemical diffusion coefficient (![[D with combining tilde]](https://www.rsc.org/images/entities/i_char_0044_0303.gif) Li).
Li).
![[D with combining tilde]](https://www.rsc.org/images/entities/i_char_0044_0303.gif) Li represents a chemical diffusion coefficient
Li represents a chemical diffusion coefficient
| C6Li | |||
|---|---|---|---|
| D Li (cm2 s−1) |
![[D with combining tilde]](https://www.rsc.org/images/entities/i_char_0044_0303.gif) Li (cm2 s−1)
Li (cm2 s−1) |
E a (meV) | |
| μ+SR (at 310 K) | 7.6(3) × 10−11 | — | 270(5) |
| Li-NMR11 (at 314 K) | 3.8 × 10⁻¹¹ | — | 550 |
| Li-NMR44 (at 373 K) | 10−8 | — | — |
| Electrochemical impedance38 (at 298 K) | 10−8–10−7 | — | — |
| First principles calculations42 (at 300 K) | 0.9 × 10⁻¹¹ | — | 283 |
| First principles calculations45 (at 300 K) | — | 1–10 × 10−11 | 510 |
| C12Li | |||
|---|---|---|---|
| D Li (cm2 s−1) |
![[D with combining tilde]](https://www.rsc.org/images/entities/i_char_0044_0303.gif) Li (cm2 s−1)
Li (cm2 s−1) |
E a (meV) | |
| μ+SR (at 310 K) | 14.6(4) × 10−11 | — | 170(20) |
| Li-NMR44 (at 373 K) | 2.4 × 10⁻⁷ | — | — |
| Electrochemical impedance38 (at 298 K) | 5.3 × 10⁻⁷ | — | — |
| PITT39 (at 328 K) | — | 0.01 × 10⁻¹¹ | — |
| Current pulse relaxation40 (at 300 K) | — | 0.8 × 10⁻¹¹ | — |
| Potential step chronoamperometry40 (at 300 K) | — | 0.1 × 10⁻¹¹ | — |
| First principles calculations42 (at 300 K) | 0.9 × 10⁻¹¹ | — | 297 |
In a highly oriented graphite (HOPG), DLi for C6Li and C12Li in the direction parallel/perpendicular to the graphene layer is also reported as ![[D with combining tilde]](https://www.rsc.org/images/entities/i_char_0044_0303.gif) //Li ∼ 10−7–10−6 cm2 s−1 and
//Li ∼ 10−7–10−6 cm2 s−1 and ![[D with combining tilde]](https://www.rsc.org/images/entities/i_char_0044_0303.gif) ⊥Li ∼ 10−11 cm2 s−1, respectively.41 If we assume the relation
⊥Li ∼ 10−11 cm2 s−1, respectively.41 If we assume the relation ![[D with combining tilde]](https://www.rsc.org/images/entities/i_char_0044_0303.gif) Li = ΘDLi, where thermodynamic factor Θ(x) = 103–104 for C6Li and C12Li,42D//Li is similar to DμSRLi. This shows that μ+SR “sees” Li diffusion in graphene layer. Such anisotropic diffusion in layered materials could be detected separately with μ+SR in the future, based on a theoretical prediction of Hint in a low dimensional system.43
Li = ΘDLi, where thermodynamic factor Θ(x) = 103–104 for C6Li and C12Li,42D//Li is similar to DμSRLi. This shows that μ+SR “sees” Li diffusion in graphene layer. Such anisotropic diffusion in layered materials could be detected separately with μ+SR in the future, based on a theoretical prediction of Hint in a low dimensional system.43
Concerning the thermal activation energy (Ea), the present μ+SR result is comparable to the NMR result and very consistent with the prediction from the calculations. In overall, μ+SR is found to provide reasonable DLi and to confirm that DLi in LIG ranges in the same order to those for positive electrode materials.
5 Conclusions
We have observed Li diffusion in C6Li and C12Li by μ+SR using the discharged negative electrode sheet, which was prepared by coating a graphite layer onto a Cu foil. Li diffusion was clearly detected with μ+SR through a small deviation of Hint caused by Li diffusion. A diffusion coefficient of Li (DLi) in C6Li and C12Li was found to range in the same order of DLi in positive electrode materials, that is, 10−10 (cm2 s−1) at room temperature. The thermal activation energy (Ea) of DLi was estimated as 270(5) meV for C6Li and 170(20) meV for C12Li. These values are comparable with those obtained by Li-NMR11 and predicted by first principles calculations.42 The difference of Ea between C6Li and C12Li is probably due to an interlayer electrostatic interaction from the adjacent Li layers. Since the Li diffusion in the anode sheet has been clarified by μ+SR, it is ready to measure Li diffusion in a Li-ion battery in an in operando manner.Appendix: muon sites
The first-principles calculations based on density functional theory30,31 have been performed to determine the muon site in C6Li and C12Li. The ultrasoft pseudopotential method46,47 is used and the generalized gradient approximation48 is adopted for the exchange–correlation energy. The position of μ+ is simulated using a hydrogen pseudopotential, where a deficient electron is compensated by the uniform background charge. The Li-1s state is treated as the valence. The calculations are carried out with the 2 × 2 × 2 supercell for C6Li and 2 × 2 × 1 for C12Li. The 4 × 4 × 4 k-point mesh is used for the Brillouin zone integration. For C12Li, both cases of μ+ being in the graphene layer and in the Li layer are considered. In the structural optimization process, the lattice constants are fixed at the experimental values and the atom positions are fully relaxed without any symmetry restrictions. The initial μ+ position is set to be about 1.4 Å above the center of the C–C bond. The results of the structural optimization are summarized in Fig. 10. In all cases, the μ+ positions are the on-top site on the C layer as shown in Fig. 10(a)–(c). The charge contour plots given in Fig. 10(d)–(f) indicate clear evidence of the C–μ+ bond formation which pulls up the C atom from the layer. The C atom is most likely stabilized by constructing sp3 hybrids. When the μ+ is located in the Li layer, the C–μ+ bond is slightly tilted due to an adjacent Li atom. The C–μ+ bond lengths are 1.13–1.14 Å which are close to typical C–H ones of ca. 1.1 Å. Because of the existence of the C–μ+ bond, the μ+ is expected to be immobile in C6Li and C12Li.Acknowledgements
We appreciate the staff at ISIS, Rutherford Appleton Laboratory, U.K. for their supports during μ+SR experiments and Mr T. Inoue and Mr Y. Kishida at Toyota Central R & D Labs., Inc. for their contribution to the examination prior to the μ+SR experiments. This work was supported by the Ministry of Education, Culture, Sports, Science and Technology (MEXT) of Japan, KAKENHI Grant no. JP23108003 and Japan Society for the Promotion Science (JSPS) KAKENHI Grant No. JP26286084.References
- D. D. L. Chung, J. Mater. Sci., 2002, 37, 1475–1489 CrossRef CAS.
- V. Etacheri, R. Marom, R. Elazari, G. Salitra and D. Aurbach, Energy Environ. Sci., 2011, 4, 3243–3262 CAS.
- K. Momma and F. Izumi, J. Appl. Crystallogr., 2011, 44, 1272–1276 CrossRef CAS.
- Y. X. Zhao and I. L. Spain, Phys. Rev. B: Condens. Matter Mater. Phys., 1989, 40, 993–997 CrossRef CAS.
- R. Juza and V. Wehle, Naturwissenschaften, 1965, 52, 537 CrossRef CAS.
- J. Sugiyama, K. Mukai, Y. Ikedo, H. Nozaki, M. Månsson and I. Watanabe, Phys. Rev. Lett., 2009, 103, 147601 CrossRef PubMed.
- J. Sugiyama, Y. Ikedo, K. Mukai, H. Nozaki, M. Månsson, O. Ofer, M. Harada, K. Kamazawa, Y. Miyake, J. H. Brewer, E. J. Ansaldo, K. H. Chow, I. Watanabe and T. Ohzuku, Phys. Rev. B: Condens. Matter Mater. Phys., 2010, 82, 224412 CrossRef.
- J. Sugiyama, H. Nozaki, M. Harada, K. Kamazawa, O. Ofer, M. Månsson, J. H. Brewer, E. J. Ansaldo, K. H. Chow, Y. Ikedo, Y. Miyake, K. Ohishi, I. Watanabe, G. Kobayashi and R. Kanno, Phys. Rev. B: Condens. Matter Mater. Phys., 2011, 84, 054430 CrossRef.
- J. Sugiyama, H. Nozaki, M. Harada, K. Kamazawa, Y. Ikedo, Y. Miyake, O. Ofer, M. Månsson, E. J. Ansaldo, K. H. Chow, G. Kobayashi and R. Kanno, Phys. Rev. B: Condens. Matter Mater. Phys., 2012, 85, 054111 CrossRef.
- J. Sugiyama, K. Mukai, M. Harada, H. Nozaki, K. Miwa, T. Shiotsuki, Y. Shindo, S. R. Giblin and J. Lord, Phys. Chem. Chem. Phys., 2013, 15, 10402–10412 RSC.
- J. Langer, V. Epp, P. Heitjans, F. A. Mautner and M. Wilkening, Phys. Rev. B: Condens. Matter Mater. Phys., 2013, 88, 094304 CrossRef.
- M. Mansson and J. Sugiyama, Phys. Scr., 2013, 88, 068509 CrossRef.
- J. Sugiyama, K. Mukai, H. Nozaki, M. Harada, M. Månsson, K. Kamazawa, D. Andreica, A. Amato and A. D. Hillier, Phys. Rev. B: Condens. Matter Mater. Phys., 2013, 87, 024409 CrossRef.
- S. Klamor, K. Zick, T. Oerther, F. M. Schappacher, M. Winter and G. Brunklaus, Phys. Chem. Chem. Phys., 2015, 17, 4458–4465 RSC.
- S. Taminato, M. Yonemura, S. Shiotani, T. Kamiyama, S. Torii, M. Nagao, Y. Ihikawa, K. Mori, T. Fukunaga, Y. Onodera, T. Naka, M. Morishima, Y. Ukyo, D. S. Adipranoto, H. Arai, Y. Uchimoto, Z. Ogumi, K. Suzuki, M. Hirayama and R. Kanno, Sci. Rep., 2016, 6, 28843 CrossRef CAS PubMed.
- http://https://www.srim.org .
- S. Giblin, S. Cottrell, P. King, S. Tomlinson, S. Jago, L. Randall, M. Roberts, J. Norris, S. Howarth, Q. Mutamba, N. Rhodes and F. Akeroyd, Nucl. Instrum. Methods Phys. Res., Sect. A, 2014, 751, 70 CrossRef CAS.
- G. M. Kalvius, D. R. Noakes and O. Hartmann, in Handbook on the Physics and Chemistry of Rare Earths, ed. K. A. Gschneidner, J. L. Eyring and G. H. Lander, North-Holland, Amsterdam, 2001, vol. 32, ch. 206, pp. 55–451 Search PubMed.
- A. Yaouanc and P. D. de Reotier, Muon Spin Rotation, Relaxation, and Resonance: Applications to Condensed Matter, Oxford, Oxford, 2011 Search PubMed.
- R. Mashita, H. Kishimoto, R. Inoue, A. Koda, R. Kadono and T. Kanaya, Polymer, 2016, 105, 510–515 CrossRef CAS.
- A. D. Pant, Y. Sugawara, I. Yanagihara, G. P. Khanal, I. Shiraki, W. Higemoto, K. Shimomura, K. Ishida, F. L. Pratt, E. Torikai and K. Nagamine, J. Phys. Soc. Conf. Proc., 2015, 8, 033007 Search PubMed.
- A. S. Powell, J. S. Lord, D. H. Gregory and J. J. Titman, J. Phys. Chem. C, 2009, 113, 20758–20763 CAS.
- A. S. Powell, Z. Stoeva, J. S. Lord, R. I. Smith, D. H. Gregory and J. J. Titman, Phys. Chem. Chem. Phys., 2013, 15, 816–823 RSC.
- T. E. Ashton, J. V. Laveda, D. A. MacLaren, P. J. Baker, A. Porch, M. O. Jones and S. A. Corr, J. Mater. Chem. A, 2014, 2, 6238–6245 CAS.
- M. Amores, T. E. Ashton, P. J. Baker, E. J. Cussen and S. A. Corr, J. Mater. Chem. A, 2016, 4, 1729–1736 CAS.
- R. S. Hayano, Y. J. Uemura, J. Imazato, N. Nishida, T. Yamazaki and R. Kubo, Phys. Rev. B: Condens. Matter Mater. Phys., 1979, 20, 850–859 CrossRef CAS.
- R. Kubo and T. Toyabe, in Magnetic Resonance and Relaxation, ed. R. Bline, North-Holland, Amsterdam, 1996 Search PubMed.
- J. A. Chakhalian, R. F. Kiefl, S. R. Dunsiger, W. A. MacFarlane, R. Miller, J. E. Sonier and J. E. Fischer, Phys. Rev. B: Condens. Matter Mater. Phys., 2002, 66, 155107 CrossRef.
- http://www.isis.ral.ac.uk .
- P. Hohenberg and W. Kohn, Phys. Rev., 1964, 136, B864 CrossRef.
- W. Kohn and L. Sham, Phys. Rev., 1965, 140, A1133 CrossRef.
- K. M. Kojima, J. Yamanobe, H. Eisaki, S. Uchida, Y. Fudamoto, I. M. Gat, M. I. Larkin, A. Savici, Y. J. Uemura, P. P. Kyriakou, M. T. Rovers and G. M. Luke, Phys. Rev. B: Condens. Matter Mater. Phys., 2004, 70, 094402 CrossRef.
- J. Sugiyama, H. Nozaki, K. Mukai, M. Harada, M. Mansson and A. Hillier, Solid State Ionics, 2014, 262, 901–903 CrossRef CAS.
- D. Tsang, B. Marsden, S. Fok and G. Hall, Carbon, 2005, 43, 2902–2906 CrossRef CAS.
- J. B. Nelson and D. P. Riley, Proc. Phys. Soc., 1945, 57, 477 CrossRef CAS.
- S. E. Hardcastle and H. Zabel, Phys. Rev. B: Condens. Matter Mater. Phys., 1983, 27, 6363–6369 CrossRef CAS.
- R. J. Borg and G. J. Dienes, An Introduction to Solid State Diffusion, Academic Press, San Diego, 1988, ch. 3, pp. 53–77 Search PubMed.
- A. Funabiki, M. Inaba, Z. Ogumi, S. Yuasa, J. Otsuji and A. Tasaka, J. Electrochem. Soc., 1998, 145, 172–178 CrossRef CAS.
- P. Yu, B. N. Popov, J. A. Ritter and R. E. White, J. Electrochem. Soc., 1999, 146, 8–14 CrossRef CAS.
- T. Uchida, Y. Morikawa, H. Ikuta, M. Wakihara and K. Suzuki, J. Electrochem. Soc., 1996, 143, 2606–2610 CrossRef CAS.
- K. Persson, V. A. Sethuraman, L. J. Hardwick, Y. Hinuma, Y. S. Meng, A. van der Ven, V. Srinivasan, R. Kostecki and G. Ceder, J. Phys. Lett., 2010, 1, 1176–1180 CAS.
- K. Persson, Y. Hinuma, Y. S. Meng, A. Van der Ven and G. Ceder, Phys. Rev. B: Condens. Matter Mater. Phys., 2010, 82, 125416 CrossRef.
- G. Solt, Hyperfine Interact., 1995, 96, 167–175 CrossRef CAS.
- Y. Saito, H. Kataoka, K. Nakai, J. Suzuki, K. Sekine and T. Takamura, J. Phys. Chem. B, 2004, 108, 4008–4012 CrossRef CAS.
- K. Toyoura, Y. Koyama, A. Kuwabara, F. Oba and I. Tanaka, Phys. Rev. B: Condens. Matter Mater. Phys., 2008, 78, 214303 CrossRef.
- D. Vanderbilt, Phys. Rev. B: Condens. Matter Mater. Phys., 1990, 41, 7892 CrossRef.
- K. Miwa, Phys. Rev. B: Condens. Matter Mater. Phys., 2011, 84, 094304 CrossRef.
- K. B. J. P. Perdew and M. Ernzerho, Phys. Rev. Lett., 1996, 77, 3865 CrossRef PubMed.
- H. Schilling, M. Camani, F. N. Gygax, W. Ruegg and A. Schenck, J. Phys. F: Met. Phys., 1982, 12, 875 CrossRef CAS.
| This journal is © the Owner Societies 2017 |


