
 Open Access Article
 This Open Access Article is licensed under a
 Creative Commons Attribution 3.0 Unported Licence
Local structure and composition of PtRh nanoparticles produced through cathodic corrosion†
Thomas J. P.
Hersbach
 a,
Ruud
Kortlever
a,
Matti
Lehtimäki
b,
Petr
Krtil
*b and
Marc T. M.
Koper
*a
a,
Ruud
Kortlever
a,
Matti
Lehtimäki
b,
Petr
Krtil
*b and
Marc T. M.
Koper
*a
aLeiden Institure of Chemistry, Leiden University, PO Box 9502, 2300 RA Leiden, The Netherlands. E-mail: m.koper@lic.leidenuniv.nl
bDepartment of Electrocatalysis, J. Heyrovský Institute of Physical Chemistry, Academy of Sciences of the Czech Republic, Dolejškova 3, 18223 Prague, Czech Republic
First published on 24th March 2017
Abstract
Alloy nanoparticles fulfill an important role in catalysis. As such, producing them in a simple and clean way is much desired. A promising alloy nanoparticle production method is cathodic corrosion, which generates particles by applying an AC voltage to an alloy electrode. However, this harsh AC potential program might affect the final elemental distribution of the nanoparticles. In this work, we address this issue by characterizing the time that is required to create 1 μmol of Rh, Pt12Rh88, Pt55Rh45 and Pt nanoparticles under various applied potentials. The corrosion time measurements are complemented by structural characterization through transmission electron microscopy, X-ray diffraction and X-ray absorption spectroscopy. The corrosion times indicate that platinum and rhodium corrode at different rates and that the cathodic corrosion rates of the alloys are dominated by platinum. In addition, the structure-sensitive techniques reveal that the elemental distributions of the created alloy nanoparticles indeed exhibit small degrees of elemental segregation. These results indicate that the atomic alloy structure is not always preserved during cathodic corrosion.
1 Introduction
In heterogeneously catalyzed processes, a high activity per gram of catalyst is desired. This requires a maximization of active surface area, which is why heterogeneous catalysts are typically processed to become (supported) nanoparticles.1 Such particles can take on various manifestations, including alloys. These metal alloys are of great interest, since their composition can be varied to optimize catalysis.2 In such an optimized alloy catalyst, the bonding of reaction intermediates to the catalyst can be tuned such that a reaction is catalyzed with minimal energy losses.3–5 Though this optimization strategy has led to significant advances in catalyzing various reactions,6–9 preparing alloy nanoparticles with a tuned composition is often challenging. Therefore, finding new ways to prepare alloy nanoparticles is potentially of great interest.Among the various chemical,10–14 biochemical15 and physical16–18 processes used to create metal alloy nanoparticles, a promising candidate is cathodic corrosion. This method, which was first observed by Haber,19 revisited by Kabanov et al.20 and studied again more recently,21–26 involves making nanoparticles by applying a cathodic voltage to a sacrificial electrode. During this cathodic polarization, nanoparticles will form near and on the electrode. The majority of these particles generally remains attached to the sacrificial electrode, which is why a more positive voltage is typically introduced to disperse the nanoparticles into the working solution and allow the particles to be collected.23 By alternating these positive and negative polarizations, one obtains an AC potential program. Such programs are the basis of most practical cathodic corrosion setups,27–29 which can be used to produce nanoparticles of most metals and alloys in a relatively fast and clean way.
Producing alloy nanoparticles by cathodic corrosion should only require a sacrificial electrode of the right composition, and should be able to convert the electrode into nanoparticles with the same composition. This was demonstrated by manufacturing a variety of PtRh alloy nanoparticles that exhibited superior catalytic activity for various reactions.27 Cyclic voltammetry (CV), X-ray diffraction (XRD) and energy-dispersive X-ray spectroscopy (EDX) analysis indicated that these particles had the same structure and composition as their sacrificial electrodes.
However, platinum and rhodium vary in their surface energy and resistance to oxidation,30,31 which can lead to sub-nanometer-scale surface segregation of the nanoparticles.32 Because the expected length scale of surface segregation falls beyond the resolution of the previously employed techniques, segregation might have gone unnoticed. In addition, platinum and rhodium were recently shown to behave subtly differently during cathodic corrosion: though both metals start corroding at similar potentials, rhodium was the only metal from which nanoparticle dispersion could be observed visibly during constant polarization at mild potentials.33,34 It is therefore not immediately apparent why cathodic corrosion should preserve the atomic structure and composition of the sacrificial electrode during the formation of nanoparticles.
To bridge this gap in the understanding of cathodic corrosion, we present a detailed study of cathodic nanoparticle formation of PtRh alloys. Cathodic corrosion of Pt, Pt55Rh45, Pt12Rh88 and Rh electrodes is combined with three structural characterization methods of the resulting nanoparticles: visual characterization through transmission electron microscopy (TEM), long-range structural characterization through XRD and local structural characterization through extended X-ray absorption fine structure (EXAFS) measurements. As we will show, these complementary techniques detect small differences in nanoparticle size and composition, which indicate the coexistence of a crystalline and an amorphous set of particles that exhibit a minor degree of elemental segregation.
2 Experimental
2.1 Nanoparticle synthesis
All electrochemical experiments were performed in a two-electrode setup, using a graphite rod (Alfa Aesar, Ultra “F” purity) as the counter electrode. Working electrodes were either of the following wires: Pt (Mateck, 99.99%; ∅ = 0.1 mm), Pt55Rh45 (Goodfellow; ∅ = 0.1 mm), Pt12Rh88 (Highways International; ∅ = 0.1 mm) and Rh (Mateck, 99.9%; ∅ = 0.125 mm). All alloy compositions in this work are given as atomic ratios. The working electrolyte consisted of saturated NaOH (Acros, for analysis). All water used in this study was demineralized and ultrafiltered by a Millipore MilliQ system (resistivity > 18.2 MΩ cm, TOC < 5 ppb). For each measurement, a micrometer screw was used to carefully control the working electrode immersion depth, such that 1 μmol of material was immersed. Next, a 100 Hz square wave potential was applied until corrosion was completed. The square wave potential limits were either −20 V and +10 V; −15 V and +10 V; −10 V and +10 V; −10 V and +15 V; or −10 V and +20 V. These potentials were applied using a power amplifier that was controlled by LabVIEW. The produced particles were purified using repeated centrifuging/rinsing cycles, until the pH of the supernatant was neutral.2.2 Structural characterization
Crystallinity and coherent domain size of the original alloys and of the nanoparticle alloy samples were characterized by X-ray diffraction (XRD) and X-ray absorption spectroscopy (XAS). Before characterization, the nanoparticle samples were embedded in a boron nitride matrix: for each sample, approximately 10 mg of PtRh nanoparticles were mixed with 200 mg of boron nitride (Wako Chemicals, Japan, ACS grade) and compressed into pellets.All data processing prior to the local structure refinement of the EXAFS functions was done using version 1.2.10 of the IFEFFIT software package.35 This processing involved data normalization, smoothing, background subtraction, Fourier transformation of the spectra and windowing of the transform. The photoelectron wave vector (k) for the Fourier transforms was kept within the range of k = 3–18 Å−1 for Rh-EXAFS and k = 3–13 Å−1 for Pt-EXAFS. A k-weighting factor of 2 was applied. For presenting EXAFS functions in real space (R-space), the ranges of R = 1–6 Å and R = 1–4 Å were used for Rh and Pt EXAFS, respectively. The EXAFS functions in R-space are displayed in Fig. S1 (ESI†).
After data processing, the local structure of the materials was analyzed using the Artemis non-linear least squares (NLLLS) minimization module of the IFEFFIT package.36 This was done by performing full-profile refinement of the EXAFS spectra by NLLS minimization in R-space with a k-weighting factor of 2. The theoretical model was generated using the FEFF6.2 library with structural parameters derived from an ideal face-centered cubic (fcc) metal with a random distribution of the constituting elements. The coordination numbers and bonding distances of Pt and Rh in each coordination shell were refined independently without additional constraints.
3 Results and discussion
3.1 Corrosion rate
In order to study the various factors influencing the rate of nanoparticle production, the time required to corrode 1 μmol of wire was measured for each metal and alloy. This time, which will be referred to as corrosion time, should be related inversely to the corrosion rate and is displayed in Fig. 1 for all tested materials and potential limits. The corrosion treatment with −10 V negative and +10 V positive limits, shown in light green in Fig. 1, will be used as a reference for the comparison with the other treatments. This treatment is therefore shown as the middle bar for each alloy in Fig. 1. | ||
| Fig. 1 Time required to produce 1 μmol of nanoparticles, using square wave potentials with various limits. Reported corrosion times are averages of 10 measurements. The error bars represent a 95% confidence interval. | ||
Comparing the corrosion time for the different alloys, this time is highest for rhodium and decreases with increasing platinum content. Equivalently, the corrosion rate is lowest for rhodium and increases with increasing platinum content. This effect of platinum appears more pronounced for smaller amounts of platinum; the corrosion rate roughly doubles when 12 percent of platinum is present and increases further for a platinum content of 55 percent. In contrast, the corrosion rate increases only marginally between Pt55Rh45 and pure platinum. Thus, the corrosion rate appears to depend nonlinearly on the platinum content of the alloy, with smaller platinum ratios having a more pronounced effect on the corrosion rate.
Another factor influencing the corrosion rate is the negative potential limit. The corrosion time as a function of the negative potential limit is depicted with the red and orange bars in Fig. 1. When lowering the negative limit from −10 V to −20 V, the corrosion time goes down drastically; it decreases from 23 seconds to 13 seconds in the case of platinum and drops sharply from 80 seconds to 27 seconds for rhodium. The alloys exhibit a similar degree of enhancement. This enhancement has been observed before and can be explained quite readily by realizing that the nanoparticles are produced through a cathodic process.23 The rate for this process will be influenced by its driving force: the negative potential limit. Hence, a more negative potential limit will speed up the corrosion and lower the corresponding corrosion time.
The dark green and blue bars in Fig. 1 illustrate the effect of the positive potential limit on the corrosion rate. The corrosion rate is only enhanced significantly by the positive potential limit in the case of pure rhodium: the average corrosion time decreases from 80 to 45 seconds when increasing the positive potential limit from 10 to 20 V. The observed change of the corrosion time is negligible for all other materials. This difference in corrosion time may be explained by the differing anodic dissolution kinetics of platinum and rhodium.
To properly assess these kinetics, one should distinguish between transient and steady-state dissolution.37 Transient dissolution takes place when metal oxides are created and reduced. In our system, transient dissolution therefore occurs when switching between positive and negative polarization. As such, the transient dissolution rate should primarily depend on how often positive and negative polarizations are alternated, which is determined by the frequency of the applied square wave potential. Since this frequency is kept constant, the transient dissolution rate should be constant in all experiments as well. In contrast with transient dissolution, steady-state dissolution occurs during constant positive polarization and takes place concurrently with oxygen evolution.37 Both the oxygen evolution rate and the steady-state dissolution rate are expected to increase with a more positive potential limit. Based on the characteristics of transient and steady-state dissolution, it is therefore expected that only the steady-state dissolution rate should increase when the positive potential limit is increased.
These two dissolution mechanisms are of differing importance for platinum and rhodium. On the one hand, rhodium dissolves through both the transient and steady-state mechanisms. Its dissolution rate should therefore increase when the positive potential limit is increased. On the other hand, platinum is virtually unaffected by steady-state dissolution.37 This would explain why the dissolution rate of platinum and platinum-containing alloys appears to be largely unaffected by increasing the positive potential limit.
The observed trends in the corrosion rate underscore the importance of platinum in the cathodic corrosion of PtRh alloys. Without platinum, rhodium exhibits a slow corrosion rate which can be enhanced by increasing the positive potential limit. The presence of 12 percent of platinum leads to a dramatic increase in the corrosion rate and shifts the corrosion behavior towards that of pure platinum, while simultaneously diminishing the influence of the positive potential limit on the corrosion rate. With a platinum content of 55 percent, the alloy corrodes virtually identically to pure Pt: it exhibits similar corrosion rates and barely responds to variations of the positive potential limit. Based on these observations, we conclude that platinum dominates the corrosion behavior of the PtRh alloys.
3.2 Alloy nanoparticle structure
Further insight into the corrosion behavior of the alloys can be gained by comparing the structure of the prepared alloy nanoparticles with that of the parent alloys. Such a comparison is essential, since the local structure of a nanoparticle has a major effect on its catalytic activity. Because the prepared nanoparticles may consist of both crystalline and amorphous phases, one needs to combine several structure-sensitive techniques to probe the relation between the structure of nanoparticles and the conditions under which these particles were synthesized.The crystalline nanoparticle phases can conveniently be probed by using X-ray diffraction, since this technique exclusively detects crystalline phases. Additionally, both crystalline and non-crystalline phases of the nanoparticles can be detected by EXAFS. This technique probes the local chemical composition, provides information on the average coordination number of the alloy components and is able to resolve average interatomic bonding distances. This information reflects the average local environment around both rhodium and platinum atoms, since both the Pt LIII edge and the Rh K edge are probed independently.
 | ||
| Fig. 2 X-ray diffraction patterns of the parent alloy wires. | ||
More unexpected is the observation that, for Pt55Rh45, the (200) reflection intensity is significantly higher than one would expect from the (111) intensity. This can be attributed to the wire nature of the parent alloy sample, since many wires are oriented along a crystallographic axis;40 such a preferential orientation should lead to an enhancement of specific peaks in the diffraction pattern of the parent alloy.
XRD was also employed to analyze the produced nanoparticles. For these nanoparticles, the presence of diffraction patterns (Fig. S2, ESI†) demonstrates that they are at least partially crystalline. All diffraction peaks conform to the fcc structure, which indicates that no crystalline bulk oxide is present in the nanoparticles. Though all of the diffraction patterns match the fcc structure, the relative intensities of the patterns differ between Pt-rich and Pt-poor materials. On the one hand, Rh and Pt12Rh88 nanoparticles show a disproportionally suppressed scattering in the (200) direction, which suggests a preferential orientation of the formed nanoparticles. On the other hand, the Pt and Pt55Rh45 alloys exhibit a more conventional reflection intensity in the (200) direction, which suggests that these particles grew more isotropically.
For all nanoparticles, one can use the X-ray diffraction data to determine the particles' average coherent domain size. This domain size should ideally approach the nanoparticle size and is displayed in Fig. 3. The coherent domain sizes in Fig. 3 range between 9 and 11 nm for the pure platinum particles and 3.5 and 5.5 nm for Rh and the Pt–Rh alloys, respectively. The coherent domain sizes decrease with increasing rhodium content.
 | ||
| Fig. 3 Coherent domain sizes of the prepared nanoparticles. Error bars represent two standard deviations. If an error bar is not visible, it overlaps with its corresponding data point. | ||
Interestingly, the coherent domain sizes of the rhodium-containing particles exceed the average particle sizes obtained in transmission electron microscopy (Table S1, ESI†). This apparent discrepancy can be reconciled by examining the particle size distributions in Fig. S3–S6 (ESI†), which show that a large fraction of the nanoparticles is smaller than the limit of the diffraction approach in the XRD setup (ca. 5 nm). Since this fraction of particles is not detected by X-ray diffraction, XRD detects a disproportionally large amount of big particles. The obtained domain size is therefore an overestimate of the actual particle size.
In the case of Pt12Rh88, XRD detects a slight platinum enrichment in the produced nanoparticles (Fig. 4a). A similar enrichment in platinum is obtained from refinement of the Pt12Rh88 EXAFS data (Fig. 4b). The rhodium K edge data suggest that the platinum content in the Rh local environment ranges between 13 and 18 percent, while the platinum LIII edge data point towards a higher Pt concentration in the local environment of platinum (22 to 27 percent). Though the XRD- and EXAFS-based compositions deviate slightly in samples like the one prepared at −10 V; +10 V, they generally match well.
 | ||
| Fig. 4 Composition of nanoparticles produced from Pt12Rh88 (a and b) and Pt55Rh45 (c and d) wires, as determined by XRD (a and c) and EXAFS (b and d). Error bars represent one standard deviation. | ||
A less satisfactory agreement between XRD- and EXAFS-based compositions is found for Pt55Rh45 (Fig. 4c and d): XRD indicates a platinum content that is markedly higher than in the parent alloy (71 to 75 percent), while EXAFS generally indicates a more expected Pt content of 52 to 53 percent in the Rh environment and 59 to 61 percent in the Pt environment. Though the EXAFS-based compositions point towards a minor platinum enrichment with respect to the parent alloy, this enrichment is not as dramatic as suggested by the XRD.
This mild platinum enrichment, which is detected by both techniques and for both alloys, points towards a minor loss of rhodium. Such a loss can be accounted for by noticing that Fig. 3 and Fig. S3–S6 (ESI†) indicate that rhodium-rich particles are generally smaller than rhodium-poor particles. These small-size rhodium-rich nanoparticles are lost more easily during the purifying centrifuging/rinsing cycles. In addition, a disproportional amount of rhodium might have been lost through the formation of cationic rhodium during steady-state dissolution.
A more paradoxical observation is the difference between the compositions found by XRD and EXAFS. This discrepancy, which occurs in all Pt55Rh45 samples and several Pt12Rh88 samples, is another indication of the coexistence of a crystalline and an amorphous phase. Of these two phases, the crystalline one is the only phase that is detectable by XRD. Therefore, the crystalline phase is overrepresented in both the XRD-based particle size and composition data. If this crystalline phase has a different composition than the amorphous phase, a difference between EXAFS and XRD is indeed expected. By combining this result with the observed size difference between XRD and TEM, one can deduce that this crystalline phase has a bigger particle size than the amorphous phase, in addition to the different content that can be deduced from the difference between EXAFS and XRD.
Another hint for the co-existence of a crystalline and amorphous phase follows from a closer scrutiny of the compositions that are found from EXAFS analysis of the Pt LIII and Rh K edge. These compositions indicate that the average local platinum content is higher around platinum atoms and that the average local rhodium content is higher around rhodium. This implies minor clustering of platinum and rhodium, which is a sign of elemental segregation. This segregation might be present as either surface segregation within particles (intra-particle segregation) or as the coexistence of two types of particles with different compositions (inter-particle segregation). These types of segregation cannot be distinguished with EXAFS, since the X-ray beam typically probes sample areas between 0.4 and 1 mm2 and thus provides insufficient spatial resolution. Nonetheless, the EXAFS data clearly indicate a minor degree of elemental segregation. This segregation can be interpreted in a visual manner by using 2D nanoparticle models, which are presented in Fig. S7 (ESI†).
Further evidence for elemental segregation follows from the inhomogeneous distribution of oxygen on the alloy nanoparticles; approximately 0.8 ± 0.3 oxygen atoms per rhodium atom can be refined from the Rh K edge EXAFS data. This oxygen can be attributed to surface oxygen species, since no evidence for the formation of bulk oxides is present in the XRD data. More specifically, this oxygen is likely chemisorbed on the nanoparticles, since the amount of oxygen is independent of the potential limits that were used during particle synthesis. In contrast with oxygen on rhodium, no statistically significant signs of oxygen can be found from the refined Pt LIII edge EXAFS data. The absence of chemisorbed surface oxygen species around Pt and presence of these species around Rh suggests a preferential confinement of rhodium to the surface of the produced nanoparticles. As such, this oxygen distribution is an additional sign of a small degree of elemental inhomogeneity in the produced nanoparticles.
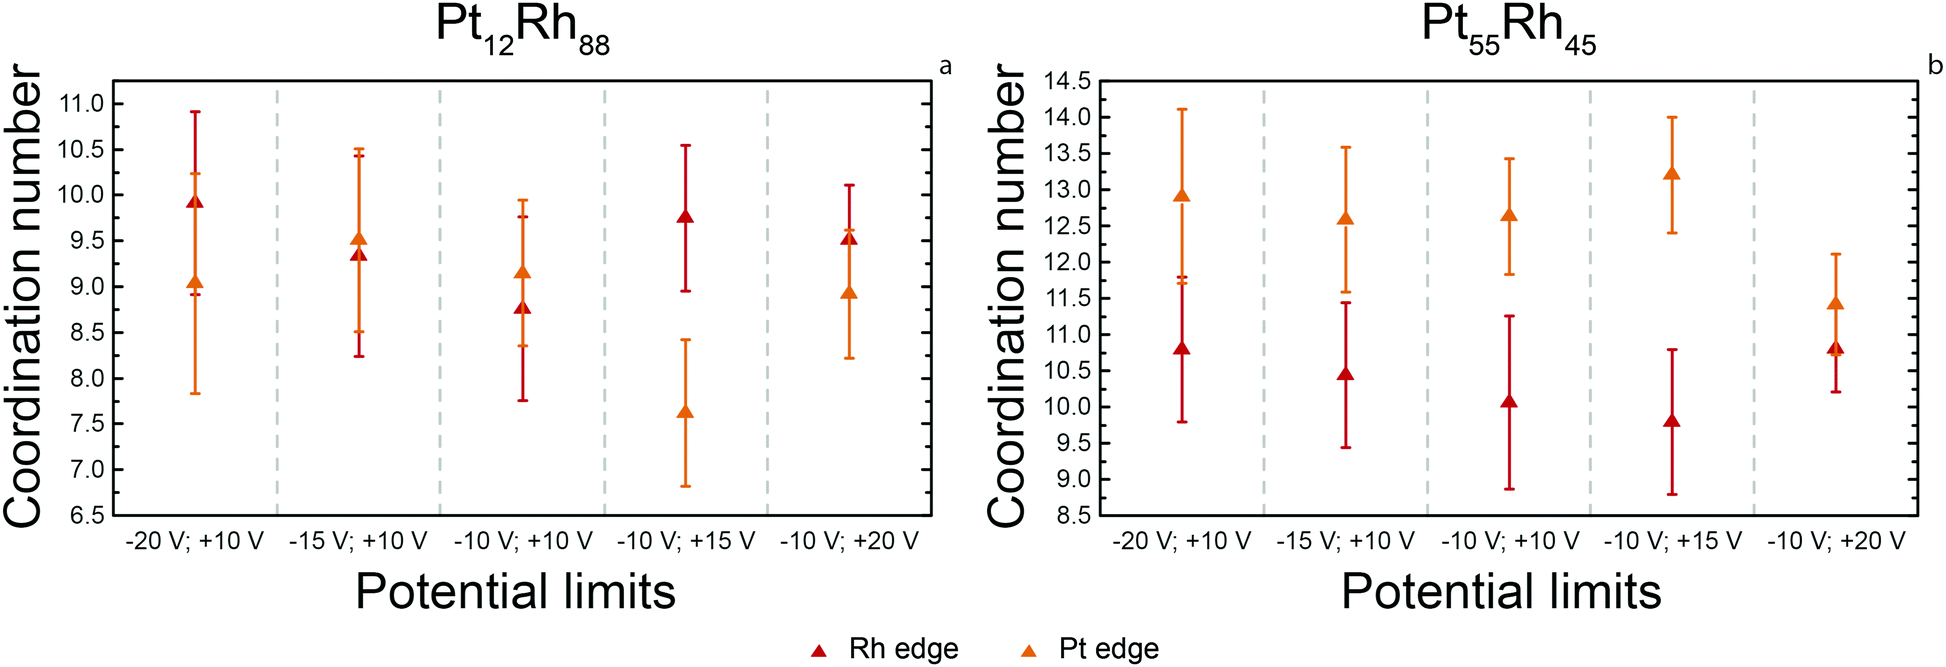 | ||
| Fig. 5 Average coordination numbers of Pt and Rh in Pt12Rh88 (a) and Pt55Rh45 (b). Error bars represent one standard deviation. | ||
The Pt12Rh88 alloy nanoparticles show reasonable similarity of the platinum and rhodium coordination numbers, which range between 8.5 and 10.0. This indicates that both components are distributed homogeneously throughout the nanoparticles. However, the coordination numbers differ from 12, which is the coordination number of a bulk fcc metal atom. This can be attributed to the rather small size of the prepared nanoparticles, which is in the order of 1.5–2.5 nm. In such small particles, 40 to 60 percent of the atoms are at the surface.41 These atoms have fewer neighboring atoms than those in the bulk, which leads to a lower overall coordination number.
The coordination number of Pt in the Pt55Rh45 alloys is closer to 12, which is in agreement with the larger particle sizes of these alloys. However, the average coordination number of Rh is markedly different and appears closer to 10. This suggests predominant confinement of Rh into the particle surface. This surface confinement could again point to both intra- and inter-particle segregation. Intra-particle segregation is plausible, since rhodium can preferentially be present at the surface of an otherwise homogeneous nanoparticle.42 Similarly plausible is inter-particle segregation as the cause of a lowered coordination number for rhodium: if small rhodium-rich particles coexist with larger platinum-rich particles, one will expect a lower coordination number of rhodium due to the difference in particle size.
 | ||
| Fig. 6 Average bond distances of Pt and Rh in Pt12Rh88 (a) and Pt55Rh45 (b). The Pt–Rh and Rh–Pt distances both represent the same distance, measured on a different absorption edge. The Pt–Rh data points were measured on the Pt LIII edge, while the Rh–Pt points were measured on the Rh K edge. Error bars represent one standard deviation. | ||
Surprisingly, the refinement of these distances indicates no variability of the Pt–Pt, Pt–Rh and Rh–Rh bond distances in the Pt12Rh88 nanoparticles; both Rh K edge and Pt LIII edge data indicate a bond distance of 2.69 Å. This indicates that the Pt atoms in the prepared nanoparticles reside in rather compressed environments, which agrees well with the fact that the nanoparticles contain more than 80 percent of rhodium. Though this is less rhodium than was present in the parent alloy wires, the rhodium content appears to be high enough to cause strain on the platinum atoms.
In contrast, the metal–metal distances in Pt55Rh45 indicate a relaxed structure with well-distinguished bond distances between Pt–Pt and Rh–Rh bonding pairs. These bond distances agree well with those reported in bulk Pt and Rh.38,39 A similar agreement is obtained for the Pt–Rh bond distances, which fall between those of Pt–Pt and Rh–Rh. This indicates a small degree of element segregation, which matches well with earlier observations from the local platinum content, oxygen distribution and average coordination numbers.
3.3 Discussion
The electrochemical cathodic corrosion behavior of the studied PtRh systems indicates that platinum electrodes are converted to nanoparticles at a higher rate than rhodium electrodes. The corrosion rate of alloy nanoparticles appears to be dominated by platinum, since the corrosion behavior is sensitive to the alloy composition at low platinum contents and less sensitive to the composition at high platinum contents.In addition, electrochemical characterization reveals that the corrosion rate of rhodium is strongly affected by the value of the positive potential limit. This indicates a pronounced role of anodic steady-state rhodium dissolution in the overall nanoparticle production rate. In contrast, the role of steady-state dissolution is strongly diminished for platinum and platinum-containing alloys.
The electrochemically observed steady-state rhodium dissolution is paralleled by a minor loss of rhodium that is indicated by both XRD and EXAFS. This rhodium loss can occur during steady-state dissolution of cationic rhodium at positive polarization. Though it is likely that part of this ionic rhodium will redeposit during the consecutive negative polarization, rhodium loss through steady-state dissolution can currently not be excluded. Alternatively, it is possible that small rhodium-rich particles are lost during particle purification.
Further structural characterization of the PtRh nanoparticles through XRD, TEM and EXAFS provides several insights. Firstly, X-ray diffraction detects nanoparticles that are significantly bigger than transmission electron microscopy would suggest. This indicates that XRD does not detect all produced nanoparticles. In a similar vein, XRD and EXAFS detect different nanoparticle compositions: XRD detects platinum contents that differ significantly from the expected content, while EXAFS matches the expected content relatively well. Combining these observations, it appears that the produced nanoparticle samples contain crystallographically amorphous particles that are undetectable by XRD, have sub-average particle sizes and differ in composition from the nanoparticles that can be detected by XRD.
Secondly, the analysis of the EXAFS data reveals an increased average Pt content around Pt atoms and an increased average Rh content around Rh atoms. This indicates segregation of platinum and rhodium. Elemental segregation is also expressed in the average coordination numbers of platinum and rhodium in the alloy nanoparticles. Though these coordination numbers are similar in Pt12Rh88, they differ in Pt55Rh45: the lower coordination number of rhodium is a sign of confinement of rhodium to the surface of the nanoparticles, which is underscored by chemisorbed oxygen only being detectable around rhodium. Similarly, the refined bond distances are similar for both elements in Pt12Rh88, but are different in Pt55Rh45. These differing bond distances are another indication of element segregation in Pt55Rh45. This segregation can be a sign of both intra-particle and inter-particle segregation.
4 Conclusions
This study presents an analysis of nanoparticles of four PtRh systems synthesized by the cathodic corrosion method using various AC potential programs. By studying these obtained nanoparticles with complementary characterization techniques, various insights are obtained.First of all, electrochemistry indicates that the corrosion behavior of alloys is dominated by the behavior of platinum, which is the component with the fastest corrosion rate. Secondly, XRD and TEM suggest the coexistence of larger crystalline and smaller crystallographically amorphous nanoparticles. This suggestion is confirmed by the difference between XRD and EXAFS data: while the EXAFS data detect an overall composition that is as expected, XRD only detects a crystalline subset of nanoparticles. Finally, the EXAFS-based compositions, coordination numbers and bond lengths indicate that the produced nanoparticles exhibit intra- or inter-particle elemental segregation.
Since this segregation might be induced by the presence of positive potentials during the corrosion protocol in this study, excluding these anodic potentials in a future study might yield additional valuable insights into cathodic corrosion. We do note that the exclusion of anodic potentials would likely lead to longer corrosion times that would be impractical when upscaling cathodic corrosion as a feasible nanoparticle production method.
A more pragmatic avenue for future studies would therefore be to study other alloy systems. The insights obtained in the current work are based exclusively on the PtRh system, in which rhodium is the component that is most prone to steady-state dissolution and has the lowest reduction potential. Research on the corrosion behavior of different alloys should allow for the distinguishment between the importance of these parameters. An ideal first candidate for this study would be the AuPt system, in which gold is more prone to steady-state dissolution,37 but has a higher reduction potential than platinum.31
Though the conclusions from these possible future studies might ultimately lead to a more complete understanding of cathodic corrosion, the current study reaffirms the potential of cathodic corrosion to be a relatively straightforward technique to create alloy nanoparticles.27,29 At the same time, these insights indicate that cathodic corrosion does not always preserve the alloy composition on an atomic level. It is therefore essential to characterize cathodically created nanoparticles with various complementary techniques, in order to confirm the homogeneity of the final nanoparticle product.
References
- F. Zaera, ChemSusChem, 2013, 6, 1797–1820 CrossRef CAS PubMed.
- R. Ferrando, J. Jellinek and R. L. Johnston, Chem. Rev., 2008, 108, 845–910 CrossRef CAS PubMed.
- A. J. Medford, A. Vojvodic, J. S. Hummelshøj, J. Voss, F. Abild-Pedersen, F. Studt, T. Bligaard, A. Nilsson and J. K. Nørskov, J. Catal., 2015, 328, 36–42 CrossRef CAS.
- A. Vojvodic and J. K. Nørskov, Natl. Sci. Rev., 2015, 2, 140–149 CrossRef.
- J. K. Nørskov, J. Rossmeisl, A. Logadottir, L. Lindqvist, J. R. Kitchin, T. Bligaard and H. Jónsson, J. Phys. Chem. B, 2004, 108, 17886–17892 CrossRef.
- M.-H. Shao, K. Sasaki and R. R. Adzic, J. Am. Chem. Soc., 2006, 128, 3526–3527 CrossRef CAS PubMed.
- C. Cui, L. Gan, H.-H. Li, S.-H. Yu, M. Heggen and P. Strasser, Nano Lett., 2012, 12, 5885–5889 CrossRef CAS PubMed.
- R. Kortlever, I. Peters, S. Koper and M. T. M. Koper, ACS Catal., 2015, 5, 3916–3923 CrossRef CAS.
- T. Zhang, S.-C. Li, W. Zhu, Z.-P. Zhang, J. Gu and Y.-W. Zhang, Nanoscale, 2017, 9, 1154–1165 RSC.
- Z. Peng and H. Yang, Nano Today, 2009, 4, 143–164 CrossRef CAS.
- M.-J. Kim, H.-J. Na, K. C. Lee, E. A. Yoo and M. Lee, J. Mater. Chem., 2003, 13, 1789–1792 RSC.
- P. Raveendran, J. Fu and S. L. Wallen, Green Chem., 2006, 8, 34–38 RSC.
- H. Choi, S. R. Al-Abed, S. Agarwal and D. D. Dionysiou, Chem. Mater., 2008, 20, 3649–3655 CrossRef CAS.
- Y.-J. Deng, N. Tian, Z.-Y. Zhou, R. Huang, Z.-L. Liu, J. Xiao and S.-G. Sun, Chem. Sci., 2012, 3, 1157 RSC.
- A. Schröfel, G. Kratošová, I. Šafařík, M. Šafaříková, I. Raška and L. M. Shor, Acta Biomater., 2014, 10, 4023–4042 CrossRef PubMed.
- C. C. Koch, Nanostruct. Mater., 1997, 9, 13–22 CrossRef CAS.
- I. Lee, S. W. Han and K. Kim, Chem. Commun., 2001, 1782–1783 RSC.
- T. He, E. Kreidler, L. Xiong, J. Luo and C. J. Zhong, J. Electrochem. Soc., 2006, 153, A1637–A1643 CrossRef CAS.
- F. Haber, Trans. Am. Electrochem. Soc., 1902, 2, 189–196 CAS.
- B. N. Kabanov, I. I. Astakhov and I. G. Kiseleva, Electrochim. Acta, 1979, 24, 167–171 CrossRef CAS.
- W. Huang, S. Chen, J. Zheng and Z. Li, Electrochem. Commun., 2009, 11, 469–472 CrossRef CAS.
- J. Liu, W. Huang, S. Chen and S. Hu, Int. J. Electrochem. Sci., 2009, 4, 1302–1308 CAS.
- A. I. Yanson, P. Rodriguez, N. Garcia-Araez, R. V. Mom, F. D. Tichelaar and M. T. M. Koper, Angew. Chem., Int. Ed., 2011, 50, 6346–6350 CrossRef CAS PubMed.
- I. Leontyev, A. Kuriganova, Y. Kudryavtsev, B. Dkhil and N. Smirnova, Appl. Catal., A, 2012, 431–432, 120–125 CrossRef CAS.
- F. Lu, X. Ji, Y. Yang, W. Deng and C. E. Banks, RSC Adv., 2013, 3, 18791–18793 RSC.
- I. Najdovski, P. Selvakannan and A. P. O'Mullane, ChemElectroChem, 2015, 2, 106–111 CrossRef CAS.
- P. Rodriguez, F. D. Tichelaar, M. T. M. Koper and A. I. Yanson, J. Am. Chem. Soc., 2011, 133, 17626–17629 CrossRef CAS PubMed.
- M. Duca, P. Rodriguez, A. I. Yanson and M. T. M. Koper, Top. Catal., 2014, 57, 255–264 CrossRef CAS.
- E. Bennett, J. Monzó, J. Humphrey, D. Plana, M. Walker, C. McConville, D. Fermin, A. Yanson and P. Rodriguez, ACS Catalysis, 2016, 6, 1533–1539 CrossRef CAS.
- L. Vitos, A. V. Ruban, H. L. Skriver and J. Kollár, Surf. Sci., 1998, 411, 186–202 CrossRef CAS.
- P. Vanýsek, CRC Handbook of Chemistry and Physics, CRC Press, Boca Raton, FL, 96th edn, 2015, ch. 5, pp. 5-80–5-89 Search PubMed.
- S. Zafeiratos, S. Piccinin and D. Teschner, Catal.: Sci. Technol., 2012, 2, 1787–1801 CAS.
- T. J. P. Hersbach, A. I. Yanson and M. T. M. Koper, Nat. Commun., 2016, 7, 12653 CrossRef CAS PubMed.
- T. J. P. Hersbach, V. A. Mints, F. Calle-Vallejo, A. I. Yanson and M. T. M. Koper, Faraday Discuss., 2016, 193, 207–222 RSC.
- M. Newville, J. Synchrotron Radiat., 2001, 8, 322–324 CrossRef CAS PubMed.
- B. Ravel and M. Newville, J. Synchrotron Radiat., 2005, 12, 537–541 CrossRef CAS PubMed.
- S. Cherevko, A. R. Zeradjanin, A. A. Topalov, N. Kulyk, I. Katsounaros and K. J. J. Mayrhofer, ChemCatChem, 2014, 6, 2219–2223 CrossRef CAS.
- J. W. Arblaster, Platinum Met. Rev., 1997, 41, 12–21 CAS.
- J. W. Arblaster, Platinum Met. Rev., 1997, 41, 184–189 CAS.
- I. L. Dillamore and W. T. Roberts, Metall. Rev., 1965, 10, 271–380 CAS.
- J. A. Blackman and C. Binns, Metallic Nanoparticles, Elsevier, 1st edn, 2009, ch. 1, pp. 1–16 Search PubMed.
- F. Tao, M. E. Grass, Y. Zhang, D. R. Butcher, F. Aksoy, S. Aloni, V. Altoe, S. Alayoglu, J. R. Renzas, C.-K. Tsung, Z. Zhu, Z. Liu, M. Salmeron and G. A. Somorjai, J. Am. Chem. Soc., 2010, 132, 8697–8703 CrossRef CAS PubMed.
Footnote |
| † Electronic supplementary information (ESI) available: EXAFS functions in R-space, nanoparticle X-ray diffraction patterns, TEM-based particle sizes and 2D nanoparticle visualizations. See DOI: 10.1039/c7cp01059a |
| This journal is © the Owner Societies 2017 |