
 Open Access Article
 This Open Access Article is licensed under a
 Creative Commons Attribution 3.0 Unported Licence
Charge transfer induced energy storage in CaZnOS:Mn – insight from experimental and computational spectroscopy†
Jonas J.
Joos
*ab,
Kurt
Lejaeghere
c,
Katleen
Korthout
ab,
Ang
Feng
 ab,
Dirk
Poelman
ab and
Philippe F.
Smet
*ab
ab,
Dirk
Poelman
ab and
Philippe F.
Smet
*ab
aLumiLab, Department of Solid State Sciences, Ghent University, Ghent, Belgium. E-mail: jonas.joos@UGent.be; philippe.smet@UGent.be
bCenter for Nano- and Biophotonics (NB Photonics), Ghent University, Ghent, Belgium
cCenter for Molecular Modeling (CMM), Ghent University, Ghent, Belgium
First published on 17th March 2017
Abstract
CaZnOS:Mn2+ is a rare-earth-free luminescent compound with an orange broadband emission at 612 nm, featuring pressure sensing capabilities, often explained by defect levels where energy can be stored. Despite recent efforts from experimental and theoretical points of view, the underlying luminescence mechanisms in this phosphor still lack a profound understanding. By the evaluation of thermoluminescence as a function of the charging wavelength, we probe the defect levels allowing energy storage. Multiple trap depths and trapping routes are found, suggesting predominantly local trapping close to Mn2+ impurities. We demonstrate that this phosphor shows mechanoluminescence which is unexpectedly stable at high temperature (up to 200 °C), allowing pressure sensing in a wide temperature range. Next, we correlate the spectroscopic results with a theoretical study of the electronic structure and stability of the Mn defects in CaZnOS. DFT calculations at the PBE+U level indicate that Mn impurities are incorporated on the Zn site in a divalent charge state, which is confirmed by X-ray absorption spectroscopy (XAS). Ligand-to-metal charge transfer (LMCT) is predicted from the location of the Mn impurity levels, obtained from the calculated defect formation energies. This LMCT proves to be a very efficient pathway for energy storage. The excited state landscape of the Mn2+ 3d5 electron configuration is assessed through the spin-correlated crystal field and a good correspondence with the emission and excitation spectra is found. In conclusion, studying phosphors at both a single-particle level (i.e. via calculation of defect formation energies) and a many-particle level (i.e. by accurately localizing the excited states) is necessary to obtain a complete picture of luminescent defects, as demonstrated in the case of CaZnOS:Mn2+.
1 Introduction
Calcium zinc oxysulfide (CaZnOS) can be considered as an atypical host compound for optical dopants, because not many host materials are known that have a mixed anion coordination polyhedron for the luminescent ion. In addition, CaZnOS crystallizes in polar crystals, which allows a nonzero internal electric field.1 Upon the incorporation of luminescent impurities, such non-centrosymmetric compounds can show mechanoluminescence (ML), which is the emission of light upon the application of pressure.2,3 For this to occur, energy has to be stored in the material first, presumably by trapping photo-ionized charge carriers. They can be released through a pressure-induced change of the internal electric field, eventually recombining radiatively at the ionized activator.2–5 ML has been demonstrated in undoped CaZnOS and is ameliorated upon doping it with Mn or Cu.6–10 ML can be generated by different types of mechanical stresses such as ultrasound and compressive stress.6–10 Thermoluminescence (TL) glow peaks in the neighborhood of 400 K were attributed to the same traps as those that might be responsible for ML.6 To date, no direct experimental evidence has been provided for this statement.Divalent manganese, Mn2+, is an activator ion that has gained popularity in phosphors in cathode ray tubes (CRT) or fluorescence lamps.11–15 With the breakthrough of LED technology for both lighting and displays, lanthanide ions such as Ce3+ and Eu2+ became the dopants of choice due to their superior performance for these applications.16–18 This is because Mn2+, although it can be very efficiently excited by cathode rays or UVC radiation (100–280 nm), has a low absorption strength for blue light, as required for LED applications. This is caused by the symmetry- and spin-forbidden nature of the intraconfigurational 3d5 transitions exciting the luminescence, i.e. the Laporte rule forbids electric dipole transitions where the parity of the total wavefunction is not changed and the excited states represent spin-quartets while the ground state is a spin-sextet.19,20 Very recently, however, Mn-based materials have again gained increased attention in the context of rare-earth-free LED phosphors. CaZnOS:Mn2+ was proposed as a red phosphor because the absorption strength of the 3d5 transitions appears to be unusually high compared to other Mn2+ based phosphors.21
In a series of two papers, Mn and Cu impurities and intrinsic defects in CaZnOS were studied by means of DFT+U calculations.22,23 This approach is expected to yield important insights, especially with respect to the impurity level locations of intrinsic and extrinsic defects, as these are experimentally hard to determine, while they are of utmost importance for the functional behavior of luminescent materials, e.g. ML in the considered case. The impurity level locations that were found for a large number of intrinsic defects form important pieces to solve the puzzle of ML in CaZnOS. The orange emission in CaZnOS:Mn2+ is explained from energy differences between Kohn–Sham single particle energy levels, referred to as “3d fine levels”, of different defects. This interpretation of Kohn–Sham levels yields results which contrast with the common interpretation of spectroscopic transitions as differences in the total energy between multiplets of the Mn ion. In particular, the energy difference between a single-particle level of a Schottky defect  with a singly negative Kröger–Vink charge and a single-particle level of
  with a doubly positive Kröger–Vink charge is 2.1 eV and hence labeled as the reason for the orange emission band in CaZnOS:Mn. Note that the doubly positive Kröger–Vink charge corresponds here to a Mn4+ ion in spectroscopic notation. This point of view asks for a solid investigation of the charge state and spectroscopy of Mn defects in CaZnOS.
Energy level schemes are a powerful tool for interpreting spectroscopy experiments. Spectral features are attributed to transitions from an initial to a final level. It is hence no surprise that this tool is widely used. A complication that arises for spectroscopists is the virtually infinite number of different theories that give rise to energy level schemes. These vary from user-friendly empirical rules to first principles calculations requiring exceptional computational power. In between these two extremes, effective theories can be found that each treat a certain part of the complicated quantum mechanical details in a coarse-grained fashion. Notwithstanding the vast number of available theories and in disregard of all the associated technical details, only two essentially different types of energy level schemes are found as a result, which are in the remainder referred to as band diagrams and multiplet schemes. Both schemes provide a different picture of reality, allowing the extraction of different physical and chemical properties. Both approaches are thus complementary, although they are written in different languages. It is however not straightforward, or even physically allowed, to combine them in some kind of hybrid form.
The band picture shows orbitals which can be filled, usually up to the Fermi level, or which can be empty. The description band originates from the dispersion that the energy levels show as a function of the wave vector of the electrons. Localized single-particle states do not show dispersion, and discrete levels rather than bands are found. Electronic transitions can be visualized in this scheme as particle-hole excitations, provided that both multiplet effects and geometric reorganization are negligible, which is usually not the case for transition metal or lanthanide impurities, obscuring the experimental meaning of the localized single-particle levels.24 Nevertheless, impurity levels in the experimental sense can be calculated as charge-state transition levels, i.e. the Fermi level location at which the thermodynamically most favorable charge state of the considered defect changes. Optical charge-state transition levels, corresponding to excitation without structural reorganization, can be probed from ligand-to-metal charge transfer transitions, often found in the excitation spectra of optical dopants. Thermodynamic charge-state transition levels, on the other hand, describe the shift between fully relaxed geometries, and are of importance in phenomena where charge carriers are ionized from the impurity ion such as in persistent luminescence, energy storage or mechanoluminescence. Identifying the impurity levels for different defects is therefore an important first step to improve the understanding of these phenomena. Charge-state transition levels can be calculated with good accuracy from defect formation energies.25–29 The latter can be obtained from density functional theory (DFT) as formation energy is a ground-state property. Empirical rules of thumb are available to localize the impurity levels of metal ions in dielectric hosts. Impurity levels originating from transition metal ions obey a universal trend with respect to the vacuum level.30 Despite the simplicity to apply these empirical energy level models, the uncertainties can be considerable and the physical interpretation is not straightforward, requiring additional more complex energy level models.31,32
Many-particle multiplet schemes show the ground and all excited states of the defect under consideration. Transition energies can then be calculated in a straightforward way by subtracting the total energy of final and initial states.33 An often used approximation to obtain total energy level schemes is to start from the multiplet structure of a free metal ion and to regard the surrounding host compound as a perturbation through the crystal field Hamiltonian. This simple model has turned out to be successful in describing the excited states of dN, fN and fN−1d1 configurations of transition metal, lanthanide and actinide impurities using a small number of empirical parameters.19,34–36 These crystal field parameters can be calculated in a large number of theoretical frameworks featuring different levels of detail, depth and theoretical foundation. Examples are the exchange charge,19,37 angular overlap38,39 and superposition models40 and the more recently developed ligand field DFT (LFDFT).41–45 Multireference calculations demand more computational resources and user experience, but immediately yield multiplet schemes without depending on the assumptions of crystal field Hamiltonians. These calculations have led to deep insights into the dynamics of specific systems.32,46–49
In the present work, single-particle schemes exhibiting impurity levels, obtained by DFT and many-particle schemes, obtained by crystal field theory, are employed to study the different features in the photoluminescence spectra of CaZnOS:Mn in great detail, allowing for an unambiguous assignment of the different bands and lines. This analysis includes the identification of the local vibrational modes, i.e. phonons, that assist the electronic transition. The knowledge that is acquired from the spectroscopic investigation is subsequently applied to study the peculiar behavior of this functional material. Thermoluminescence glow curves are studied upon excitation into various spectral features, providing important information on the nature of the defects that act as traps for charge-carriers thanks to the prior spectral analysis. Subsequently, mechanoluminescence is measured as a function of temperature, providing new insights into this phenomenon and its relation to the trap levels that are found from thermoluminescence.
2 Experimental method
CaZnOS powders were prepared using a solid state reaction, starting from CaCO3 (Alfa Aesar, 99.95%) and ZnS (Alfa Aesar, 99.99%). The mixed precursors were heated to 1000 °C in a nitrogen atmosphere and kept there for 12 h. Manganese doping was achieved by adding a small amount of MnCO3 (Alfa Aesar, 99.9%) or MnS (Cerac, 99.9%) to the mixture. After heat treatment, the samples were allowed to cool naturally, before slight grinding. The phase purity of the materials was checked using powder X-ray diffraction (PXRD), utilizing CuKα1 radiation on a Siemens D5000 diffractometer (40 kV, 40 mA). The reported experiments were performed on powders with a nominal Mn molar concentration of 0.5%.X-ray absorption spectroscopy (XAS) was performed at the Mn K edge at the Dubble beamline (BM26A) of the ESRF synchrotron facility in Grenoble (France). A silicon (1 1 1) double crystal monochromator was used. Both XANES (X-ray absorption near edge spectroscopy) and EXAFS (extended X-ray absorption fine structure) were recorded in fluorescence mode.50 The atomic positions in the first coordination shells of the Mn atom were fitted by means of the FEFF6 code using the Athena and Artemis software by Ravel and Newville.51
Various techniques were used to assess the optical and luminescence properties of the powders. Diffuse reflectance spectra were recorded using a Varian Cary 500 spectrophotometer, equipped with an internal 110 mm BaSO4-coated integrating sphere. Photoluminescence emission and excitation spectroscopy was performed on an Edinburgh FS920 fluorescence spectrometer. To study the temperature dependency of luminescence, an Oxford Optistat CF cryostat was used. Thermoluminescence profiles were measured with the same setup upon a linear temperature increase of 10 K min−1. In this case, a sample which was heated beforehand, emptying all traps in the studied temperature range, was excited for a sufficiently long time allowing the system to achieve a dynamical equilibrium between filling and emptying of traps.
The CaZnOS:Mn powder was fixated in a silicon resin for measurement of the mechanoluminescence intensity. These measurements were performed by scratching the films and simultaneously collecting the emitted light using an optical fiber. The light was guided to a ProEM1600 EMCCD camera attached to an Acton SP2300 monochromator (Princeton Instruments). The reproducibility of this measurement procedure was validated and the associated uncertainty estimated at 10% of the measured intensity.
3 Computational method
Two different computational methods were explored to assess the electronic structure of the material under study, density functional theory (DFT) and crystal field theory (CFT). In this section, both methods are briefly introduced. For more details on how the calculations were performed and which settings were used, we refer to the ESI† (Section S1).The band structure of the host material and the impurity levels introduced by the defect were calculated in the framework of density functional theory (DFT). The projector-augmented wave (PAW) method was used as implemented in the Vienna Ab Initio Simulation Package (VASP).52–54 A generalized gradient approximation (GGA) was utilized in the form of the Perdew–Burke–Ernzerhof (PBE) functional,55 supplemented by an on-site Coulomb interaction, parameterized according to a Hubbard Hamiltonian.56 Defective supercells were simulated in order to calculate the defect formation energies for the different possible charge states of the dopant.29 These values can be used to obtain the locations of the charge-state transition levels, i.e. the impurity levels. An extrapolation scheme due to Janotti and Van de Walle was applied to obtain a band diagram that displays the experimental band gap value, circumventing the self-interaction error of DFT and the arbitrary choice of the Hubbard U parameter.26,29,57 More details on the settings of the calculation and how defect formation energies are defined and applied to the calculation of impurity levels can be found in the ESI† (Section S1.1).
Many-particle multiplet schemes are obtained by fitting a crystal field Hamiltonian to the experimental photoluminescence spectra. The effective Hamiltonian, describing the multiplets associated with the 3d5 manifold of Mn2+ is composed of terms which factorize in an analytically calculable angular integral and a radial integral for which no analytical expression is available. The latter are thus obtained from the fit. The ESI† (Section S1.2) provides more information on which terms are applied to fit the spectrum of Mn2+. Next to the standard terms, the spin-correlated crystal field is applied in this work. Details on the origin of this additional interaction term are likewise discussed in the ESI† (Section S1.2). The calculations are performed by means of an in-house developed Python program.58
4 Results and discussion
4.1 Crystal structure and incorporation of Mn in CaZnOS
CaZnOS forms hexagonal crystals consisting of alternating layers of Zn–S and Ca–O and belongs to the non-centrosymmetric space group P63mc.1,59 The zinc atoms are coordinated by one oxygen and three sulfur atoms in a deformed tetrahedron of symmetry C3v, while the calcium atoms are coordinated by three sulfur and three oxygen atoms in a deformed octahedron of symmetry C3v.1 Density functional calculations at the PBE and PBE+U levels were performed to optimize the unit cell of CaZnOS. Good correspondence was achieved between the experimental and calculated geometries (see Table 1).There are two straightforward possibilities for the manganese dopant to incorporate in the oxysulfide structure, by substituting for a zinc or calcium cation, forming a MnZn or a MnCa defect, respectively. Duan et al. presumed the former case to be most plausible due to the similar ionic radii of Zn2+ (60 pm) and Mn2+ (66 pm), compared to Ca2+ (100 pm).21,60 The defect formation energies can be calculated by considering that μMn is equal to the energy of Mn in a reference state, i.e. the manganese reservoir.29 Given the above-described physical reality of the crystal structure, MnS was chosen as the reference state to calculate the formation energy of the MnZn defect. Analogously, ZnS was chosen as the reference state for Zn. Conversely, MnO and CaO were chosen as reference compounds regarding the MnCa defect. A more elaborate discussion on the chemical stability of the CaZnOS compound itself is provided in the ESI† (Section S2).
Our DFT calculations confirm the assumption of Duan et al. that the Mn dopants are found at the Zn site. The MnZn defect has a slightly lower defect formation energy for all possible Fermi level locations (see further). Upon incorporation, the volume of the MOS3 coordination polyhedron is slightly increased, in correspondence with the higher ionic radius of Mn2+.60 The shape and dimensions of the polyhedron are shown in Fig. 1 and Table 2. EXAFS was used to probe the details on the geometry of the nearby environment of the probed element. The analysis of the Mn K edge EXAFS spectrum was used as an experimental verification of the calculated preference for the incorporation of the Mn ion.
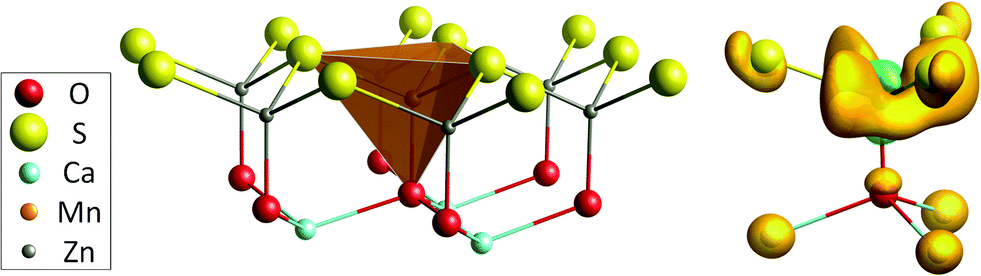 | ||
| Fig. 1 Left: Coordination environment for the MnZn defect in CaZnOS. In this figure, the layered Zn–S/Ca–O structure of the oxysulfide host is clearly visible. Right: Difference in electron density for the MnZn defect, before and after the ligand-to-metal charge transfer, calculated with PBE+U. The orange and green isosurfaces correspond to charge density differences of 0.0019 e−3 and −0.0019 e−3, respectively. | ||
| ZnOS3 (DFT) | ZnOS3 (PXRD1) | MnOS3 (DFT) | MnOS3 (EXAFS) | |
|---|---|---|---|---|
| Volume (Å3) | 5.678 | 5.826 | 6.380 | |
| d av (Å) | 2.234 | 2.254 | 2.322 | 2.325 ± 0.009 |
| d O (Å) | 1.865 | 1.900 | 1.968 | 2.001 ± 0.019 |
| d S (Å) | 2.357 | 2.372 | 2.440 | 2.445 ± 0.006 |
 (°) (°) |
113.83 | 113.85 | 112.83 | |
 (°) (°) |
105.92 | 104.76 | 105.92 |
Fig. 2 shows the Fourier transform of the EXAFS spectrum compared to the fitted profile, based on the deformed tetrahedral coordination of MnZn. A similar profile, based on the deformed octahedral coordination of MnCa, was not able to reproduce the experimental data (not shown). Linearly combining both models showed indeed that tetrahedrally coordinated Mn dominates the spectrum and that the component originating from octahedrally coordinated Mn can be safely neglected. The parameters of the tetrahedral model were subsequently optimized in order to reproduce the experimental spectrum. Bond lengths could be estimated from the fit, which was restricted to the first two coordination shells as indicated by the grey window in Fig. 2. They are shown in Table 2 and are in good agreement with the DFT values. The presence of the pre-edge peak in the XAS spectrum (see inset Fig. 2) also hints towards tetrahedral coordination.61
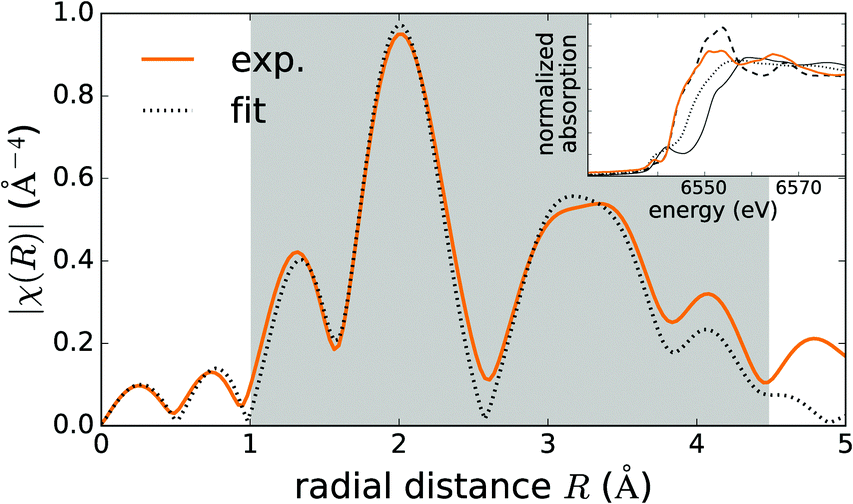 | ||
| Fig. 2 Fourier transform of the Mn K-edge EXAFS spectrum of CaZnOS:Mn (orange, solid line), compared to the fit, based on a tetrahedral MnZn defect model (black, dotted line). The grey window indicates where the deviations between the two curves were minimized. The inset shows the XAS spectra in the Mn K-edge XANES region of CaZnOS:Mn (orange, solid line), compared to the Mn(II) (black, dashed line), Mn(III) (black, dotted line) and Mn(IV) (black, solid line) oxides. | ||
Even though the DFT calculations and the EXAFS experiments show that the Mn dopants are incorporated in the Zn site for the low doping concentration of 0.5 molar%, it cannot be excluded that some Mn will incorporate in the Ca site when the doping concentration is increased. Huang et al. used this argument to explain the redshift of the emission spectrum for increasing Mn concentration.23 This is a plausible explanation to understand the redshift for increasing Mn concentration as a higher coordination number gives rise to a higher crystal field strength and hence a redshift in the case of Mn2+ (see also the discussion on the Tanabe–Sugano diagram in Section 4.3).15,62 An alternative reason for the redshift upon increasing the concentration is the interaction between neighboring Mn ions, as proposed by Zhang et al. for CaZnOS:Mn2+.10 This effect was also found to be responsible for the redshift of the Mn2+ emission in Zn2SiO4.63,64
4.2 Electronic properties
Upon studying the electronic structure of phosphors, the first important parameter pertains to the undoped host crystal, i.e. the band gap which determines the absorption spectrum of this material in the visible and near UV spectral region. This parameter can be determined using UV-VIS spectroscopy as well as calculated with DFT. Upon doping with transition metal ions such as Mn, impurity levels are formed in the band gap. The locations of these impurity levels are calculable with DFT and are closely connected to the energy of charge transfer bands that can occur in the optical spectra.Both PBE and PBE+U calculations give rise to a Kohn–Sham band gap which is lower than the experimental value (see Table 1). This is however within the expectations given the well-known self-interaction error of DFT. To account for this underestimation and, more importantly, to predict in which sense this affects the locations of the calculated impurity levels, an extrapolation scheme26,29,57 (see Section S1.1 from the ESI†) was applied in the following. Assigning additional Hubbard U parameters to the np electrons of sulfur and oxygen can open the calculated band gap even further.22
 or
or  defect corresponds to a Mn2+ ion according to spectroscopic notation. It is apparent from the figure that the MnZn defect has the lowest defect formation energy for most Fermi level locations and is hence expected to be the Mn defect found in reality. This is in line with the expectations given the similar ionic radii of Zn2+ and Mn2+. Only for high chemical potentials for the electrons, i.e. when the Fermi level approaches the conduction band bottom, can it be energetically favorable to form negatively charged MnCa defects.
 | ||
| Fig. 3 Defect formation energies for MnQZn and MnQCa (the value of Q is indicated in the figure) as a function of the Fermi level location in CaZnOS (left). The secants of the straight lines correspond with the physical impurity levels, i.e. charge-state transition levels. The obtained impurity levels are shown in a conventional band diagram, representing the host referred and vacuum referred binding energies, HRBE and VRBE (right). The results were obtained by extrapolating PBE+U calculations (see ESI,† Section S1.1). | ||
For both defects, the lowest charge-state transition level within the band gap is the ε(0/−1) (or Mn2+/Mn+) level, lying 3.32 eV and 2.99 eV above the valence band maximum for MnZn and MnCa, respectively. The physical significance of this level is that when the electron chemical potential is below ε(0/−1), manganese will be stable in the Mn2+ ( ) charge state, while the defect will be stabilized in the Mn+ (
 ) charge state when the chemical potential is above the impurity level. The experimental charge state of the Mn dopant could be obtained from the XANES spectrum. The inset of Fig. 2 shows the measured Mn K-edge XANES spectrum of CaZnOS, compared to the Mn(II), Mn(III) and Mn(IV) oxides MnO, Mn2O3 and MnO2. For the former, good correspondence with the K-edge location is found, while this is not the case for the latter two, implying a predominant occurrence of Mn in the divalent state in CaZnOS. It is hence unlikely that tetravalent Mn is formed in CaZnOS as required by the theory for ML as given in ref. 23.
The impurity levels are thermodynamic transition levels, meaning that they were calculated for optimized geometries in both charge states. These levels are therefore involved in slow processes, i.e. where the system has time to adapt itself to the external factors. An example is the path towards chemical equilibrium during the synthesis of the material, possibly by oxidizing or reducing the impurities. In the case of optical ligand-to-metal charge transfer transitions (LMCT), a thermodynamic transition level corresponds to the energy of the zero phonon line (ZPL):
| ECT = Etot(A:XQ+1) − Etot(A:XQ) = ε(0/−1) | (1) |
Fig. 1 (right) shows the difference in the electron density between both charge states, i.e. the shift in electron density during optical absorption. It is clear that the additional charge is spatially spread out around the Mn defect. This is in accordance with the prediction of Haldane and Anderson of self-regulating behavior which states that the effective charge of a transition metal remains close to neutrality whatever its valence due to hybridization with valence band states, allowing the additional charge to be localized further away from the transition metal.67–70
It should be emphasized that the calculated charge-state transition levels do not coincide with Kohn–Sham eigenvalues (density of states, DOS) in the forbidden band for the defect of neutral charge. The former have a clear experimental meaning as described above while this is less clear for the latter.29 Notwithstanding their difficult interpretation, Kohn–Sham levels of uncharged supercells are sometimes regarded as physical impurity levels of transition metals or lanthanide impurities, motivated by the lower computational cost compared to the full defect formation energy as described above. A correspondence between Kohn–Sham eigenvalues and charge-state transition levels can be found thanks to Janak's theorem and the assumption that Kohn–Sham eigenvalues are linear functions of the fractional occupation number.71 In this case, the eigenvalues are still needed for the different charge states of the supercell, unless it is additionally assumed that the eigenvalues are not altered upon changing the occupation number.28,72,73 The latter approximation is reasonable for infinite systems, but doubtful in the case of the localized d or f states of transition metal or lanthanide impurities in insulators. In contrast, it has been shown that Kohn–Sham levels can provide qualitative insights into the occupation of defects and defect clusters.74
4.3 Spectroscopic properties
To date, only ground state properties of the CaZnOS:Mn2+ phosphor are addressed. To understand the physical processes behind the luminescence behavior, knowledge on the excited states of the 3d5 configuration of Mn2+ is required. DFT can only describe those states that correspond to the lowest energy state for different symmetry classes. Examples are the calculation of the ZPL energy of the emitting transition of Mn4+, or the energy of the lowest 4fN–4fN−15d1 transition in some lanthanide-based scintillators by forcing the system into an orbital occupation which does not correspond to the lowest energy.75–77 Here, all the multiplets originating from the 3d5 configuration are however required and for this reason, the focus is changed towards crystal field theory (CFT), which can describe all excited states of a certain electronic configuration. Electron–phonon coupling is taken into account to discuss the CFT results in a rational way. The coupling is quantified based on the vibronic fine structure of the emission spectrum and the phonon density of states, obtained from DFT. | ||
| Fig. 4 Photoluminescence emission (upon excitation at 280 nm, orange lines) and excitation spectra (when monitoring the emission at 610 nm, black lines) of CaZnOS:Mn2+, measured at room temperature (a) and at 4.5 K (b). The vertical lines indicate the locations of the excited multiplets for the ground state geometry of the defect cluster, as obtained from the CFT optimization. The green and red colors denote a total spin of S = 4 and S = 2 respectively. The charge transfer transition is indicated by *. | ||
The high-energy band below 315 nm originates most probably from fundamental absorption in the CaZnOS host with subsequent energy transfer to the Mn defect. This band has a shoulder at 338 nm, which is clearly resolved at low temperature. It is reasonable to assign this band to the LMCT that was predicted from the DFT calculations. The thermodynamic charge-state transition level lies 3.32 eV above the valence band top, while the maximum of the excitation band is found at 3.78 eV. The energy difference of 0.43 eV is perfectly consistent with half of the typical values for the Stokes shift associated with LMCT transitions.78
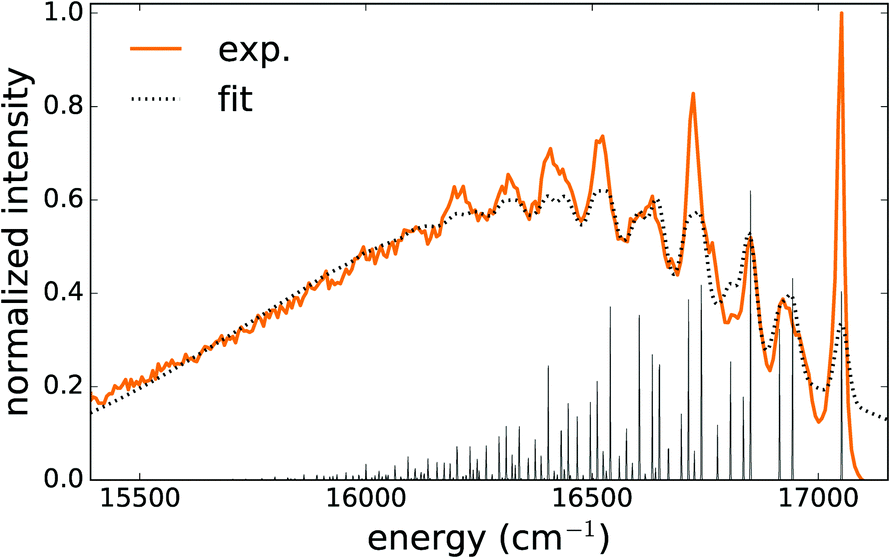
The low temperature PL spectra are shown in Fig. 4b, where a fine structure emerges in both the emission and excitation spectra. In the emission spectrum, the zero phonon line at 17![[thin space (1/6-em)]](https://www.rsc.org/images/entities/char_2009.gif) 051 cm−1 (586.5 nm) stands out and comes with a detailed vibrational fine structure, clearly containing multiple active modes. The Stokes shift amounts to 1550 cm−1 (0.19 eV). In the excitation spectrum, the transitions from the 3d5(6S5/2) ground state towards the different excited 3d5 multiplets are well-resolved along with some vibrational progressions. The fine details of the low temperature spectrum allow us to fit a crystal field Hamiltonian to the experimental transition energies (see Section 4.3.2).
051 cm−1 (586.5 nm) stands out and comes with a detailed vibrational fine structure, clearly containing multiple active modes. The Stokes shift amounts to 1550 cm−1 (0.19 eV). In the excitation spectrum, the transitions from the 3d5(6S5/2) ground state towards the different excited 3d5 multiplets are well-resolved along with some vibrational progressions. The fine details of the low temperature spectrum allow us to fit a crystal field Hamiltonian to the experimental transition energies (see Section 4.3.2).
The thermal quenching of the emission upon excitation in the different excitation bands was measured (not shown). While the intraconfigurational 3d5 transitions remain stable between low temperature and room temperature, the broad excitation bands at higher energy show severe thermal quenching, resulting in the relative intensity difference between both spectra in Fig. 4. This suggests the existence of a nonradiative decay channel near the higher-lying excited states, which requires only a small amount of thermal energy.
300–19800 cm−1 correspond to transitions from the 6A1 ground state to the 4T1 and 4T2 crystal field states originating from the 4G Russell–Saunders term. Because excitation to the 4T1 and 4T2 states induces geometric relaxation of the nuclear positions in the Mn defect cluster, the maximum values of the excitation bands are used to fit crystal field parameters rather than the ZPL in order to obtain a more reliable result for the ground state situation.
Other crystal field states originating from the 4G term are 4A1 and 4E, which are accidentally degenerate in Td and Oh symmetries. In contrast to the former two excitations, the latter two transitions correspond to a sharp peak. This can be intuitively interpreted in terms of the independent particle configurations in the high crystal field limit. Electrons do not change the orbital for 6A1 → (4A1, 4E) transitions as both the initial and final states originate from the e2t23 configuration while an electron is transferred from a t2 orbital to an e orbital in the case of excitation to the 4T1 or 4T1 state, which originate from the e3t22 configuration. This argument can be derived from the modified Tanabe–Sugano diagram in Fig. 5. In this figure, the popular convention is adapted to use 10Dq, single-particle crystal field splitting. It is related to the Wybourne parameter B40 = −14/10 × 10Dq for Td fields.80
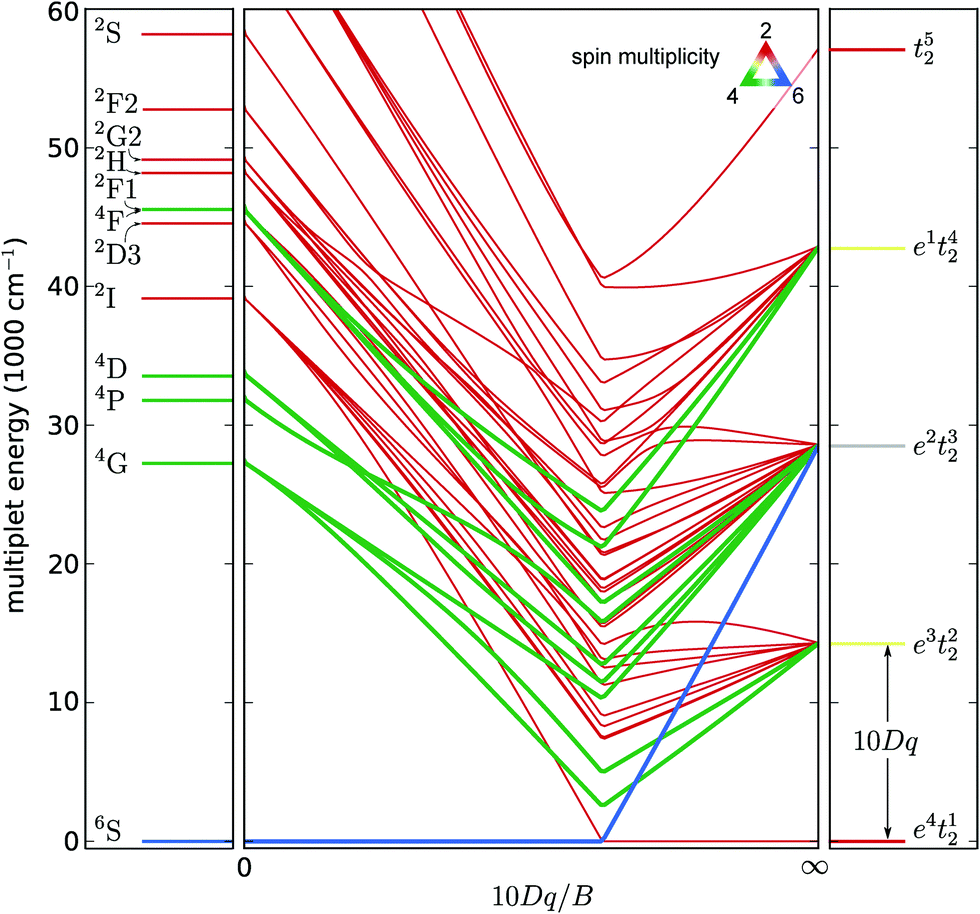 | ||
| Fig. 5 Tanabe–Sugano diagram for a nd5 configuration, showing the variation of the multiplets from the weak-field limit (labeled by the atomic term symbols) to the strong-field limit (labeled by the single-electron occupation numbers of the crystal field orbitals) limits. The color of the lines represents the spin doublet (S = 1/2, red), quartet (S = 3/2, green) or sextet (S = 5/2, blue) characters of the states. The energy scale was chosen to correspond to the correct values in the free ion limit. | ||
Higher lying excited states visible in the excitation spectrum are the 4T2 and 4E states originating from the 4D term. In the same energy region, crystal field states originating from the 2I term can be found. These are however not visible in the excitation spectrum because of the larger difference in the spin quantum number S with respect to the ground state.
In the ESI† (Section S3), it is shown that a good description of the experimental PL spectrum can only be obtained when non-spherically symmetric electron correlation is taken into account. This is done in terms of the spin-correlated crystal field, introducing only one additional empirical parameter, c4. Therein, it is argued that the high Td symmetry of the effective Hamiltonian yields a sufficiently good description. Accounting for the lower C3v symmetry would introduce too many empirical parameters to achieve a reliable fitting.
Furthermore, the ratio of Racah parameters is kept fixed at the conventional value C/B = 4 and the experimental Trees parameters for the free Mn2+ ion are used for the calculation. A remarkably good correspondence between calculated and experimental transition energies is obtained as shown in Fig. 4 and Table 3, with a standard deviation σCF of 198 cm−1. The optimal parameters for the effective Hamiltonian are summarized in Table 4.
| Term | T d | C 3v | Calc. (cm−1) | Exp. (cm−1) |
|---|---|---|---|---|
| 6S | 6A1 | 6A1 | 0 | 0 |
| 4G | 4T1 | 4A2⊕4E | 17774 |
17826 (ZPL: 17051) |
| 4T2 | 4A1⊕4E | 19342 |
19456 |
|
| 4E | 4E | 20019 |
20061 |
|
| 4A1 | 4A1 | 20939 |
20705 |
|
| 4D | 4T2 | 4A1⊕4E | 22688 |
22549 |
| 4E | 4E | 24839 |
25002 |
|
| 4P | 4T2 | 4A1⊕4E | 24840 |
 | ||
| Fig. 6 Low temperature (4.5 K) emission spectrum (excitation at 280 nm (35700 cm−1)) of CaZnOS:Mn, solid line. The dotted line shows the calculated multiphonon vibronic spectrum according to eqn (S8) (ESI†). The spikes show the locations and intensities of the individual terms in eqn (S8) (ESI†), i.e. without broadening. | ||
It was possible to get a reasonable fit when three vibrational modes were taken into account in the first term of eqn (S7) (ESI†). The result is shown in Fig. 6 and the obtained phonon energies are summarized in Table 5. Statistical analysis of the performed fit reveals a strong correlation between the parameters belonging to the average mode Ω, SΩ and σΩ, which corrupts an accurate determination of these parameters. On the other hand, the parameters belonging to the local vibrational modes can be determined with good accuracy (Table 5).
| Mode | Frequency (cm−1) | S | σ (cm−1) |
|---|---|---|---|
| ω 1 | 108.5 ± 0.4 | 0.96 ± 0.03 | 13.9 ± 0.3 |
| ω 2 | 137.2 ± 0.5 | 0.71 ± 0.03 | 13.9 ± 0.3 |
| ω 3 | 201.4 ± 0.2 | 1.33 ± 0.02 | 13.9 ± 0.3 |
| Ω | 131 ± 44 | 1.6 ± 0.6 | 500 ± 197 |
As a means of comparison, the phonon density of states was calculated for the PBE+U optimized supercell in the Γ-point to identify the modes corresponding to an isolated Mn defect. Upon projecting this phonon DOS on the Mn defect, Fig. 7 is obtained. In this figure, the experimental phonon energies from the Mn2+ emission spectrum (Table 5) are added. This comparison shows that the three experimental modes indeed correspond to the peaks in the phonon DOS with less than 10 cm−1 deviation, which is in line with the previously documented accuracy of Γ-point phonon frequency predictions.85–87 The modes corresponding to the other peaks in the phonon DOS might contribute to the luminescence spectrum as well, but extracting them from the fit, eqn (S8) (ESI†), is impossible without overparameterization.
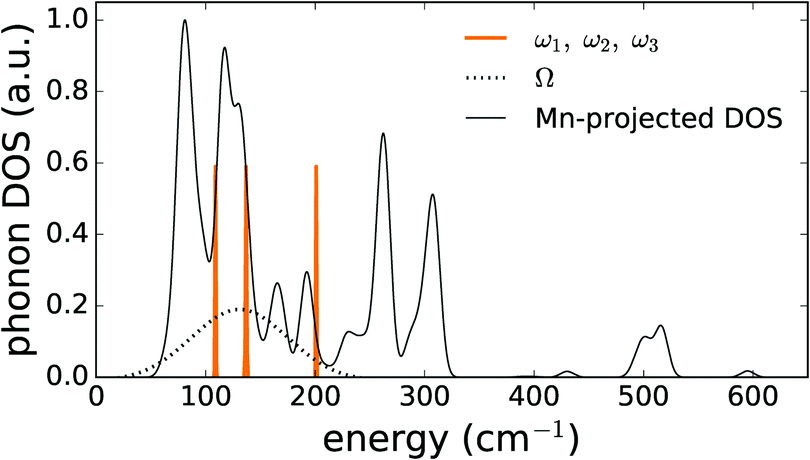 | ||
| Fig. 7 PBE+U phonon density of states, projected on the MnZn defect in CaZnOS, compared to the experimentally obtained phonon energies. The uncertainties on the experimental energies were used as bandwidth in this plot. | ||
This analysis demonstrates that the shape of the emission band of CaZnOS:Mn2+ is due to the electron–phonon interaction, instead of claims that the band widths are found from transitions towards consecutive single-particle Kohn–Sham levels from a single-point DFT calculation.23
4.4 Thermoluminescence and mechanoluminescence
Thermoluminescence (TL) is a valuable tool to evaluate the density and depth of the traps involved in energy storage processes. Quite often, a TL study is performed after illumination with a single wavelength or with a broad spectral distribution (e.g. from a Xe discharge lamp). Studying the wavelength dependency of the trap filling can however provide relevant information on the trapping routes.88–90Here, TL glow curves were obtained after exciting the CaZnOS:Mn phosphor in its various excitation bands. The results are shown in Fig. 8 and correspond to excitation by intraconfigurational 3d5 transitions (at 500 nm and 440 nm to the crystal field levels of the 4G and 4D terms, respectively), the ligand-to-metal charge transfer (at 328 nm) and fundamental absorption in the CaZnOS host (at 280 nm). The four TL profiles were rescaled in order to make the high-temperature tail coincide. The absolute intensities of the different profiles differ over three orders of magnitude and are shown in the inset.
 | ||
| Fig. 8 Thermoluminescence (TL) profiles of CaZnOS:Mn upon excitation with various wavelengths at 75 K, obtained by heating the phosphor at 10 °C min−1. The TL profiles were normalized such that the high-temperature tails coincided. The absolute intensities of the integrated TL profiles are shown on a logarithmic scale in the bar diagram in the inset. The data points display the mechanoluminescence intensity as a function of the temperature of the thermal cleaning of the CaZnOS:Mn sample before applying pressure, indicating up to which level traps are emptied. The horizontal line serves as a guide to the eye. | ||
Upon inspection of the TL results, some features immediately stand out. The nature of the traps that can be reached upon nonlocal or local excitation is clearly different, as evidenced by the different TL profiles after fundamental absorption (280 nm) on the one hand and after local excitation of the MnZn defect, be it through the LMCT (328 nm) or 3d5–3d5 transitions (440 nm and 500 nm), on the other hand. Traps that are in the near vicinity of the MnZn defect give rise to rather narrow TL bands, peaking around 240 K and 350 K while more shallow traps can be adressed after fundamental absorption, corresponding to a TL band peaking at 125 K and two broader TL bands that span the full temperature range.
Furthermore, the trapping efficiency differs significantly between the different routes, corresponding roughly to a factor of 40 between nonlocal traps and local traps that are reached after LMCT absorption (see inset of Fig. 8). As it was ensured that the phosphor was saturated after charging, the effects of different excitation fluxes and excitation efficiencies at different wavelengths are not expected to account for the observed intensity difference. This indicates that the traps which are significant for the TL behavior are found close to the MnZn defect and that charging is most effectively done through charge transfer excitation. This also implies that when the electronic structure of the traps which are responsible for TL is studied, one ideally has to consider defect clusters, taking into account the MnZn defect as well as the nearby intrinsic (or extrinsic) defect in the same computation. Defect clusters after all yield a different local electronic structure than individual defects as evidenced by the different TL curves in Fig. 8 and various computational and experimental studies.47,74,91,92
In order to investigate whether the same (local) traps are responsible for thermoluminescence and mechanoluminescence (ML), the intensity of the latter was recorded as a function of the temperature of thermal cleaning in between charging (by a Hg lamp) and the application of pressure. During thermal cleaning, the sample is heated to a specified temperature, emptying occupied traps up to an associated depth. In this way it is possible to study the connection between the traps involved in ML and those in TL. The result is shown by the data points in Fig. 8. Within the experimental accuracy, the ML intensity remains constant in the available temperature range, i.e. a bright mechanoluminescence is still observed after the CaZnOS:Mn phosphor was kept at 470 K for a significant time. This implies that the traps which are responsible for the ML in CaZnOS:Mn have a different nature than the traps that are responsible for TL or that the ML mechanism itself is different, in contrast to previous assumptions.6,23,93 Extending the current experiment to higher temperatures might reveal the true origin of the mechanoluminescence.
The ML emission spectrum was found to be identical to the PL emission spectrum. This implies that the ML emission is the result of the 3d5 4G(4T1) → 3d5 6S(6A1) transition as described in Section 4.3.2 and is opposed to the finding in ref. 23 that the emission is due to an electron transfer from an isolated  Schottky defect to an isolated
  defect.
Its resistance to high working temperatures is a unique feature of CaZnOS:Mn2+ which is absent for alternative ML phosphors such as BaSi2O2N2:Eu2+ or SrAl2O4:Eu2+,Dy3+, unlocking potential technological applications for CaZnOS:Mn under circumstances where the more traditional ML phosphors cease to work.
5 Conclusions
This work featured a combined experimental–theoretical investigation of the insulating material CaZnOS and the luminescent material CaZnOS:Mn2+. A single-particle band diagram and a many-particle multiplet energy level scheme of the Mn defect were constructed and discussed in order to explain the various spectral features which are important for the functional behavior of the material.The optical band gap of 4.27 eV makes CaZnOS a suitable compound for optical dopants. DFT calculations and XAS measurements were used to show that manganese occupies a zinc site in the inorganic host, forming a neutral  defect.
Band diagrams and the associated impurity levels were obtained from defect formation energies, calculated for large supercells. The thermodynamic impurity level (0/−) is formed in the forbidden band of CaZnOS, predicting a charge transfer transition, which was spectroscopically verified in the expected energy range.
The experimental low-temperature photoluminescence spectrum was well-resolved, allowing a precise determination of the multiplet energies of the 3d5 electron configuration. An effective crystal field Hamiltonian was fitted to the experimental spectrum yielding a small deviation of only 198 cm−1 upon inclusion of the spin-correlated crystal field.
Three local phonon energies could be accurately extracted from the low temperature emission spectrum, which were reproduced by the PBE+U calculation within 10 cm−1.
Thermoluminescence glow curves were obtained upon charging through the different features in the excitation spectrum. This shows that different types of traps are addressed when exciting the host itself or locally at the activator site. Furthermore, the excitation band which was attributed to the ligand-to-metal charge transfer by the DFT study turns out to be a very efficient route for trapping and subsequent thermoluminescence.
Given that thermal treatment up to 473 K does not influence the ML response, it is concluded that the underlying mechanism is different from the mechanism underlying the TL behavior, rejecting the prior assumption that the same traps are responsible for ML as for the TL peaks around 400 K. ML is hence governed by deeper traps, which can be local or nonlocal, or by a completely different mechanism that is yet to be resolved.
This case study demonstrated that a correct interpretation of different types of energy level schemes can improve the current understanding of luminescent materials and processes, without the need for ambiguous or meaningless hybrid energy level schemes, paving the way for discovering new functional materials through thoughtful engineering.
Acknowledgements
JJJ thanks the agency for Innovation by Science and Technology (IWT) for financial support (grant 121024). PFS and DP are grateful to the IWT for a SBO-IWT grant (SB0130030). Computational resources and services were provided by the Stevin Supercomputer Infrastructure of the Ghent University and by the Flemish Supercomputer Center (VSC), funded by the Hercules foundation and the Flemish Government-Department EWI. Synchrotron measurements were performed at the Dutch-Belgian beamline (DUBBLE, BM26A) at the European Synchrotron Radiation Facility (ESRF) in Grenoble (France). This work benefited from financial support from the Research Board of Ghent University (BOF), the Research Foundation – Flanders (FWO) and BELSPO in the frame of IAP-PAI P7/05. Olivier Janssens is acknowledged for the assistance with the XRD measurements. Simon Michels and Heleen Sijbom are thanked for assisting in the synchrotron data collection.References
- T. Sambrook, C. F. Smura, S. J. Clarke, K. M. Ok and P. S. Halasyamani, Inorg. Chem., 2007, 46, 2571–2574 CrossRef CAS PubMed.
- B. P. Chandra, J. Lumin., 2011, 131, 1203–1210 CrossRef CAS.
- B. P. Chandra, V. D. Sonwane, B. K. Haldar and S. Pandey, Opt. Mater., 2011, 33, 444–451 CrossRef CAS.
- B. Chandra, C. Xu, H. Yamada and X. Zheng, J. Lumin., 2010, 130, 442–450 CrossRef CAS.
- B. Chandra, V. Chandra and P. Jha, Phys. B, 2015, 461, 38–48 CrossRef CAS.
- J.-C. Zhang, C.-N. Xu, S. Kamimura, Y. Terasawa, H. Yamada and X. Wang, Opt. Express, 2013, 21, 12976–12986 CrossRef CAS PubMed.
- D. Tu, C. N. Xu, Y. Fujio, S. Kamimura, Y. Sakata and N. Ueno, Appl. Phys. Lett., 2014, 105, 011908 CrossRef.
- D. Tu, C. N. Xu, Y. Fujio and A. Yoshida, Light: Sci. Appl., 2015, 4, e356 CrossRef CAS.
- D. Tu, C. N. Xu, Y. Fujio and A. Yoshida, J. Phys. D: Appl. Phys., 2015, 48, 475105 CrossRef.
- J. C. Zhang, L. Z. Zhao, Y. Z. Long, H. D. Zhang, B. Sun, W. P. Han, X. Yan and X. S. Wang, Chem. Mater., 2015, 27, 7481–7489 CrossRef CAS.
- F. A. Kröger, Some Aspects of the Luminescence of Solids, Elsevier Publishing Company, 1948 Search PubMed.
- H. C. Froelich, J. Electrochem. Soc., 1948, 93, 101–113 CrossRef.
- H. H. Haft and W. A. Thornton, J. Illum. Eng. Soc., 1972, 2, 29–35 CrossRef.
- W. Lehmann, J. Electrochem. Soc., 1972, 130, 426–431 CrossRef.
- S. Shionoya, W. Yen and H. Yamamoto, Phosphor Handbook, CRC Press, 2006 Search PubMed.
- P. F. Smet, A. B. Parmentier and D. Poelman, J. Electrochem. Soc., 2011, 158, R37–R54 CrossRef CAS.
- Z. Xia and A. Meijerink, Chem. Soc. Rev., 2017, 46, 275–299 RSC.
- S. Abe, J. J. Joos, L. I. D. J. Martin, Z. Hens and P. F. Smet, Light: Sci. Appl., 2017, 6, e16271 Search PubMed.
- N. Avram and M. Brik, Optical Properties of 3d-Ions in Crystals: Spectroscopy and Crystal Field Analysis, Springer, 2013 Search PubMed.
- D. Newman and B. Ng, Crystal Field Handbook, Cambridge University Press, 2007 Search PubMed.
- C. J. Duan, A. C. A. Delsing and H. T. Hintzen, Chem. Mater., 2009, 21, 1010–1016 CrossRef CAS.
- B. Huang, Phys. Chem. Chem. Phys., 2016, 18, 25946–25974 RSC.
- B. Huang, D. Peng and C. Pan, Phys. Chem. Chem. Phys., 2017, 19, 1190–1208 RSC.
- K. Kikoin and V. Fleurov, Transition Metal Impurities in Semiconductors: Electronic Structure and Physical Properties, World Scientific, 1994 Search PubMed.
- C. Persson, Y. J. Zhao, S. Lany and A. Zunger, Phys. Rev. B: Condens. Matter Mater. Phys., 2005, 72, 035211 CrossRef.
- A. Janotti and C. G. Van de Walle, Phys. Rev. B: Condens. Matter Mater. Phys., 2007, 76, 165202 CrossRef.
- H. Raebiger, S. Lany and A. Zunger, Phys. Rev. B: Condens. Matter Mater. Phys., 2009, 79, 165202 CrossRef.
- A. Chakrabarty and C. H. Patterson, J. Chem. Phys., 2012, 137, 054709 CrossRef PubMed.
- C. Freysoldt, B. Grabowski, T. Hickel, J. Neugebauer, G. Kresse, A. Janotti and C. G. Van de Walle, Rev. Mod. Phys., 2014, 86, 253 CrossRef.
- M. J. Caldas, A. Fazzio and A. Zunger, Appl. Phys. Lett., 1984, 45, 671–673 CrossRef CAS.
- J. J. Joos, D. Poelman and P. F. Smet, Phys. Chem. Chem. Phys., 2015, 17, 19058–19078 RSC.
- L. Seijo and Z. Barandiarán, Handbook on the Physics and Chemistry of Rare Earths, Elsevier, 2016, vol. 50 Search PubMed.
- B. Wybourne, Spectroscopic properties of rare earths, Interscience Publishers, 1965 Search PubMed.
- C. G. Ma, C. K. Duan, S. D. Xia, M. Yin and M. F. Reid, J. Phys. Chem. Solids, 2008, 69, 2578–2583 CrossRef CAS.
- M. G. Brik, S. J. Camardello, A. M. Srivastava, N. M. Avram and A. Suchocki, ECS J. Solid State Sci. Technol., 2016, 5, R3067–R3077 CrossRef CAS.
- C. Görller-Walrand and K. Binnemans, Handbook on the Physics and Chemistry of Rare Earths, Elsevier, 1996, vol. 23 Search PubMed.
- Q. Zhang, K. Chen, L. Wang, H. Sun, X. Wang and X. Hao, J. Mater. Chem. C, 2015, 3, 5275–5284 RSC.
- H. Ramanantoanina, W. Urland, F. Cimpoesu and C. Daul, Phys. Chem. Chem. Phys., 2014, 16, 12282–12290 RSC.
- M. Suta and C. Wickleder, J. Mater. Chem. C, 2015, 3, 5233–5245 RSC.
- D. J. Newman and B. Ng, Rep. Prog. Phys., 1989, 52, 699–763 CrossRef CAS.
- M. Atanasov, C. A. Daul and C. Rauzy, Structure and Bonding, Springer, 2004, vol. 106, pp. 97–125 Search PubMed.
- M. Atanasov and C. A. Daul, C. R. Chim., 2005, 8, 1421–1433 CrossRef CAS.
- H. Ramanantoanina, W. Urland, A. Garcia-Fuente, F. Cimpoesu and C. Daul, Chem. Phys. Lett., 2013, 588, 260–266 CrossRef CAS.
- H. Ramanantoanina, F. Cimpoesu, C. Gottel, M. Sahnoun, B. Herden, M. Suta, C. Wickleder, W. Urland and C. Daul, Inorg. Chem., 2015, 54, 8319–8326 CrossRef CAS PubMed.
- H. Ramanantoanina, M. Sahnoun, A. Barbiero, M. Ferbinteanu and F. Cimpoesu, Phys. Chem. Chem. Phys., 2015, 17, 18547–18557 RSC.
- L. Seijo and Z. Barandiarán, J. Chem. Phys., 2014, 141, 214706 CrossRef PubMed.
- R. Shi, M. M. Qi, L. X. Ning, F. J. Pan, L. Zhou, W. J. Zhou, Y. C. Huang and H. B. Liang, J. Phys. Chem. C, 2015, 119, 19326–19332 CAS.
- Z. Barandiarán and L. Seijo, J. Chem. Phys., 2015, 143, 144702 CrossRef PubMed.
- D. Kulesza, J. Cybinska, L. Seijo, Z. Barandiarán and E. Zych, J. Phys. Chem. C, 2015, 119, 27649–27656 CAS.
- G. Derbyshire, K. C. Cheung, P. Sangsingkeow and S. S. Hasnain, J. Synchrotron Radiat., 1999, 6, 62–63 CrossRef CAS.
- B. Ravel and M. Newville, J. Synchrotron Radiat., 2005, 12, 537–541 CrossRef CAS PubMed.
- G. Kresse and J. Furthmuller, Comput. Mater. Sci., 1996, 6, 15–50 CrossRef CAS.
- G. Kresse and D. Joubert, Phys. Rev. B: Condens. Matter Mater. Phys., 1999, 59, 1758–1775 CrossRef CAS.
- J. Hafner, J. Comput. Chem., 2008, 29, 2044–2078 CrossRef CAS PubMed.
- J. P. Perdew, K. Burke and M. Ernzerhof, Phys. Rev. Lett., 1996, 77, 3865–3868 CrossRef CAS PubMed.
- A. I. Liechtenstein, V. I. Anisimov and J. Zaanen, Phys. Rev. B: Condens. Matter Mater. Phys., 1995, 52, R5467–R5470 CrossRef CAS.
- A. Janotti and C. G. Van de Walle, Appl. Phys. Lett., 2005, 87, 122102 CrossRef.
- Python Software Foundation, Python Language Reference, version 2.7, http://www.python.org.
- S. A. Petrova, V. P. Mar'evich, R. G. Zakharov, E. N. Selivanov, V. M. Chumarev and L. Y. Udoeva, Dokl. Chem., 2003, 393, 255–258 CrossRef CAS.
- R. D. Shannon, Acta Crystallogr., Sect. A: Cryst. Phys., Diffr., Theor. Gen. Crystallogr., 1976, 32, 751–767 CrossRef.
- T. Yamamoto, X-Ray Spectrom., 2008, 37, 572–584 CrossRef CAS.
- I. Hernández, F. Rodrguez and H. D. Hochheimer, Phys. Rev. Lett., 2007, 99, 027403 CrossRef PubMed.
- C. Barthou, J. Benoit, P. Benalloul and A. Morell, J. Electrochem. Soc., 1994, 141, 524–528 CrossRef CAS.
- C. R. Ronda and T. Amrein, J. Lumin., 1996, 69, 245–248 CrossRef CAS.
- Z. J. Zhang, A. Feng, X. Y. Sun, K. Guo, Z. Y. Man and J. T. Zhao, J. Alloys Compd., 2014, 592, 73–79 CrossRef CAS.
- R. Tilley, Defects in Solids, Wiley, 2008 Search PubMed.
- F. D. M. Haldane and P. W. Anderson, Phys. Rev. B: Condens. Matter Mater. Phys., 1976, 13, 2553–2559 CrossRef CAS.
- A. Zunger and U. Lindefelt, Solid State Commun., 1983, 45, 343–346 CrossRef CAS.
- H. Raebiger, S. Lany and A. Zunger, Nature, 2008, 453, 763–766 CrossRef CAS PubMed.
- M. Jansen and U. Wedig, Angew. Chem., Int. Ed., 2008, 47, 10026–10029 CrossRef CAS PubMed.
- J. F. Janak, Phys. Rev. B: Condens. Matter Mater. Phys., 1978, 18, 7165–7168 Search PubMed.
- P. Broqvist, A. Alkauskas and A. Pasquarello, Phys. Rev. B: Condens. Matter Mater. Phys., 2009, 80, 085114 CrossRef.
- F. Gallino, G. Pacchioni and C. Di Valentin, J. Chem. Phys., 2010, 133, 144512 CrossRef PubMed.
- A. De Vos, K. Lejaeghere, D. E. P. Vanpoucke, J. J. Joos, P. F. Smet and K. Hemelsoet, Inorg. Chem., 2016, 55, 2402–2412 CrossRef CAS PubMed.
- M. H. Du, J. Mater. Chem. C, 2014, 2, 2475–2481 RSC.
- A. Canning, A. Chaudhry, R. Boutchko and N. Gronbech-Jensen, Phys. Rev. B: Condens. Matter Mater. Phys., 2011, 83, 125115 CrossRef.
- A. Chaudhry, R. Boutchko, S. Chourou, G. Zhang, N. Gronbech-Jensen and A. Canning, Phys. Rev. B: Condens. Matter Mater. Phys., 2014, 89, 155105 CrossRef.
- P. Dorenbos, J. Phys.: Condens. Matter, 2003, 15, 8417–8434 CrossRef CAS.
- D. Curie, C. Barthou and B. Canny, J. Chem. Phys., 1974, 61, 3048–3062 CrossRef CAS.
- C. Ballhausen, Introduction to Ligand Field Theory, McGraw-Hill, 1970 Search PubMed.
- G. K. Liu, X. Y. Chen, N. M. Edelstein, M. F. Reid and J. Huang, J. Alloys Compd., 2004, 374, 240–244 CrossRef CAS.
- W. E. Bron, Phys. Rev., 1965, 140, 2005–2014 CrossRef CAS.
- M. Wagner and W. E. Bron, Phys. Rev., 1965, 139, A223–A233 CrossRef.
- W. E. Bron and M. Wagner, Phys. Rev., 1965, 139, A233–A241 CrossRef.
- L. He, F. Liu, G. Hautier, M. J. T. Oliveira, M. A. L. Marques, F. D. Vila, J. J. Rehr, G.-M. Rignanese and A. Zhou, Phys. Rev. B: Condens. Matter Mater. Phys., 2014, 89, 064305 CrossRef.
- S. Poncé, G. Antonius, P. Boulanger, E. Cannuccia, A. Marini, M. Côté and X. Gonze, Comput. Mater. Sci., 2014, 83, 341–348 CrossRef.
- J. M. Skelton, D. Tiana, S. C. Parker, A. Togo, I. Tanaka and A. Walsh, J. Chem. Phys., 2015, 143, 064710 CrossRef PubMed.
- A. J. J. Bos, Radiat. Meas., 2006, 41, S45–S56 CrossRef.
- J. Botterman, J. J. Joos and P. F. Smet, Phys. Rev. B: Condens. Matter Mater. Phys., 2014, 90, 085147 CrossRef.
- T. Maldiney, A. Bessiere, J. Seguin, E. Teston, S. K. Sharma, B. Viana, A. J. J. Bos, P. Dorenbos, M. Bessodes, D. Gourier, D. Scherman and C. Richard, Nat. Mater., 2014, 13, 418–426 CrossRef CAS PubMed.
- H. Dixit, N. Tandon, S. Cottenier, R. Saniz, D. Lamoen and B. Partoens, Phys. Rev. B: Condens. Matter Mater. Phys., 2013, 87, 174101 CrossRef.
- J. J. Joos, D. Poelman and P. F. Smet, Opt. Mater., 2016, 61, 50–58 CrossRef CAS.
- B. Huang, Phys. Chem. Chem. Phys., 2016, 18, 13564–13582 RSC.
Footnote |
| † Electronic supplementary information (ESI) available: (S1) Computational method, (S2) formation energy of CaZnOS, (S3) low symmetry and spin-correlated crystal fields for CaZnOS:Mn2+, (S4) electron–phonon coupling. See DOI: 10.1039/c7cp00285h |
| This journal is © the Owner Societies 2017 |