 Open Access Article
Creative Commons Attribution 3.0 Unported Licence
Ultrafast 2D-IR and optical Kerr effect spectroscopy reveal the impact of duplex melting on the structural dynamics of DNA†
Gordon
Hithell
a,
Mario
González-Jiménez
b,
Gregory M.
Greetham
c,
Paul M.
Donaldson
c,
Michael
Towrie
c,
Anthony W.
Parker
 c,
Glenn A.
Burley
 d,
Klaas
Wynne
 *b and
Neil T.
Hunt
 *a
*a
aDepartment of Physics, University of Strathclyde, SUPA, 107 Rottenrow East, Glasgow, G4 0NG, UK. E-mail: neil.hunt@strath.ac.uk
bSchool of Chemistry, WestCHEM, University of Glasgow, Glasgow, G12 8QQ, UK. E-mail: klaas.wynne@glasgow.ac.uk
cSTFC Central Laser Facility, Research Complex at Harwell, Harwell Science and Innovation Campus, Didcot, OX11 0QX, UK
dDepartment of Pure and Applied Chemistry, WestCHEM, University of Strathclyde, 295 Cathedral Street, Glasgow, G1 1XL, UK
First published on 6th April 2017
Abstract
Changes in the structural and solvation dynamics of a 15mer AT DNA duplex upon melting of the double-helix are observed by a combination of ultrafast two-dimensional infrared (2D-IR) and optical Kerr-effect (OKE) spectroscopies. 2D-IR spectroscopy of the vibrational modes of the DNA bases reveal signature off-diagonal peaks arising from coupling and energy transfer across Watson–Crick paired bases that are unique to double-stranded DNA (ds-DNA). Spectral diffusion of specific base vibrational modes report on the structural dynamics of the duplex and the minor groove, which is predicted to contain a spine of hydration. Changes in these dynamics upon melting are assigned to increases in the degree of mobile solvent access to the bases in single-stranded DNA (ss-DNA) relative to the duplex. OKE spectra exhibit peaks that are assigned to specific long-range phonon modes of ds- and ss-DNA. Temperature-related changes in these features correlate well with those obtained from the 2D-IR spectra although the melting temperature of the ds-DNA phonon band is slightly higher than that for the Watson–Crick modes, suggesting that a degree of long-range duplex structure survives the loss of Watson–Crick hydrogen bonding. These results demonstrate that the melting of ds-DNA disrupts helix-specific structural dynamics encompassing length scales ranging from mode delocalisation in the Watson–Crick base pairs to long-range phonon modes that extend over multiple base pairs and which may play a role in molecular recognition of DNA.
Introduction
Deoxyribonucleic acid (DNA) is the fundamental repository of genetic information for the majority of living organisms. Despite this vital role, the molecular mechanisms underlying the wide range of functions involved in gene expression are only partially understood. The recognition of base sequences is fundamental for replication and transcription; dictating the binding of proteins and small molecules with a high degree of specificity and selectivity. While there have been numerous studies of the molecular structure of DNA sequences,1–5 a comprehensive understanding of the guiding principles for DNA-recognition and the conformational changes that occur upon binding remains to be established.6 This shows that other factors need to be considered and we suggest that these include the action of molecular dynamics.7 DNA is a highly dynamic molecule where considerable unwinding of the duplex plays essential roles in the transcription and replication processes. Underpinning these functions is the effect of the aqueous physiological environment. The interactions of water and metal ions with DNA are critical for duplex stability, yet their influence on ligand–DNA interactions remains to be fully characterised at the molecular level.Increasingly, it is clear that an approach is needed that studies the behaviour of DNA as a whole rather than as the sum of base, ribose and phosphate backbone moieties. The Watson–Crick hydrogen-bonding interaction has been shown to induce vibrational coupling and delocalisation of vibrational modes across the base pair,8–12 while base–base-interactions along the strand contribute to the overall thermal stability of the double helix.13,14 Recently, we have found evidence that base vibrational modes couple to those of the backbone in the double helix structure, while energy relaxation follows a cascade from base to ribose to phosphate, showing that these moieties interact significantly.15 This agrees well with recent studies of DNA solvation, which identify a prominent role for the phosphate groups in mediating the interaction of DNA with its surroundings.16,17
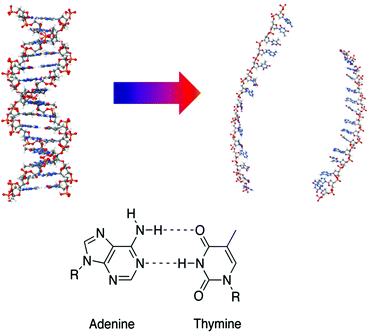
Here, we extend our understanding of the relationship between local and more global processes within DNA by combining the complementary methodologies of ultrafast two-dimensional infrared (2D-IR) and optical Kerr effect spectroscopy (OKE) to study an AT-15mer duplex (Fig. 1) at a range of temperatures spanning the double–single-strand transition.‡
The ultrafast temporal resolution of 2D-IR spectroscopy and sensitivity to localised changes in molecular structure means that it provides a valuable probe of the base vibrational modes and their interactions with both other bases and the solvent. In particular, peak positions, lineshapes and off-diagonal coupling patterns are sensitive reporters of H-bonding in the aqueous phase.18,19 Previous work includes applications of 2D-IR to the N–H20,21 and C![[double bond, length as m-dash]](https://www.rsc.org/images/entities/char_e001.gif) O stretching modes of individual bases22 as well as in separating interstrand base pairing from intrastrand base stacking effects in short-strand GC-containing DNA duplexes.8,13 A recent study employed T-jump 2D-IR spectroscopy to study the dynamics of the ds-ss-DNA transition of mixed AT-GC sequences reporting the occurrence of strand fraying.23 Here, we provide a detailed study of the impact of base-pairing on the vibrational modes of AT-sequences.
O stretching modes of individual bases22 as well as in separating interstrand base pairing from intrastrand base stacking effects in short-strand GC-containing DNA duplexes.8,13 A recent study employed T-jump 2D-IR spectroscopy to study the dynamics of the ds-ss-DNA transition of mixed AT-GC sequences reporting the occurrence of strand fraying.23 Here, we provide a detailed study of the impact of base-pairing on the vibrational modes of AT-sequences.
OKE complements this local picture of base pairing by probing the low frequency Raman spectrum of the DNA strand via a measurement of the polarisability–polarisability correlation function. OKE has recently demonstrated that long-range global phonon modes involving interstrand hydrogen bonds exist in DNA under physiologically relevant conditions as well as providing insight into the behaviour of water near the DNA strand.14 The combination of these two techniques also constitutes a first step towards understanding how local, ultrafast (sub-ps), processes may impact on longer-range slower timescale behaviour; a question of central importance to studies of ultrafast dynamics in biological systems.
Our results indicate that spectral features covering a range of length scales are correlated to the melting of the ds-DNA helix. These include specific off-diagonal peaks in the 2D-IR spectra, attributable to interbase coupling and vibrational energy transfer arising from Watson–Crick H-bonding and the low-frequency phonon modes of the DNA oligomer detected by OKE. The melting temperature of the ds-DNA phonon mode is found to be slightly higher than that of the Watson–Crick base pairs, suggesting that a degree of long-range structure is retained beyond Watson–Crick melting. 2D-IR spectral diffusion measurements on base vibrational modes also provide insight into the structural dynamics and solvation of the duplex. Changes observed in these dynamics upon melting are largely attributed to increases in solvent access to the bases.
Results
Samples containing complementary 15 base pair DNA oligomers with sequence 5′–ATTATTATTATATTA–3′ were prepared in phosphate buffer at pD 7 containing NaCl as described in the Materials and methods section.IR Spectroscopy
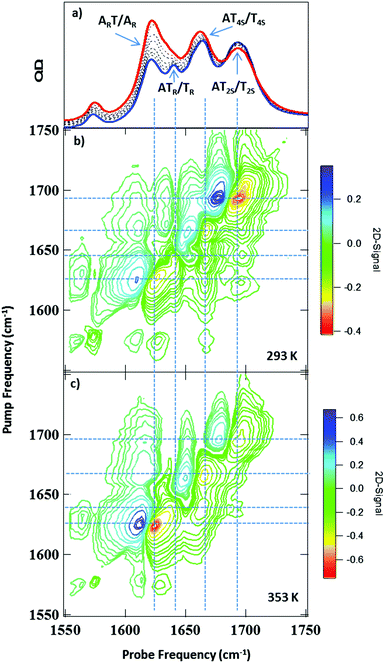
IR absorption (FTIR) spectra of the AT 15mer recorded in the 1550–1750 cm−1 region as a function of temperature are shown in Fig. 2(a). At 293 K, five bands were observed, located at 1575 cm−1, 1622, 1643, 1663 and 1692 cm−1 (blue spectrum). Heating to 353 K (red spectrum) caused the bands at 1622 cm−1 and 1663 cm−1 to increase in intensity, while the 1643 cm−1 band shifted to lower frequency (1630 cm−1), becoming partially obscured by the 1622 cm−1 peak.Examination of the temperature dependence of the FTIR spectrum using Principal Component Analysis (PCA) showed that the temperature dependence of the FTIR data could be largely described (99.9%) by two principal components (PC). The major PC (PC1, representing 98.2% of the variance) consisted of the average IR absorption spectrum across the temperature range studied and was temperature independent. By contrast, (PC2, 1.8%) represented the changes in the FTIR spectrum as a function of temperature, which mirrored the changes visible in Fig. 2(a). The results are shown in detail in Fig. S1 (ESI†). The temperature-dependence of PC2 was well-represented by a sigmoidal profile with a melting temperature (Tm) for the ds-DNA of 323 ± 2 K (ESI,† Fig. S1). This compares with the value of 318 ± 2 K obtained from a standard DNA melting curve using UV absorption spectroscopy at an excitation wavelength of 260 nm (ESI,† Fig. S2).
2D-IR spectroscopy
It has been shown previously that an accurate assignment of the vibrational modes of DNA bases requires consideration of the coupling between them and the associated mode delocalisation.22 This is facilitated by 2D-IR spectroscopy and spectra were obtained at a range of temperatures from 293 to 353 K.The 2D-IR spectrum of the AT 15mer at 293 K (ds-DNA) is shown in Fig. 2(b) for a waiting time of 250 fs. Five negative features appear on the diagonal, each corresponding to the v = 0–1 transition of the bands observed in the FTIR spectrum (Fig. 2(a)). The four most intense are highlighted using vertical dashed lines in Fig. 2(b). Each of the diagonal peaks is accompanied by a positive feature shifted to lower probe frequency, arising from the v = 1–2 transition of each mode. In the 293 K (ds-DNA) spectrum, the diagonal features are all linked by off-diagonal peaks. These are most clearly identified below the diagonal using the intersections of vertical and horizontal lines in Fig. 2(b) and show that the modes are linked either by vibrational coupling or energy transfer.
Increasing the temperature to 353 K (Fig. 2(c)) induced changes in both the on- and off-diagonal spectral features, indicating a change in the coupling/energy transfer patterns occurring within the DNA upon melting, which we discuss in detail below.
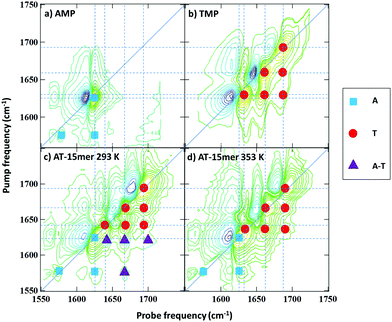
To assist with peak assignments, the 2D-IR spectra of adenosine and thymidine monophosphate (AMP and TMP) are shown in Fig. 3(a and b) alongside spectra of the AT 15mer at the extremes of the temperature range studied (Fig. 3(c and d)). A comparison of the respective FTIR spectra is shown in Fig. S3 (ESI†). The spectra of AMP and TMP have been reported previously22 but, it is important to compare the spectra under the same experimental conditions. The spectra of the individual bases are in excellent agreement with previous work22 and show that the three higher frequency modes in the AT 15mer spectra near 1643, 1663 and 1692 cm−1 are primarily due to the thymine base (Fig. 3(b), red circles), while those at 1575 and 1622 cm−1 are predominantly ‘adenine’ in character (Fig. 3(a), blue squares).
At 353 K, (Fig. 3(d)) the coupling patterns and line positions observed for the AT 15mer closely resembles a linear combination of the spectra of AMP and TMP. Furthermore, inspection of the FTIR data (Fig. S3, ESI†) shows only small variations in peak positions between the monophosphates and the 353 K AT 15mer sample. This indicates that, under conditions where no molecular structure beyond that of the base sequence is expected, interactions between neighbouring bases do not affect peak positions significantly, although some variation in relative amplitudes was observed. Thus, the mode assignments of the ss-DNA conformation can be made, by direct comparison with the individual bases, to the thymine T2S, T4S and TR modes at 1692, 1661 and 1630 cm−1 respectively (Fig. 3(d) red circles). The 1626 cm−1 mode and the weak 1575 cm−1 of the single-stranded AT 15mer are assigned to AR stretching mode and a further ring vibration of adenine (Fig. 3(d) blue squares). These are summarised in Table 1.
| T (K) | Mode frequency (cm−1) | Assignment | Vibrational lifetime (fs) | FFCF (fs) |
|---|---|---|---|---|
| 293 | 1692 | AT2S | 770 | — |
| 1663 | AT4S | 1030 | — | |
| 1643 | ATR | 930 | — | |
| 1622 | ART | 860 | — | |
| 353 | 1692 | T2S | 800 | 570 ± 50 |
| 1661 | T4S | 760 | — | |
| 1630 | TR | — | — | |
| 1626 | AR | 650 | 1060 ± 520 | |
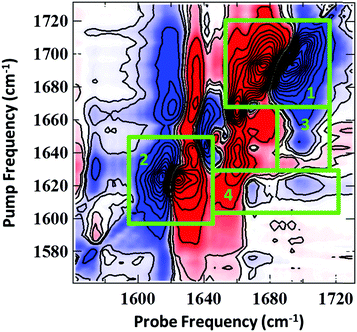
PCA was applied to investigate the temperature-induced changes in the 2D-IR spectra in detail. Similar results were obtained to those from the FTIR spectra: a temperature independent component (PC1) was obtained which was representative of the average 2D-IR spectrum over the temperature range. In addition, a temperature-dependent principal component (PC2) was produced, which exhibited a sigmoidal profile with a Tm of 319 ± 2 K. The results are shown in detail in the ESI† (Fig. S4). This confirms that the changes in PC2 are correlated to the duplex melting. The spectral distribution of PC2 is shown in Fig. 4. This is identical to a difference 2D-IR spectrum and allows direct visualisation of the 2D-IR spectral changes occurring at elevated temperature. Four key observations arise from Fig.4 (see numbered green boxes in the figure, which correspond to each point):
(1) The 1692 cm−1 diagonal peak has the opposite phase (sign of the v = 0–1 and v = 1–2 components) relative to the same peak in the experimental spectra (Fig. 2(b and c)). In both figures, positive features are blue and negative peaks are red. This reflects the decrease in amplitude of this mode as the temperature is increased, consistent with the FTIR data.
(2) The phase of the 1622 cm−1 diagonal peak is the same as in the experimental spectrum (Fig. 2(b and c)), showing that this feature increases in amplitude upon duplex melting. This information is also consistent with the FTIR spectra (Fig. 2(a)).
(3) The 1643 cm−1 diagonal mode shifts to lower wavenumber upon melting. This can be seen because the off-diagonal-peak between the 1643 and 1692 cm−1 modes loses intensity (blue) at a pump frequency of 1643 cm−1 and gains intensity (red) at a pump frequency of 1632 cm−1. This process is partially obscured in the FTIR spectra by the increasing intensity of the 1622 cm−1 mode as the temperature rises.
(4) The off-diagonal features linking the 1622 cm−1 diagonal peak to the higher frequency diagonal modes have the opposite sign to the corresponding features in the experimental data, indicating their decrease in amplitude at high temperature and the loss of these features upon melting of the duplex.
Thus, we can conclude that formation of the double stranded DNA conformation leads to a shift in the TR mode to higher frequency while new off-diagonal peaks linking the modes ascribed to T with the A mode appear. These are shown by purple triangles in Fig. 3(c) and represent off-diagonal peaks that are specific to the formation of Watson–Crick interactions between A and T. This conclusion is further supported by the presence of additional off-diagonal modes linking the weak A ring mode at 1575 cm−1 with the three T modes. Only the strongest of these is resolved clearly in Fig. 3(c) and marked with a purple triangle but the others are visible in slices through the data (see ESI,† Fig. S5).
This result is in good agreement with that predicted by computational simulations9,11 and we thus follow the assignment proposed by designating the four major vibrational modes in the ds-DNA spectrum as AT2S, AT4S and ATR and ART (1692, 1663, 1643 and 1622 cm−1 respectively) to reflect the coupling-induced delocalisation occurring across the base pair. The detailed changes in spectroscopy of the AT 15mer reported here also agree well with recent T-jump 2D-IR spectroscopy melting of short-chain mixed (GC/AT) samples containing AT-rich tracts.23
OKE spectroscopy
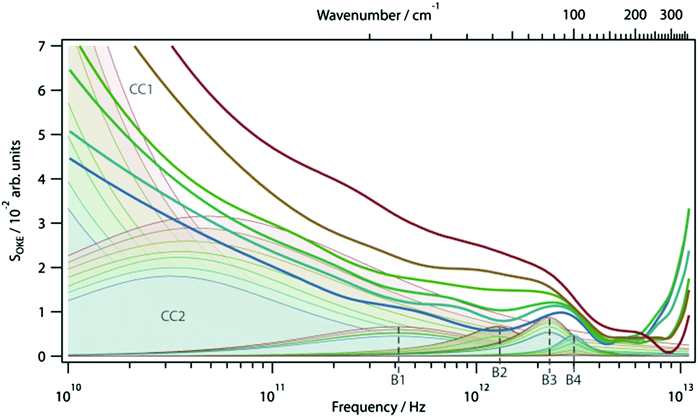
OKE spectra of the AT 15mer were measured at temperatures ranging from 298 to 358 K in intervals of 10 K. Since the OKE spectrum of water is indistinguishable from that of phosphate buffer at the concentration employed, the OKE spectrum of water was subtracted at each temperature to obtain difference spectra that were dominated by the solvated DNA oligomers (Fig. 5 and Fig. S6, ESI†).14In order to quantify the features of the collected spectra, they were modelled (ESI,† Table S1) using two Cole–Cole functions:
 | (1) |
 | (2) |
The origin of the high-intensity region in the lowest-frequency part of the spectra is the diffusive reorientational motion of the nucleic acid. To model it, a Cole–Cole function (Fig. 5, CC1) was employed.14 Since a large part of these bands is inaccessible in the experiments, the orientational relaxation time of each band was estimated using the Stokes–Einstein–Debye equation.
A second Cole–Cole function was required to fit the spectra (Fig. 5, CC2). These broad bands, caused by the diffusive translational motions of water in the DNA solvation shell, cover the whole spectral range and with an increase of temperature shift to higher frequencies, becoming broader and more intense. The higher-frequency part of the spectra is due to delocalised phonon modes in the structure of the oligomer and, therefore, was fitted using four Brownian oscillator functions.24 Two of these functions, B1 (ω0/2π = 9.9 THz, γ/2π = 1.35 THz) and B3 (ω0/2π = 2.4 THz, γ/2π = 0.78 THz), show a small linear increase in intensity with increasing temperature. The behaviour of the other two bands, B2 (ω0/2π = 1.4 THz, γ/2π = 0.6 THz) and B4 (ω0/2π = 3.04 THz, γ/2π = 0.61 THz), is very different. At 298 K the spectrum of the DNA oligomer can be fitted without the presence of B2 and as the temperature rises, the band appears and increases significantly in amplitude. The opposite effect is observed in the band B4, which has a maximum amplitude at 298 K and almost disappears at 358 K. The changes of intensity of these two bands have a sigmoidal dependence on temperature. This shows that the bands B2 and B4 are associated with the single- and double-strand conformation of the oligomer respectively. From a sigmoidal fit to the intensity of B2 and B4, melting temperatures for the oligomer of 324 ± 1 K and 330 ± 2 K were determined, respectively. It was observed that it was not necessary to modify the frequency of the Brownian oscillator functions as the temperature changed. This is attributed to the modes being associated with under-damped delocalised phonons that are not strongly coupled to the solvent.14
Structural and solvation dynamics
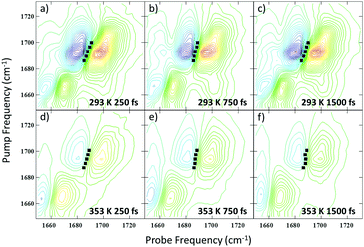
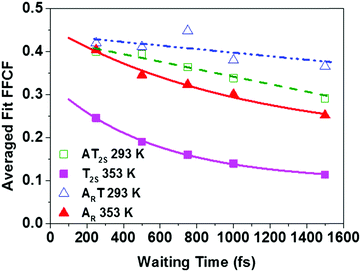
In addition to the 2D-IR spectra recorded as a function of temperature for a fixed waiting time, spectra were also obtained at a series of waiting times at 293 K and 353 K where the DNA is predominantly in ds and ss conformations respectively. Example spectra are shown in Fig. 6 where the evolution of the lineshapes from diagonally-elongated toward a more circular profile as the waiting time increases can be observed. This is indicative of an inhomogeneously broadened lineshape undergoing spectral diffusion.18,19,25–28 Extraction of the temporal-dependence of this lineshape evolution reports on the local molecular dynamics influencing the transition frequency.18,19,25,27–29 Due to the overlap of many transitions in this region of the spectrum, we have focused upon the diagonal peaks assigned to the AT2S/T2S (near 1692 cm−1) and ART/AR modes (∼1622 cm−1) at 293/353 K respectively (see Table 1). Reliable dynamical information could not be extracted from the AT4S/T4S and ATR/TR cm−1 modes. However, qualitatively, the AT4S/T4S peaks were observed to show faster spectral diffusion at high temperatures.In order to reliably extract the dynamics of the frequency–frequency correlation function (FFCF) from the crowded 2D-IR spectra, the results of three methods – the Centre Line Slope (CLS),30 the Nodal Line Slope (NLS)31,32 and 2D Gaussian fitting – were compared (see ESI,† Fig. S7).33 In all cases, the methods returned very similar results.34 The average of these (averaged fit FFCF) was taken to provide the most robust measurement of the spectral diffusion. The results as a function of Tw are shown in Fig. 7.
At 293 K, (ds-DNA) both ART and AT2S modes show very little decay of the averaged fit FFCF value, showing that any dynamics are occurring on timescales much longer than 1500 fs. However, the fact that the averaged fit FFCF is reduced from unity at short waiting times suggests a contribution from dynamics that are faster than the time resolution of the instrument (200 fs). When the temperature was raised to 353 K, above the melting transition, the fast dynamic contribution is still present but is now accompanied by a clear exponential decay for both modes, with timescales of 570 ± 50 fs (T2S) and 1060 ± 520 fs (AR) recovered. The latter was poorly defined as a result of the very fast vibrational relaxation (T1 ∼ 650 fs) of the base vibrational modes.15 All dynamic parameters extracted from the ds-DNA samples are shown in Table 1.
The experiments were repeated using only one of the two oligomers that make up the AT-15mer duplex (ESI,† Fig. S8) in order to distinguish the effects of temperature from those due to strand separation. In this case, the T2S mode exhibited an exponential decay at both 293 K and 353 K, with decay times of 350 ± 120 fs and 760 ± 140 fs respectively. The AR mode however displays similar behaviour to that seen in the double-stranded sample, with little decay observed at 293 K and an exponential decay of 610 fs observed at 353 K, though this was again poorly defined. More details on the dynamic parameters for the ss-DNA data are given in the ESI† (Table S2).
In the OKE data, the fact that the high-frequency part of the spectrum can be represented by four Brownian oscillator functions (Lorentzian functions), but not the same number (or less) of Gaussian functions, shows that these bands are homogeneously broadened and correspond to single delocalized normal modes of the DNA molecule. The dependence of the bands B2 and B4 on the temperature proves the association of these modes with the single- and double-strand conformation of the 15mer, respectively. Both modes are underdamped. The mode associated with the double-strand conformation has a period of 330 fs and a damping rate of 1.6 ps, so it is underdamped undergoing approximately five oscillations before disappearing. The mode associated with the single strand has a much longer period (715 fs) but its damping rate is similar (1.67 ps).
Discussion
The impact of duplex formation on the spectroscopy of DNA
The results indicate that a number of spectroscopic features of DNA are directly attributable to the formation of ds-DNA. 2D-IR spectra feature off-diagonal-peaks specifically due to coupling/energy transfer induced by Watson–Crick hydrogen bonding between the A and T bases (Fig. 3. purple triangles). It has been shown previously that the vibrational modes of the single bases are delocalised to a greater or lesser degree while studies of Watson–Crick base paired systems featuring GC have shown significant interbase coupling.13 It is clear from the contrasting spectroscopy of the ds- and ss-AT 15 mer studied here that a similar situation exists in that the vibrational modes of ds-DNA are significantly affected by coupling-induced delocalisation arising from the Watson–Crick pairing. This is particularly notable for the new off-diagonal peaks linking AR mode to the TR, T2S and T4S peaks but all of the modes change in position or amplitude upon duplex formation.In addition to these changes in the base vibrational modes, OKE spectroscopy identified two bands that change intensity as the duplex is denatured. One band, B2, grows in as the temperature increases while B4 disappears when the duplex is melted. These bands have been assigned to phonon-like modes that are delocalised modes of the DNA structure.14
Fig. 8 summarises the temperature dependence of the various spectroscopic features. The results of the FT-IR and 2D-IR experiments agree within the accuracy of the measurement (323 ± 2 K vs. 319 ± 2 K) as would be expected. The stated accuracy takes account of both the errors inherent in the sigmoidal fitting to the PCA data but also experiment-to-experiment repeatability of Tm. The value obtained from UV-visible melting data (318 ± 2 K) is only slightly lower that the IR measurements when the accuracy is taken into account. The growth of the B2 (single strand) band from the OKE spectroscopy measurements also agrees with the IR and UV experiments within the stated error (324 ± 1 K), suggesting that the low frequency phonon modes of the single strand are correlated with the base interactions measured by IR spectroscopy.
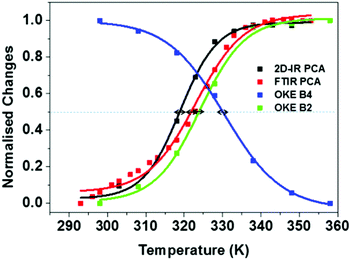 | ||
| Fig. 8 Normalised melting curves for AT-15mer duplex extracted from FTIR, 2DIR and OKE experiments. Arrows show estimated inaccuracies in Tm values from experimental repeatability. | ||
It is however interesting that the loss of the B4 (ds-DNA) phonon band reaches a mid-point at a slightly higher temperature than the other measurements (330 ± 2 K). Even accounting for the likely higher errors involved in deriving this value from a fit to the OKE data, this suggests that the B4 band persists even as the Watson–Crick interactions are being lost. Indeed, the ss-DNA phonon mode and the ds-DNA mode do not have the same midpoint. This observation is also visible in the previous reports of these bands on different oligomeric samples.14 The origin of this effect is not clear but implies that thermal breaking of the Watson–Crick interaction is insufficient to remove the structure and base-to-base interactions along the chain that support the ds-DNA phonon mode. The latter has been shown not to derive purely from base stacking and assigned to motions involving the H-bonding between the two strands. These results suggest that the motion is not supported only by the Watson–Crick H-bonding but contains a degree of long range contributions, as would be expected in the melting of a complex macromolecule.
We note that, in the FTIR and 2D-IR data, there were contributions from linear behaviour of the melting curve before the melting transition. This was not observed in all experiments and the same fitting function was applied in all cases. However, applying a linear correction to the IR data increased the melting temperatures to 326 K (FTIR) and 324 K (2D-IR), which brings them closer to the melting temperature of the B4 band but does not conclusively remove the discrepancy.
Signatures of coupling and energy transfer
Off-diagonal peaks in the 2D-IR spectra provide insight into processes such as coupling and energy transfer across the Watson–Crick base pairs. The magnitude of vibrational coupling is predicted to be in the region of 4–10 cm−1,10 which corresponds to an expected off-diagonal anharmonicity of around 1 cm−1.25 These values are close to the limit of resolution of the instrument but are consistent with the peak shapes observed in the lower right diagonal of the 2D-IR spectra (Fig. 2(b)) at the shortest waiting times. These do not show clearly separated negative and positive contributions as would be expected for larger off-diagonal anharmonicities (ESI,† Fig. S9(b)) and decay at the same rate as the diagonal peaks, consistent with coupling behaviour (Fig. S10, circles, ESI†).In addition to vibrational coupling, energy transfer would be expected to occur across the Watson–Crick paired bases. This is seen clearly in the upper-left diagonal of the spectra (Fig. 2 and ESI,† Fig. S9(a)). These show a different peak shape to the lower right portion of the spectrum, with shifts between negative and positive peaks that are clearly visible and very similar to the diagonal anharmonicities, highlighting the fact that population has transferred from one diagonal mode to the other. It is also noticeable that the peaks in the upper left quadrant gain in amplitude relative to the diagonal as the waiting time increases, with a timescale that closely matches the 650 fs T1 relaxation time of the base modes (Fig. S10, squares, ESI†).15 This behaviour is consistent with downhill energy transfer. The lack of clear uphill energy transfer in the spectrum, as would be expected, is attributed to the short waiting times investigated. Indications of changes in the peak shapes due to energy transfer are present at Tw = 1500 fs, but the S/N ratio is small. A contributory factor in this will be the fast transfer of vibrational population from base to ribose modes, reported elsewhere, which provide an efficient mechanism for vibrational energy relaxation for base modes.15
Conformation-dependent solvation dynamics
The spectral diffusion analysis of the AR and T2S modes shows significant contrasts between the ds-DNA (293 K) and ss-DNA (353 K) conformations. In all cases a contribution from very fast dynamics is indicated but, in the temporal region probed by the 2D-IR experiment, the double stranded sample shows little in the way of spectral diffusion on several hundred femtosecond timescales for either mode while, upon heating to 353 K and melting the duplex, exponential decay behaviour is observed.It is important to consider the nature of the vibrational modes probed in the 2D-IR experiment. Under single stranded conditions, the T2S mode is predominantly C![[double bond, length as m-dash]](https://www.rsc.org/images/entities/char_e001.gif) O stretching in character whereas the AR mode is predominantly a ring vibration, but contains a degree of NH2 bending.20,22 Upon formation of the Watson–Crick base pair in ds-DNA, both modes exhibit coupling, forming the ART and the AT2S modes and so the similar behaviour is consistent with a ‘base paired’ environment within a stable double helix structure with little interaction with the solvent molecules that are often the basis of sub-ps dynamic motion.32,35 This is supported by the OKE data, which show that the duplex DNA supports phonon modes, that require long range structure. These results are also consistent with previous work showing that the primary interaction between DNA and solvent is through the phosphate groups.16 Thus, the slow dynamics that are poorly probed by this measurement are expected to be the dynamics of the helix structure.
O stretching in character whereas the AR mode is predominantly a ring vibration, but contains a degree of NH2 bending.20,22 Upon formation of the Watson–Crick base pair in ds-DNA, both modes exhibit coupling, forming the ART and the AT2S modes and so the similar behaviour is consistent with a ‘base paired’ environment within a stable double helix structure with little interaction with the solvent molecules that are often the basis of sub-ps dynamic motion.32,35 This is supported by the OKE data, which show that the duplex DNA supports phonon modes, that require long range structure. These results are also consistent with previous work showing that the primary interaction between DNA and solvent is through the phosphate groups.16 Thus, the slow dynamics that are poorly probed by this measurement are expected to be the dynamics of the helix structure.
Melting of the DNA double strand leads to the T2S and AR modes exhibiting very different dynamics to the ART and AT2S modes. In the melted case, rapid, sub picosecond spectral diffusion is observed for both the T2S and AR modes. This change in dynamics is correlated with the disappearance of the ds-DNA phonon mode and shows that the loss of Watson–Crick base pairing and the rigid structure of the DNA helix is the cause of this change.
The region between the rotational diffusion band and the Brownian oscillator functions of the high-frequency part of the OKE spectra could be fitted using a broad Cole–Cole function that peaks at 32 GHz and covers the whole range of frequencies measured, justifying the intensity of the spectra between 3 and 6 THz. Since the relaxational processes of a molecule must be slower than the underdamped vibrational modes of the same molecule and the diffusive translational diffusion of bulk water has been subtracted from the spectrum, the only process that can be associated with this broad band is the diffusive translational relaxation of water molecules in the solvation shell of the nucleic acid. The position of the band reveals a slowdown of the dynamics of the water in the solvation shell with respect to the dynamics of bulk water by a factor of 8 at 298 K. When the temperature increases and the DNA denatures, the band becomes much broader and the exponential factor α drops from 0.82 at 298 K to 0.67 at 358 K.
It is to be expected that breaking of the Watson–Crick Hydrogen-bonds will lead to increased solvent access to the AR and T2S modes. The AT2S mode is orientated into the minor groove of DNA when the duplex is formed and the minor groove is thought to contain a spine of hydration featuring bound water molecules.36 Therefore, while the AT2S mode is believed to interact with water, this is not bulk-like water, consistent with the OKE conclusion and so fast spectral diffusion is not observed. This invites the conclusion that the AT2S mode is a viable probe of water dynamics within the minor groove, however, it is not possible to confirm the water interaction via 2D-IR measurements alone. The indications of these results are that, assuming the T2 carbonyl is interacting with water then the spine of hydration has very similar (>1.5 ps) dynamics to the rest of the DNA strand, consistent with a heavily dynamically-restricted picture of minor groove water molecules.37,38
When the DNA duplex is denatured and the minor groove is disrupted, the T2S mode becomes more accessible to the bulk solvent water molecules and spectral diffusion is observed. The spectral diffusion timescales are consistent with this behaviour, although it is noticeable that these are slower than the fast (300 fs) dynamics that are reported near the phosphate groups.16 This is consistent with preferential solvation of DNA through the ionic phosphates rather than the more hydrophobic bases as well as the evidence for water solvation of the DNA strand from OKE. The longer timescale exhibited by the AR mode is also suggestive of differential solvation or environment in comparison to the more hydrophilic C![[double bond, length as m-dash]](https://www.rsc.org/images/entities/char_e001.gif) O unit.
O unit.
The 2D-IR FFCFs for the single strand data set show some differences to that of the duplex. The AR shows no decay at low temperature, which is then recovered at higher temperatures. This is similar to the ds-DNA sample albeit with a slightly faster decay time. The T2S mode however does exhibit exponential decays in the spectral diffusion at both low and high temperatures with a slight increase in the decay constant at higher temperatures. It would be reasonable to consider that a single strand oligomer at low temperature should behave similarly to high temperature denatured oligomers of the same length. However, the single strand 2D-IR FFCF data does not entirely support this. The behaviour of the T2s mode does show that at low temperatures, this carbonyl bond is in a much more solvent accessible environment as opposed to the compact confinement of the DNA minor groove. The AR mode though shows a change in dynamics with temperature and therefore indicates that the single strand possesses some structure, probably via hydrophobic interactions between bases, in solution at room temperature that is disrupted at high temperature. It is known that A base stacking is particularly stable and this result suggests that it might exert considerable influence even under single strand conditions.39
Conclusions
We have combined 2D-IR and OKE spectroscopy to reveal conformation-dependent coupling patterns and dynamics of an AT-15mer DNA duplex under solution-phase conditions. 2D-IR spectra, which probe vibrational modes of the bases reveal off-diagonal peaks assigned to coupling and vibrational energy transfer across the AT base pairs, while OKE data show the formation of phonon vibrational modes along the DNA strand. In general, the two data sets show temperature-dependences that correlate well, but OKE data indicate that the phonon mode assigned to ds-DNA persists to a slightly higher temperature than Watson–Crick H-bonding. Duplex melting induces more rapid spectral diffusion of the base vibrational modes consistent with increased solvent access to the strand. Spectral diffusion measurements of the AT2S mode in ds-DNA also support the idea that any water bound into the minor groove of DNA is dynamically restricted in comparison to bulk water and suggest that the T2 C![[double bond, length as m-dash]](https://www.rsc.org/images/entities/char_e001.gif) O stretch has some potential to act as a probe of the DNA minor groove. These features will require further investigation in order to establish a clear link to the biological function of DNA, for example probing the NH stretching modes of the bases or the OH stretching modes of the surrounding water solvent shell may reveal new insights,20,40 but it is apparent that a range of dynamic phenomena need to be considered when attempting to understand DNA behaviour in solution.
O stretch has some potential to act as a probe of the DNA minor groove. These features will require further investigation in order to establish a clear link to the biological function of DNA, for example probing the NH stretching modes of the bases or the OH stretching modes of the surrounding water solvent shell may reveal new insights,20,40 but it is apparent that a range of dynamic phenomena need to be considered when attempting to understand DNA behaviour in solution.
Materials and methods
Lyophilised DNA oligomers of a 15 base pair duplex with sequence 5′–ATTATTATTATATTA–3′, plus complimentary oligomer (Eurofins Genomics Ltd), (Fig. 1) were used without further purification. Solutions were prepared with a duplex concentration of 5 mM in a deuterated phosphate buffer (100 mM) at pD 7 containing 100 mM NaCl. For all IR spectroscopy measurements, deuterated solvents were used and samples were held between two CaF2 windows separated by a polytetrafluoroethylene (PTFE) spacer of 50 μm thickness. These were placed in a temperature-controlled mount capable of reaching temperatures from 293–353 K with ±1 K accuracy. For OKE measurements, each oligomer was dissolved in non-deuterated phosphate buffer (150 mM) at pH 7 to prepare 10 mM solutions and then equal volumes of these solutions were mixed. The resulting solution was filtered using 0.2 μm hydrophilic PTFE filters (Millipore, Darmstadt, Germany) to remove dust. The sample was contained in a rectangular 1 mm optical path quartz cuvette (Starna, Hainault, UK) held in a brass block that was temperature controlled with a precision of ±0.5 K. Both buffer solutions used in IR and OKE experiments result in duplex formation in the B-form conformation.All IR absorption spectra were recorded using a Bruker Vertex 70 Fourier transform (FT)-IR instrument. 2D-IR spectra were obtained using the FT-2D-IR method using the ULTRA laser system described previously.18,25,41 The OKE spectra of the samples were obtained by Fourier transforming the time-domain data collected using two standard time domain step-scan pump–probe configurations.24,42 Full details of the 2D-IR and OKE experiments are included in the ESI.†
Acknowledgements
The authors acknowledge funding from the STFC (ST/ M000125/1 and NTH Programme Access funding) and EPSRC (University of Strathclyde Doctoral training grant), which supported this work. KW and MGJ thank the Engineering and Physical Sciences Research Council (EPSRC) for support through grants EP/J009733/1, EP/K034995/1, and EP/N508792/1.Notes and references
- K. Wüthrich, Acta Crystallogr., Sect. D: Biol. Crystallogr., 1995, 51, 249–270 CrossRef PubMed.
- P. Doty, H. Boedtker, J. R. Fresco, B. D. Hall and R. Haselkorn, Ann. N. Y. Acad. Sci., 1959, 81, 693–708 CrossRef CAS PubMed.
- M. Tsuboi, Appl. Spectrosc. Rev., 1969, 3, 45–90 CrossRef CAS.
- E. Taillandier and J. Liquier, Methods Enzymol., 1992, 211, 307–335 CAS.
- M. Banyay, M. Sarkar and A. Graslund, Biophys. Chem., 2003, 104, 477–488 CrossRef CAS PubMed.
- C. E. Bostock-Smith, S. A. Harris, C. A. Laughton and M. A. Searle, Nucleic Acids Res., 2001, 29, 693–702 CrossRef CAS PubMed.
- T. Mittag, L. E. Kay and J. D. Forman-Kaya, J. Mol. Recognit., 2010, 23, 105–116 CAS.
- A. T. Krummel, P. Mukherjee and M. T. Zanni, J. Phys. Chem. B, 2003, 107, 9165–9169 CrossRef CAS.
- C. Lee, K.-H. Park and M. Cho, J. Chem. Phys., 2006, 125, 114508 CrossRef PubMed.
- C. Lee and M. Cho, J. Chem. Phys., 2006, 125, 114509 CrossRef PubMed.
- C. Lee, K.-H. Park, J.-A. Kim, S. Hahn and M. Cho, J. Chem. Phys., 2006, 125, 114510 CrossRef PubMed.
- C. Lee and M. Cho, J. Chem. Phys., 2007, 126, 145102 CrossRef PubMed.
- A. T. Krummel and M. T. Zanni, J. Phys. Chem. B, 2006, 110, 13991–14000 CrossRef CAS PubMed.
- M. González-jiménez, G. Ramakrishnan, T. Harwood, A. Lapthorn, S. Kelly, E. Ellis and K. Wynne, Nat. Commun., 2016, 7, 1–8 Search PubMed.
- G. Hithell, D. J. Shaw, P. M. Donaldson, G. M. Greetham, M. Towrie, G. A. Burley, A. W. Parker and N. T. Hunt, J. Phys. Chem. B, 2016, 120, 4009–4018 CrossRef CAS PubMed.
- T. Siebert, B. Guchhait, Y. Liu, R. Costard and T. Elsaesser, J. Phys. Chem. B, 2015, 119, 9670–9677 CrossRef CAS PubMed.
- B. Guchhait, Y. Liu, T. Siebert and T. Elsaesser, Struct. Dyn., 2016, 3, 43202 CrossRef PubMed.
- N. T. Hunt, Chem. Soc. Rev., 2009, 38, 1837–1848 RSC.
- K. Adamczyk, M. Candelaresi, K. Robb, A. Gumiero, M. A. Walsh, A. W. Parker, P. A. Hoskisson, N. P. Tucker and N. T. Hunt, Meas. Sci. Technol., 2012, 23, 62001 CrossRef.
- C. Greve, N. K. Preketes, H. Fidder, R. Costard, B. Koeppe, I. A. Heisler, S. Mukamel, F. Temps, E. T. J. Nibbering and T. Elsaesser, J. Phys. Chem. A, 2013, 117, 594–606 CrossRef CAS PubMed.
- H. Fidder, M. Yang, E. T. J. Nibbering, T. Elsaesser, K. Röttger and F. Temps, J. Phys. Chem. A, 2013, 117, 845–854 CrossRef CAS PubMed.
- C. S. Peng, K. C. Jones and A. Tokmakoff, J. Am. Chem. Soc., 2011, 133, 15650–15660 CrossRef CAS PubMed.
- P. J. Sanstead, P. Stevenson and A. Tokmakoff, J. Am. Chem. Soc., 2016, 138, 11792–11801 CrossRef CAS PubMed.
- D. A. Turton, H. M. Senn, T. Harwood, A. J. Lapthorn, E. M. Ellis and K. Wynne, Nat. Commun., 2014, 5, 3999 CAS.
- P. Hamm and M. T. Zanni, Concepts and Methods of 2D Infrared Spectroscopy, Cambridge University Press, Cambridge, 2011 Search PubMed.
- J. B. Asbury, T. Steinel, K. Kwak, S. A. Corcelli, C. P. Lawrence, J. L. Skinner and M. D. Fayer, J. Chem. Phys., 2004, 121, 12431–12446 CrossRef CAS PubMed.
- I. J. Finkelstein, A. Goj, B. L. McClain, A. M. Massari, K. A. Merchant, R. F. Loring and M. D. Fayer, J. Phys. Chem. B, 2005, 109, 16959–16966 CrossRef CAS PubMed.
- N. Simpson and N. T. Hunt, Int. Rev. Phys. Chem., 2015, 34, 361–383 CrossRef CAS.
- J. K. Chung, M. C. Thielges and M. D. Fayer, Proc. Natl. Acad. Sci. U. S. A., 2011, 108, 3578–3583 CrossRef CAS PubMed.
- K. Kwak, S. Park, I. J. Finkelstein and M. D. Fayer, J. Chem. Phys., 2007, 127, 124503 CrossRef PubMed.
- K. Kwac and M. Cho, J. Chem. Phys., 2003, 119, 2256–2263 CrossRef CAS.
- A. Ghosh and R. M. Hochstrasser, Chem. Phys., 2011, 390, 1–13 CrossRef CAS PubMed.
- K. Adamczyk, M. Candelaresi, R. Kania, K. Robb, C. Bellota-Antón, G. M. Greetham, M. R. Pollard, M. Towrie, A. W. Parker, P. A. Hoskisson, N. P. Tucker and N. T. Hunt, Phys. Chem. Chem. Phys., 2012, 14, 7411–7419 RSC.
- Q. Guo, P. Pagano, Y.-L. Li, A. Kohen and C. M. Cheatum, J. Chem. Phys., 2015, 142, 212427 CrossRef PubMed.
- S. Park, K. Kwak and M. D. Fayer, Laser Phys. Lett., 2007, 4, 704–718 CrossRef CAS.
- I. Haq, Arch. Biochem. Biophys., 2002, 403, 1–15 CrossRef CAS PubMed.
- H. R. Drew and R. E. Dickerson, J. Mol. Biol., 1981, 151, 535–556 CrossRef CAS PubMed.
- M. L. Kopka, A. V. Fratini, H. R. Drew and R. E. Dickerson, J. Mol. Biol., 1983, 163, 129–146 CrossRef CAS PubMed.
- K. M. Guckian, B. A. Schweitzer, R. X. F. Ren, C. J. Sheils, D. C. Tahmassebi and E. T. Kool, J. Am. Chem. Soc., 2000, 122, 2213–2222 CrossRef CAS PubMed.
- C. Greve and T. Elsaesser, J. Phys. Chem. B, 2013, 117, 14009–14017 CrossRef CAS PubMed.
- G. M. Greetham, P. Burgos, Q. Cao, I. A. N. P. Clark, P. S. Codd, R. C. Farrow, M. W. George, P. Matousek, A. W. Parker, M. R. Pollard, A. Robinson, Z. Xin and M. Towrie, Appl. Spectrosc., 2010, 64, 1311–1319 CrossRef CAS PubMed.
- D. A. Turton and K. Wynne, J. Phys. Chem. B, 2014, 118, 4600–4604 CrossRef CAS PubMed.
Footnotes |
| † Electronic supplementary information (ESI) available. See DOI: 10.1039/c7cp00054e |
| ‡ TOC and Fig. 1 Molecular Structure images created in Jmol: an open-source Java viewer for chemical structures in 3D. http://www.jmol.org/. |
| This journal is © the Owner Societies 2017 |

