
 Open Access Article
 This Open Access Article is licensed under a
 Creative Commons Attribution 3.0 Unported Licence
Thermally induced conformational changes and protein–protein interactions of bovine serum albumin in aqueous solution under different pH and ionic strengths as revealed by SAXS measurements†
Dmitry
Molodenskiy
 *a,
Evgeny
Shirshin
*b,
Tatiana
Tikhonova
c,
Andrey
Gruzinov‡
a,
Georgy
Peters
a and
Francesco
Spinozzi
d
*a,
Evgeny
Shirshin
*b,
Tatiana
Tikhonova
c,
Andrey
Gruzinov‡
a,
Georgy
Peters
a and
Francesco
Spinozzi
d
aNational Research Centre “Kurchatov Institute”, Moscow, Russia. E-mail: d.s.molodenskiy@ya.ru
bDepartment of Physics, M.V. Lomonosov Moscow State University, Moscow, Russia. E-mail: shirshin@lid.phys.msu.ru
cInternational Laser Center, M.V. Lomonosov Moscow State University, Moscow, Russia
dUniversità Politecnica delle Marche, Dipartimento di Scienze della Vita e dell'Ambiente, Ancona, Italy
First published on 2nd June 2017
Abstract
Thermal-induced conformational changes and protein–protein interactions of bovine serum albumin (BSA) in aqueous solution are assessed by small angle X-ray scattering (SAXS) at two pH values (7.4 and 9.0) and two ionic strengths (0.1 and 0.5). We demonstrate that Guinier analysis in two ranges of the modulus of the scattering vector allows protein melting and aggregation to be monitored simultaneously, thus providing insights into the mechanism of thermal-induced BSA aggregation. Results of the analysis suggest that at room temperature monomeric and dimeric BSA fractions are present in solution. For low concentrations (<10 mg mL−1) the monomeric to dimeric fraction ratio is close to 6, the same value we obtained independently in size-exclusion chromatography experiments. For elevated concentrations (20 mg mL−1 and 40 mg mL−1) a decrease in the dimer fraction occurs. Following heating, dimer formation is observed prior to protein melting, while no higher order aggregates are observed in the 20–60 °C temperature range. In the vicinity of the BSA melting point, higher order aggregates appear and protein molecules exhibit an aggregation burst. Higher ionic strength makes the described effects more pronounced – dimer formation increases at lower temperatures, presumably due to partial screening of electrostatic interactions between protein molecules. Moreover, the melting temperature shifts to higher values upon increasing the protein concentration and pH, indicating that repulsive interactions stabilize the protein structure. The suggested model was verified by the assessment of parameters of protein–protein interaction potentials based on DLVO theory using the global fitting procedure.
Introduction
Protein aggregation is a general phenomenon, which is of fundamental importance for the proper functioning of living systems and also because of the possible toxicity of aggregates.1 Hence, understanding of the physical mechanisms underlying intermolecular interactions in protein solutions under varying conditions is crucial for the prediction of a system's behavior and stability. Globular proteins in their native state are mainly densely packed and charged to avoid unwanted non-specific aggregation, which is possible especially in a crowded environment of cell, where the molecules' concentration could be as high as ∼200 mg mL−1 and bimolecular interaction rates are considerable. However, destabilization of protein structure may lead to conformational changes which facilitate aggregation: for instance, amyloid fibrils are known to form from a variety of proteins under certain conditions.1,2In general, protein aggregation is the interplay between electrostatic, specific and hydrophobic interactions, whose impact is dependent on protein conformation and microenvironment. In the native state, non-polar side chains of a protein molecule reside in its interior, and the buried protein groups form hydrogen bonds.3 Upon misfolding, hydrophobic domain exposure may give rise to non-specific interactions between molecules, thus triggering aggregation. On the other hand, the role of water molecules in the proteins' hydration shell could be crucial for their interaction, namely, the overall protein hydrophobicity defined by its hydration free energy was shown to be the predominant determinant of protein aggregation propensity in aqueous solution.4,5
In this context, the influence of temperature on protein molecules' folding and their interaction may serve as a model system to obtain physical insights into the mechanisms which underlie protein aggregation. From the physical point of view, a rise in temperature results in hydrogen bond weakening and strengthening of hydrophobic interactions,6 and also in a significant alteration of diffusion and accessibility of protein side-chains.7 Temperature-induced aggregation is observed for all proteins in their native state: at a certain temperature protein globules start to melt, and the association of unfolded intermediates becomes energetically favorable. Kinetic and energetic aspects of this process, as well as the corresponding structural transitions, are widely investigated using numerous techniques,8 including small angle X-ray and neutron scattering (SAXS and SANS, respectively), which provide information on the structure and interactions of proteins in solution. Moreover, X-ray scattering allows for the investigation of the changes in the protein hydration shell, thus elucidating the role of water in macromolecule interaction.9–11
SAXS has been successfully applied to obtain insights into the mechanisms of protein interaction as a function of different environmental parameters that modulate the electrostatic interactions (pH, ionic strength)10,12,13 as well as protein concentration14–16 and denaturing agents.17 A simultaneous best fit of many SAXS curves measured under different conditions allows the intermolecular forces to be assessed in the framework of the two-Yukawa approximation.18 The SAXS technique also allows the monitoring of equilibrium clusters of proteins in solution, nucleation processes and intermediate states such as molten globules, which are characterized by an unaltered secondary structure together with an extended volume compared to the one of native conformation.19–23 Together, these capabilities of SAXS make it a valuable tool for investigating protein interaction processes that involve conformational rearrangements, cluster formation and fibril formation.24,25
In this paper, we aimed to investigate the thermal aggregation of a model globular protein, bovine serum albumin (BSA), which is one of the most studied globular proteins.26–29 Namely, the change in the oligomeric state of BSA was followed below and above its melting temperature, and the focus was set as the assessment of the role of interaction potentials during protein heating using SAXS.
The aggregation of human and bovine serum albumins (HSA and BSA) has been extensively studied in the literature: it has been shown numerous times that elevated temperature, changes of ionic strength and pH, and the presence of external agents may cause albumin conformational changes,14,30–32 leading to the exposure of polypeptide chain segments inaccessible in the native state, which may cause the loss of ligand binding properties and protein aggregation. It has been shown that oxidation, glycation and temperature-induced aggregation at low pH25,33–36 may lead albumin to form fibril-like structures, which could be toxic for humans.
A study of the changes in the HSA and BSA secondary structures using circular dichroism and IR spectroscopy demonstrated a decrease in the content of α-structures and a consequent increase in the β-structures and unfolded loops36–38 above the melting temperature (TM = 62 °C). Moreover, Mitra et al.38 observed two regimes of albumin's transitions following heating. First, upon heating up to 50 °C, a decrease in the content of α-spirals and protein hydration was observed with no increase in the protein hydrodynamic radius as seen via DLS – these processes were reversible on the subsequent cooling of the solution. Second, at temperatures above TM an irreversible increase of β-sheets, hydrodynamic radius and hydration was detected. These two regimes were suggested to be due to a consequent unfolding of the IIIA and IIA domains in HSA, respectively. Also, reversible temperature-induced transitions in albumin prior to TM were observed using differential scanning calorimetry.39 Upon incubation at temperatures above the TM at pH 7.4, globular aggregates with a ∼20 nm diameter were reported to appear at the initial stage of aggregation (<1 hour),36–38 while prolonged heating results in a sequence of morphological transitions to rod-like structures, protofibrils and, finally, β-sheet rich mature fibrils, as observed by electron microscopy.37,40 The role of the cysteine (Cys-34) residue containing a free –SH group in the formation of albumin aggregates has also been shown,41,42 including protein dimerization.
This work was inspired by the study of L. R. S. Barbosa et al.12 on the intermolecular interactions of BSA molecules in aqueous solution at different values of pH and protein concentration by the SAXS technique. We used a similar approach for the estimation of protein–protein interaction potentials, which works well for the case of moderately charged colloidal solutions. We have studied temperature-induced conformational changes and intermolecular interactions of BSA molecules in aqueous solution under different environmental conditions (pH, ionic strength), which modulate the electrostatic interactions in solution, focusing on the interaction potentials between macromolecules both below and above the TM. Using SAXS, we have been able to estimate protein shape alterations at high temperatures and intermolecular interaction potentials responsible for protein aggregation, both in the transition temperature range (in the vicinity of the melting point) and at lower temperatures, where no dramatic conformational changes could be expected. Special attention has been paid to the presence of low-order oligomeric species,43 which are frequently omitted when studying albumin properties (e.g. ligand binding) and their temperature behavior.
Materials
Bovine serum albumin (BSA) (99% purity) was purchased from Sigma (Germany). Other chemicals were of reagent grade. BSA solutions of 10, 20 and 40 mg mL−1 were prepared in 50 mM Tris–HCl buffer at pH 7.4 and 9.0. The ionic strength of the solutions was fixed to 0.1 or 0.5 M by adding NaCl. SAXS measurements were performed in the temperature range from 25 °C up to 70 °C. Size exclusion chromatography (SEC) and zeta potential measurements were performed at ambient temperature (25 ± 2 °C) (results are shown in the ESI†). The pH value of all solutions was measured using an Aquilon pH meter (Russia). Each measurement was performed only when the pH value of the suspension reached equilibrium. Hereafter we will use the following notation for the investigated samples: pH 7.4, I = 0.5 is solution A, pH 7.4, I = 0.1 is solution B and pH 9.0, I = 0.1 is solution C.Methods
Small angle X-ray scattering
In a SAXS experiment a monochromatic beam of X-rays is scattered after the interactions with the electrons of the samples. The scattered intensity, recorded as a function of the scattering vector q with modulus q = (4π/λ)sin![[thin space (1/6-em)]](https://www.rsc.org/images/entities/char_2009.gif) θ, with 2θ being the scattering angle and λ the X-ray wavelength, provides information about the fluctuations of electronic densities in heterogeneous matter. For a solution of monodispersed and randomly oriented proteins, considered as particles with homogeneous electron density, the dependence of the scattering intensity on q is described by the well-known formula:
θ, with 2θ being the scattering angle and λ the X-ray wavelength, provides information about the fluctuations of electronic densities in heterogeneous matter. For a solution of monodispersed and randomly oriented proteins, considered as particles with homogeneous electron density, the dependence of the scattering intensity on q is described by the well-known formula:| I(q) = k(Δρ)2Vp2P(q)S(q), | (1) |
Determination of gyration radii
At low q, the form factor can be approximated by the Guinier law,| P(q) = exp(−q2Rg2/3), | (2) |
I(q) vs. q2). The determination of Rg can also be performed on the basis of the whole q-range of the scattering curve through the distance distribution function P(r), which gives the probability of finding two points at distance r within the particle. The so-called “real space” Rg2 can be calculated by integrating the product r2P(r) over all values of r. Disagreement between “real space” Rrealg and “reciprocal space” RGuinierg indicates the appearance of big aggregates in solution because Rrealg makes use of the full range of q and does not suffer from aggregation species that could dominate the behavior of the SAXS curve at low q.45
Generalized Guinier–Porod model
An initial analysis of the gyration radius (Rg) and the Porod exponent (d) was performed using the best fit of the SAXS curve in the full q range through the generalized Guinier–Porod model,46 according to which the total scattered intensity is represented as a combination of two functions: | (3) |
 | (4) |
 , d is a Porod exponent and s is the parameter that gives information about the non-sphericity of particles in solution. For three-dimensional globular objects s = 0, for rods s = 1, and for lamellae (or platelets) s = 2. A Porod exponent d = 4 reveals particles with smooth surfaces while d = 3 indicates rough surfaces. An exponent d = 2 can represent scattering either from Gaussian polymer chains or from a two-dimensional structure. An exponent d = 1 represents scattering from a stiff rod (or thin cylinder). Porod exponents less than 3 correspond to “mass fractals” while Porod exponents between 3 and 4 describe “surface fractals”.46
Pair-distance distribution function
The structure factor for infinitely diluted protein solutions in (1) is equal to unity, allowing isolation of the form factor, and, hence, investigation of the shape of the protein. The zero concentration extrapolation, which can be performed on the basis of several SAXS curves recorded at different protein concentrations, eliminates any concentration effects. The extrapolated curve allows the pair-distance distribution function P(r) to be obtained by using the direct Fourier transform: | (5) |
Form factor and structure factor
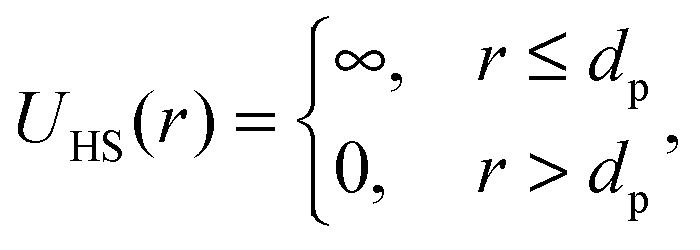
When a protein solution is monomeric and monodisperse and atomic coordinates of the protein monomer in solution are known, the protein form factor P(q) can be easily calculated from a pdb file in the whole range of the modulus q of the scattering vector also considering the contribution of the first solvation layer, where water molecules show, in general, a mass density higher than the one of bulk water molecules.10,12,47–49 However, if by varying the solution conditions (including temperature) the monomers can associate to form dimers or other oligomers, whose corresponding atomic coordinates are not available, the average form factor of the scattering particles can be approximated by simpler geometrical shapes. In the present case, we have expressed P(q) with the core–shell tri-axial ellipsoid model,14,47 with the core representing protein atoms and the shell of fixed thickness representing coating with hydration water molecules.In order to describe the average particle–particle structure factor S(q) of a system formed by oligomers, the average pair interaction potential energy can be expressed as a combination of a hard sphere potential and two Yukawian potentials, the latter representing a long-range electrostatic repulsion term and a short-range attraction term. The first term can be viewed as a potential barrier that must be overcome to make the impact of the attractive term dominant. We can increase or decrease the energy barrier by changing the ionic strength or the pH or by adding surfactants to affect the net charge of the protein. Thus, the overall interaction potential consists of three terms:
| U(r) = UHS(r) + UC(r) + UA(r), | (6) |
 | (7) |
 | (8) |
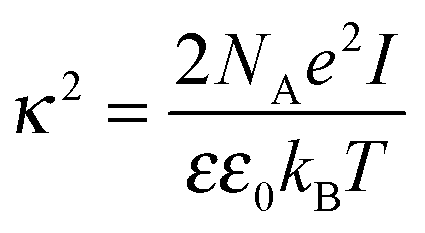 where κ−1 is the Debye–Hückel screening length, which depends on the solution ionic strength I, kBT is the thermal energy scale at absolute temperature T, and ε and ε0 are the relative dielectric permittivity of the solution and the vacuum dielectric permittivity, respectively. The last term is the attractive potential UA(r), presented in the form of the Yukawian-like attractive potential as described in ref. 16:
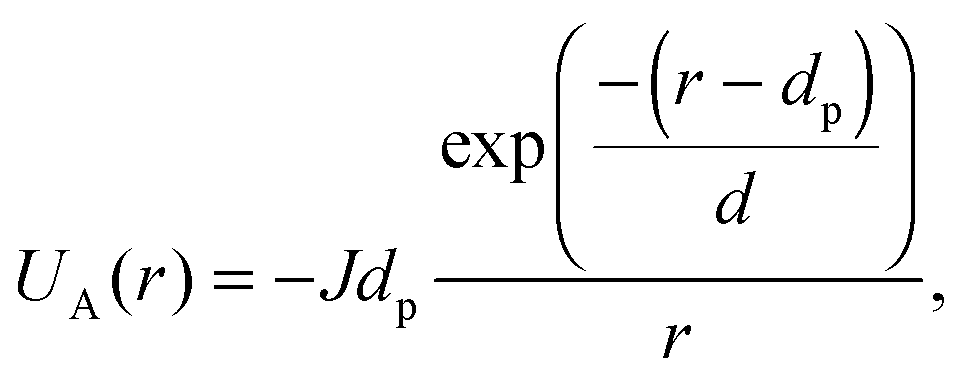 | (9) |
Calculation of S(q) from the potential U(r) requires the solution of the Ornstein–Zernike (OZ) equation under a certain closure.51 In the Random-Phase Approximation method (RPA) one must choose a reference system and all other interactions are treated as a perturbation.47 The structure factor S(q) takes the form16
| S(q) = S0(q)[1 + βkS0(q){UC(q) + UA(q)}]−1, | (10) |
Experimental conditions
SAXS measurements were performed at the DICSY beamline52 at the Kurchatov synchrotron radiation (SR) source, Kurchatov Institute, Moscow, Russia. The optical scheme of the beamline mostly consists of home-made instruments except for the detector. It includes three pairs of beam defining slits, the single-crystal monochromator (λ = 1.6 Å), the X-ray focusing mirror and the area detector Pilatus3 1 M (Fig. S2, see ESI†).The sample-to-detector distance can vary in the range from 0 to 2.4 m. We used a sample-to-detector distance of 0.5 m and an exposure time of 3 min in order to obtain optimal balance between photon statistics and time resolution. Thus, the accessible q range was 0.2–4.2 nm−1. The q calibration refinement was performed before every measurement by using a silver behenate sample.
In order to compare SAXS curves of different samples it is crucial to calibrate their intensity according to the intensity of the incident SR beam, which changes significantly on the Kurchatov SR source during a single day. For this purpose, we multiplied each curve by the value of the current in the storage ring at the moment of the measurement. The current is linearly proportional to the intensity of the incident beam, as was previously verified by FMB Oxford ionization chamber measurements.
We heated each solution from 25 to 70 °C with a 5 °C step and allowed the samples to equilibrate for 10 min at each step. Three frames for each temperature were taken. We checked the impact of protein radiation damage for each measurement by comparing the scattering curves from three frame series. No changes were observed for all temperatures below 65 °C. In order to verify the results, we made one hour measurements at fixed temperature. The radiation damage effect was negligible (see Fig. S3, ESI†).
Computational methods
The geometry refinement and integration of 2D frames were performed by the Fit2D software.53 Infinite dilution approximation of SAXS curves, construction of pair-distance distribution functions P(r), and estimation of Guinier radii Rg and intensity I(0) were performed using the ATSAS package.54 The parameters of protein shapes and interaction potentials between proteins were evaluated by the Genfit software.55 This software allows batches of SAXS curves to be fitted simultaneously by using common fitting parameters, including form and structure factors.We used the core–shell tri-axial ellipsoid form factor with the starting values of semi-axes as large as 17 × 42 × 42 Å14 left to vary in a relatively wide range and a hydration water shell thickness fixed to 3 Å.9,11 The quality of this form factor (calculated with the starting values of the semi-axes) can be evaluated in Fig. S4 (ESI†), where it is compared with the form factor of the BSA monomer calculated via the crystallographic data taken from the Protein Data Base (pdb) (file code 3v03, chain A). The agreement is quite good only up to an intermediate q value of 1.5 nm−1. However, since the main focus of this work is to estimate the parameters of the interaction potentials, we have considered the approximated description of the form factors provided by the core–shell tri-axial ellipsoid form factor model to be sufficiently good. The parameters related to the protein–protein interaction potentials were found within the two-Yukawa model and the structure factor is calculated under the random phase approximation.
Results
Gyration radii estimation
Upon heating, protein monomers tend to aggregate, giving rise to an increase in the heterogeneity of the size distribution. The following approaches have been used to determine the average gyration radius in the presence of both monomeric and oligomeric fractions. The impact of each component on the scattering curve can be described separately, if the particle size distribution is heterogeneous but the Guinier approximation is still valid for all individual particles.44 Under this assumption, the average squared gyration radius 〈Rg2〉, which can be determined using the Guinier law, is related to the gyration radius Rgk of any k-th component by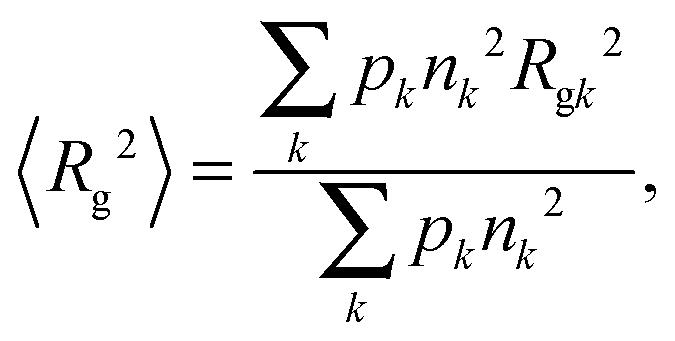 | (11) |
| I(0) = 〈nk〉cNAV12(Δρ)2/M1, | (12) |
When the fractions of monomers and certain oligomers (ex.gr dimers) in solution are both large enough, the average gyration radii of each fraction might be monitored separately using the slope of the Guinier plot in two neighboring ranges of q.44,56 The Guinier approximation, as was mentioned above, is valid in the small q-range, where qRg does not greatly exceed 1. To be more specific, deviation from the Guinier equation (in %) is given by the following equation:57
 | (13) |
The SAXS curves of BSA solutions at different values of protein concentration, pH and ionic strength recorded at 25 °C are presented in Fig. 1. The curves are normalized to the protein concentration. It can be clearly seen that with the increase of protein concentration the normalized intensity at low q values (q < 0.6 nm−1) decreases, which is in good agreement with Barbosa et al.12 It is worth noting that the structure factor at q = 0 is equal to the normalized osmotic compressibility:58,59 when the repulsive interaction between proteins dominates, the particles are evenly distributed and the structure factor S(0) is lower than 1. On the other hand, when attractive interactions dominate, fluctuations in the particle distribution are observed leading to a S(0) value larger than 1. The isoelectric point of BSA is reported at pH 4.760 and the protein charge at pH 7.4 and 9.0 is negative. To illustrate the considerations given above, we provide the plots of structure factors for different conditions of solution (pH, ionic strength and concentrations) in the ESI† (Fig. S4), calculated using RPA and the two-Yukawa potential model. Used parameters of potentials were obtained from the global fitting of SAXS curves (see details below) for all solutions under study at room temperature.
 | ||
| Fig. 1 Scattering curves for BSA solutions, pH 7.4, I = 0.5 M; pH 7.4, I = 0.1 M; pH 9.0; I = 0.1 M (from left to right), for three different concentrations (c = 10 mg mL−1 – red curve, c = 20 mg mL−1 – black curve, c = 40 mg mL−1 – blue curve) at room temperature. The curves are normalized to the BSA concentration. From left to right the repulsive interaction increases. The insets of linear plots (I vs. logq) are made for better demonstration of the I(0) discrepancies. | ||
Fig. 1 shows raw SAXS curves for room temperature, the same curves for higher temperatures can be found in the ESI,† Fig. S5. Assuming that changes of the protein shape with concentration (at pH and ionic strength under study) can be neglected,12 the decrease of intensity at low q can be attributed to the increase of repulsive Coulombian force between proteins. The ratio of intensities at q = 0.2 nm−1 for c = 40 mg mL−1 and c = 10 mg mL−1 BSA concentration (δ10/40), related to an increase of repulsive interaction among particles, corresponds to the following sequence δ10/40 (pH 7.4, I = 0.5, solution A) < δ10/40 (pH 7.4, I = 0.1, solution B) < δ10/40 (pH 9.0, I = 0.1, solution C). Such a trend can be rationalized considering that at increasing pH the net protein charge increases, while an increase of ionic strength leads to a larger screening of electrostatic repulsion.
Fig. 2 shows the temperature dependence of Rg for solution B calculated by analyzing the slopes of the two parts of the Guinier plot (Rmonomerg for monomeric particles and Raggregg for protein clusters) and by analyzing the P(r) function (Rrealg) for all concentrations (10 mg mL−1, 20 mg mL−1, 40 mg mL−1 and for infinite dilution extrapolation obtained using the Almerge software61).
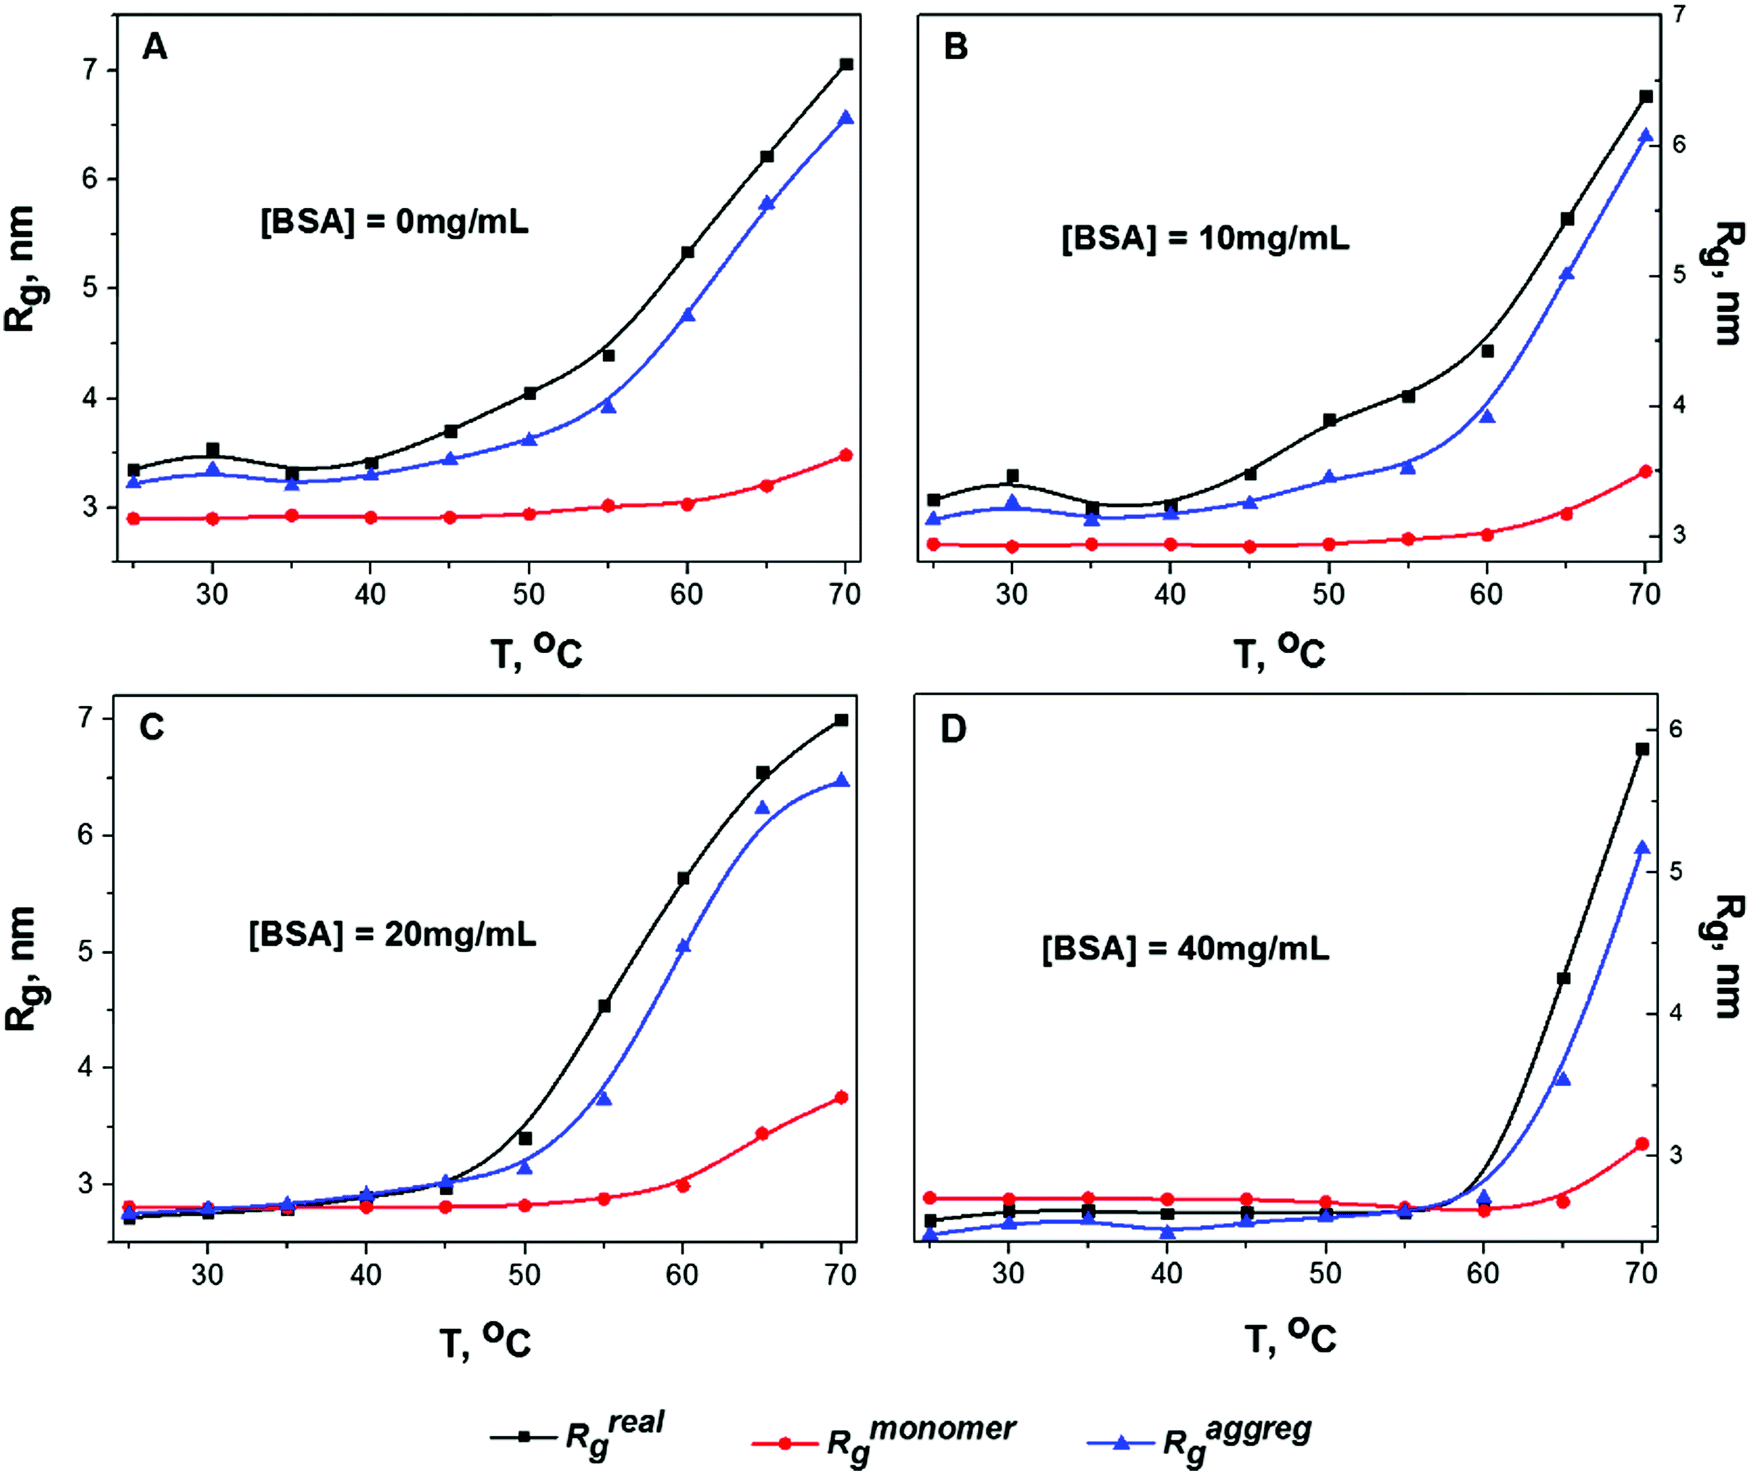 | ||
| Fig. 2 The temperature Rg dependencies of sample B (pH 7.4, I = 0.1 M) for all protein concentrations are calculated by analyzing the two slopes in the first (Rmonomerg, red circles), and the second (Raggregg, blue triangles) Guinier regions and from the P(r) function (Rrealg, black rectangles). Plots A, B, C and D correspond to protein concentrations c = 0, 10, 20 and 40 mg mL−1, respectively. | ||
Gyration radii as well as all other parameters of the calculations (like I(0) fit, Porod volume and value of Dmax) for all data can be found in the ESI† (Tables S1–S3). It is worth nothing that all calculated values of Rg (especially Raggregg at high concentrations) are influenced by the structure factor, thus Fig. 2 shows mostly relative changes of the protein sizes rather than physically meaningful values of gyration radii. In the infinite dilution approximation it is assumed that the inter-particle interference is linearly dependent on protein concentration. Therefore, the SAXS curve at zero concentration can be simply extrapolated. The decrease of protein concentration from 40 mg mL−1 to 10 mg mL−1 leads to the growth of the oligomeric fraction. Consequently, the case of infinite dilution (Fig. 2A) exhibits the biggest values of Raggregg and Rrealg. The increase in Rmonomerg for monomeric particles (red line in Fig. 2) was observed only at elevated temperatures (T > 60 °C): this effect could be caused by monomer unfolding due to protein melting. According to literature data, the melting temperature for BSA at pH 7.4 and I = 0.1 is 63 °C,26 in agreement with the temperature region where the increase in Rmonomerg was observed.
For all concentrations, Raggregg for protein aggregates calculated using the Guinier plot was close to the Rrealg value obtained from the P(r) distribution, which indicates that the contribution of oligomeric particles was considerable at all temperatures. Moreover, it can be seen from Fig. 2 that the Raggregg increases gradually with temperature: for instance, at 50 °C, which is significantly below the melting temperature, a pronounced increase in Raggregg can be observed. This means that intermolecular interactions take place even at low temperature before protein denaturation, probably due to partial destabilization of the protein structure. The same trend was observed for solutions A and C (see Fig. S6 and S7 in the ESI†). To further investigate this phenomenon, we performed a detailed analysis of P(r) evolution with temperature.
Pair-distance distribution function: assessment of BSA dimerization
Protein aggregation and conformational changes can be readily assessed from the P(r) distribution function.43,45Fig. 3 shows the infinite dilution P(r) functions for BSA solutions at different temperatures. Apart from the main peak centered at approx. 3.5 nm, an additional peak centered at r = 7 nm can be observed for all the studied solutions (Fig. S8, ESI†). Being visible even at low temperature, the height of this peak increases with temperature. At the highest temperatures (65 and 70 °C) the P(r) distribution becomes dramatically broadened.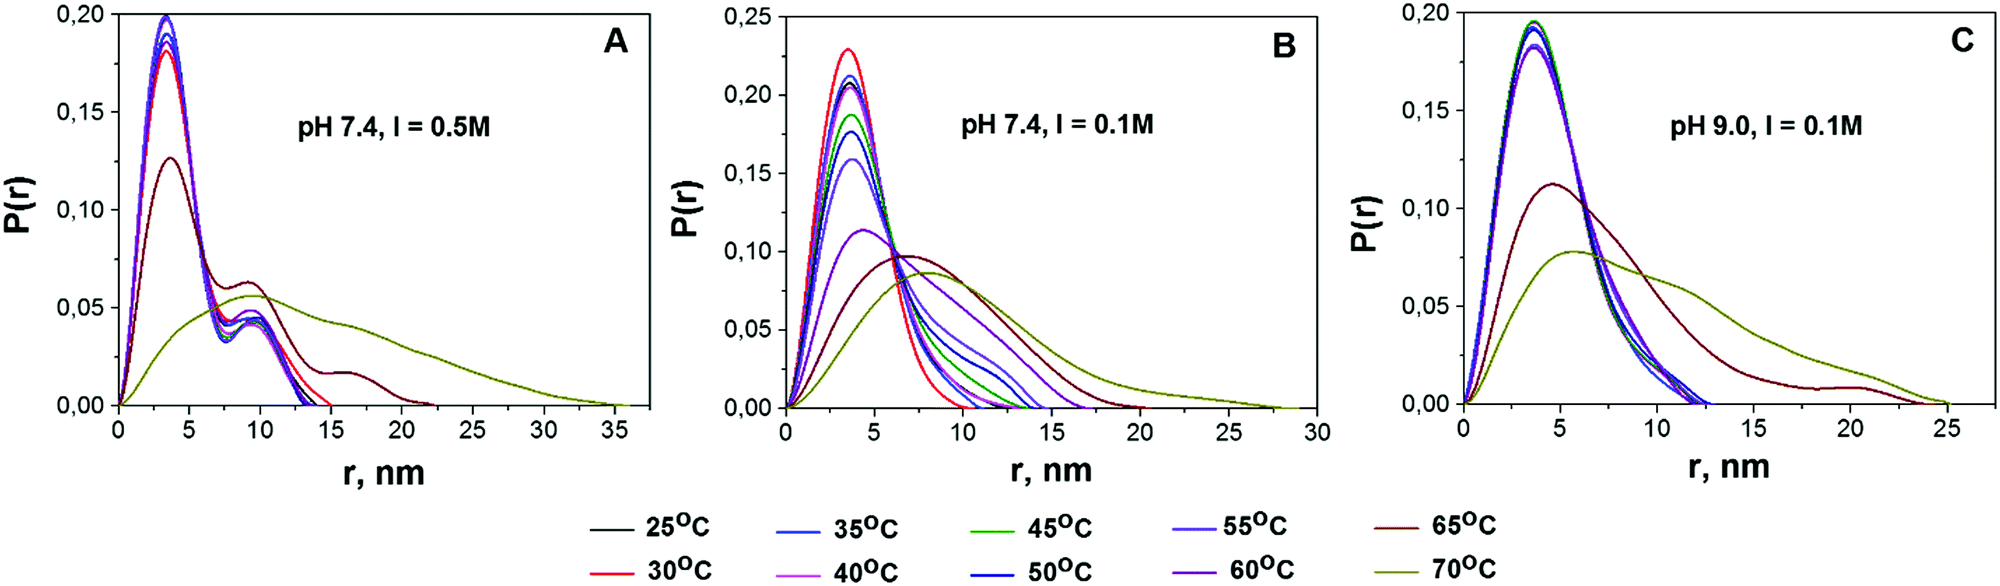 | ||
| Fig. 3 Temperature dependencies of pair-distance distribution functions P(r), normalized by area for solutions pH 7.4, I = 0.5 M; pH 7.4, I = 0.1 M; and pH 9.0, I = 0.1 M (from left to right). | ||
Based on the literature data, we propose the following interpretation of the observed changes in P(r). Firstly, the major peak at ca. 3.5 nm corresponds to the average radius of protein monomers reported for BSA.62 Secondly, the neighboring peak, according to the results of ref. 43, can be attributed to BSA dimers. Experiments performed with the use of analytical size-exclusion chromatography (SEC) on the same samples also support this hypothesis (see Fig. S9, ESI†). For solution A at room temperature (RT) the third peak is observed, which could be related to BSA trimers. Finally, the peaks centered at r > 15 nm, as well as the broad peaks observed at the highest temperatures, are likely to be originated from higher order BSA aggregates. As can be seen in Fig. 3, the impact of the second peak, which we ascribe to the presence of dimers, increases in the following sequence: solution A > solution B > solution C.
In order to quantitatively assess the fraction of dimers in solution, we performed the decomposition of the P(r) distribution into two Gaussian peaks under the assumption of the predominance of monomeric fraction. The Gaussian distribution which can be associated with the P(r) function for a spheroid was chosen due to high enough similarity of its shape with the shape of P(r) for the (17 × 42 × 42 Å) oblate ellipsoid. It is worthwhile to notice that the decomposition on Gaussian distribution peaks gives the opportunity to simplify the interpretation of experimental data. To this aim, we have introduced the monomer to dimer ratio (MDR) parameter determined as the ratio of amplitudes of P(r) peaks corresponding to monomers and dimers. For solution B the MDR value is close to 6, close to the value we obtained independently in the SEC experiment (Fig. S9, ESI†).
Guinier–Porod fitting of SAXS curves: assessment of higher order aggregates
To assess the parameters of higher order aggregates (description can be found in the section “Generalized Guinier–Porod model”), which are formed at temperatures exceeding the melting temperature where the P(r) distributions become broad and unstructured (Fig. 3), SAXS curves were approximated using the Guinier–Porod model (eqn (3) and (4)).Fig. 4 shows SAXS curves for BSA in solution B, at c = 20 mg mL−1 below (25 °C) and above the melting temperature (70 °C), the corresponding fits to the Guinier–Porod model and the temperature dependence of the best fit model parameters. The appearance of BSA aggregates at high temperature is reflected in a predominance of the Porod term (eqn (4)) with respect to the Guinier term (eqn (3)). Indeed, the radius of gyration of these aggregates is not detectable in the accessible q-range, being larger than 2π/qmin, where qmin is the lowest detectable value for the experimental setup. In detail, the region with Q1 < 0.4 nm−1 on SAXS curves lies near the beamstop and could not be used for the determination of Rg. Hence, at temperatures greater than 60 °C only the Porod region is detectable with our setup. The dependence of Q1 on temperature is presented in Fig. S10 (ESI†).
 | ||
| Fig. 4 (A) SAXS curves for BSA in solution B (pH 7.4, I = 0.1 M, c = 20 mg mL−1) below (25 °C) and above (70 °C) the melting point and their approximations using the Guinier–Porod model. The increase of intensity at low q corresponds to the formation of large scale aggregates. (B) Parameter s versus temperature. | ||
A gradual increase of the parameter s from 0 towards 2 corresponds to the formation of elongated aggregates that tend to be in the form of platelets. The observed trend can be explained by the formation of linear dimers up to 55 °C and then by the formation of burst-like higher-order aggregates. Although at high temperature the Guinier–Porod model fits the data reasonably well, it should be noticed that at s ∼ 3 there is a singularity in the Guinier part of the formula (eqn (3) and (4)) so that the use of this model should be considered with a certain caution. However, this approach seems to be reasonable for monitoring the dynamics of protein cluster formation and changes in their shapes.
Assessment of the interaction potential parameters
To obtain a more detailed understanding of the temperature-induced BSA aggregation, SAXS curves were fitted with the product of the form factor of core–shell tri-axial ellipsoids and the structure factor of the two-Yukawa potential under RPA,16,47 a model available in the Genfit software.55 The best fit curves are in good agreement with experimental data at low q values; an example of the fitting curve from solution B with a protein concentration of 20 mg mL−1 at RT can be seen in Fig. 5.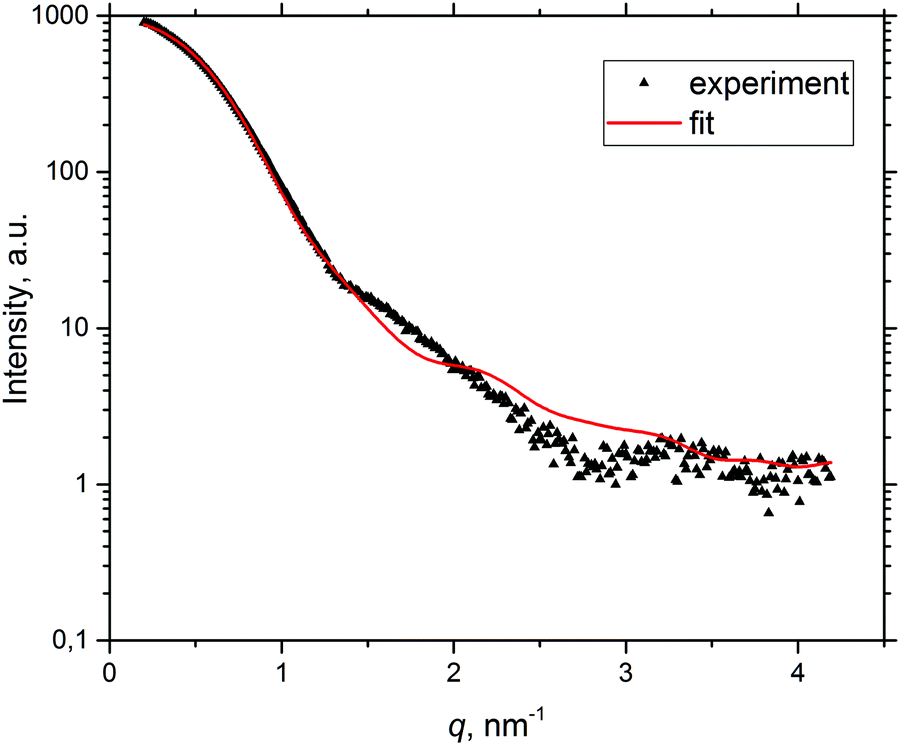 | ||
| Fig. 5 Example of fitting the experimental SAXS curve (pH 7.4, I = 0.1 M, c = 20 mg mL−1, T = 25 °C) by the Genfit software. | ||
The protein effective diameter dp was taken from ref. 12 and varied within a narrow range (60 < dp < 70 Å). The absolute value of the net protein charge |Z| was calculated for each pH and taken as 13e for pH 7.4 and 26e for pH 9.0. The range of the attractive potential d was considered to be about 10% of dp as proposed by Ortore et al.63 The relative dielectric constant ε was taken as 78.0. Temperature, protein concentration and ionic strength were fixed for each calculation. The attractive potential depth J and three axes of the ellipsoid were the fitting parameters that were allowed to vary in a wide range. Results obtained for pH 7.4 and I = 0.1 are shown in Table 1 (for other pH values and ionic strengths see Tables S3 and S4 in the ESI†).
| T, °C | J (kBT) | Ellipsoid axis, Å | ||||
|---|---|---|---|---|---|---|
| c = 10 mg mL−1 | c = 20 mg mL−1 | c = 40 mg mL−1 | c = 10 mg mL−1 | c = 20 mg mL−1 | c = 40 mg mL−1 | |
| 25 | 1.1 | 2.4 | 1.0 | 17 × 40 × 60 | 17 × 42 × 42 | 15 × 42 × 42 |
| 50 | 6.3 | 4.4 | 1.0 | 17 × 40 × 60 | 17 × 47 × 38 | 15 × 42 × 50 |
| 55 | 9.8 | 7.7 | 1.0 | 17 × 40 × 60 | 17 × 49 × 39 | 18 × 42 × 51 |
| 60 | 12.1 | 13.9 | 1.0 | 17 × 40 × 60 | 17 × 42 × 60 | 14 × 38 × 51 |
| 65 | 21.5 | 15.9 | 5.4 | 18 × 41 × 57 | 22 × 70 × 70 | 18 × 42 × 64 |
| 70 | 22.0 | 19.0 | 9.3 | 27 × 82 × 83 | 30 × 50 × 70 | 20 × 51 × 70 |
No significant changes in molecule shape were observed during heating up to 60 °C for all concentrations whereas the attractive potential depth J increased gradually. After 60 °C, a rapid increase in ellipsoid size and in the attractive potential depth value occurred, presumably due to the presence of higher oligomers in the solution.
Discussion
Albumin is the most abundant protein in blood plasma, where the concentration of the surrounding protein molecules is ∼100 mg mL−1. The conformational stability of albumin is the governing factor, which prevents non-specific oligomer formation. However, under an external influence, albumin's structure could be disrupted, leading to aggregation, and, from the physical point of view, this could be described by the interplay between the interaction potentials (electrostatic and hydrophobic) in solution. This work was aimed at the assessment of intermolecular interactions in solutions of albumin at various parameters (pH, ionic strength and temperature) which influence the electrostatic potentials between molecules, as well as their hydration state, to obtain a consistent picture of processes underlying albumin oligomer formation. For this purpose, the SAXS technique was applied.By using independent procedures for the processing of SAXS curves, we were able to elucidate the mechanism of temperature-induced BSA aggregation. The MDR values for different concentrations of protein can be evaluated by the analysis of the shape of the P(r) functions, constructed from I(q)/S(q) curves, where S(q) was built on the basis of DLVO potentials, which were obtained from the global fitting analysis (Fig. S12, ESI†). The P(r) shape is broadened at low protein concentrations, which indicates the increase of MDR with the growth of concentration, probably due to the increase of protein–protein repulsive interactions. Besides, the analysis of P(r) distribution at zero concentration approximation allowed us to observe the following trends. At 25 °C the P(r) exhibits the presence of monomeric and dimeric fractions. At low ionic strength (solution B), the MDR is close to 6, confirming the result obtained in SEC experiments. At high ionic strength (solution A), the MDR is close to 4, whereas at low ionic strength and high pH (solution C) the MDR was the highest. The expected electrostatic repulsion between protein species in the investigated solutions, which varied in the sequence A < B < C, correlated with the obtained trend of MDRs, suggesting that at 25 °C BSA dimer formation is predominantly electrostatically driven. Also we observed that MDR showed an increase with protein concentration, suggesting that the interaction between protein molecules in the native state at high concentration results in a decrease of the dimeric fraction, probably due to an increase in the overall repulsion between molecules.
The presence of low order oligomeric fractions in BSA preparations is well-known in the literature,64,65 though it is almost completely neglected in papers dealing with spectroscopic investigations, e.g. when assessing ligand binding affinities. The influence of BSA dimers on SAXS/SANS data has been discussed in the literature;10 moreover, using the SEC–SAXS technique allowed Jeffries et al. to obtain monodisperse macromolecular samples and to measure individual SAXS curves for monomers and dimers of BSA.66 Importantly, the SEC profiles and MDR obtained in ref. 66 are in excellent agreement with the values obtained for BSA at pH 7.4, I = 0.1 M in this work (see Fig. 6A and Fig. S10, ESI†).
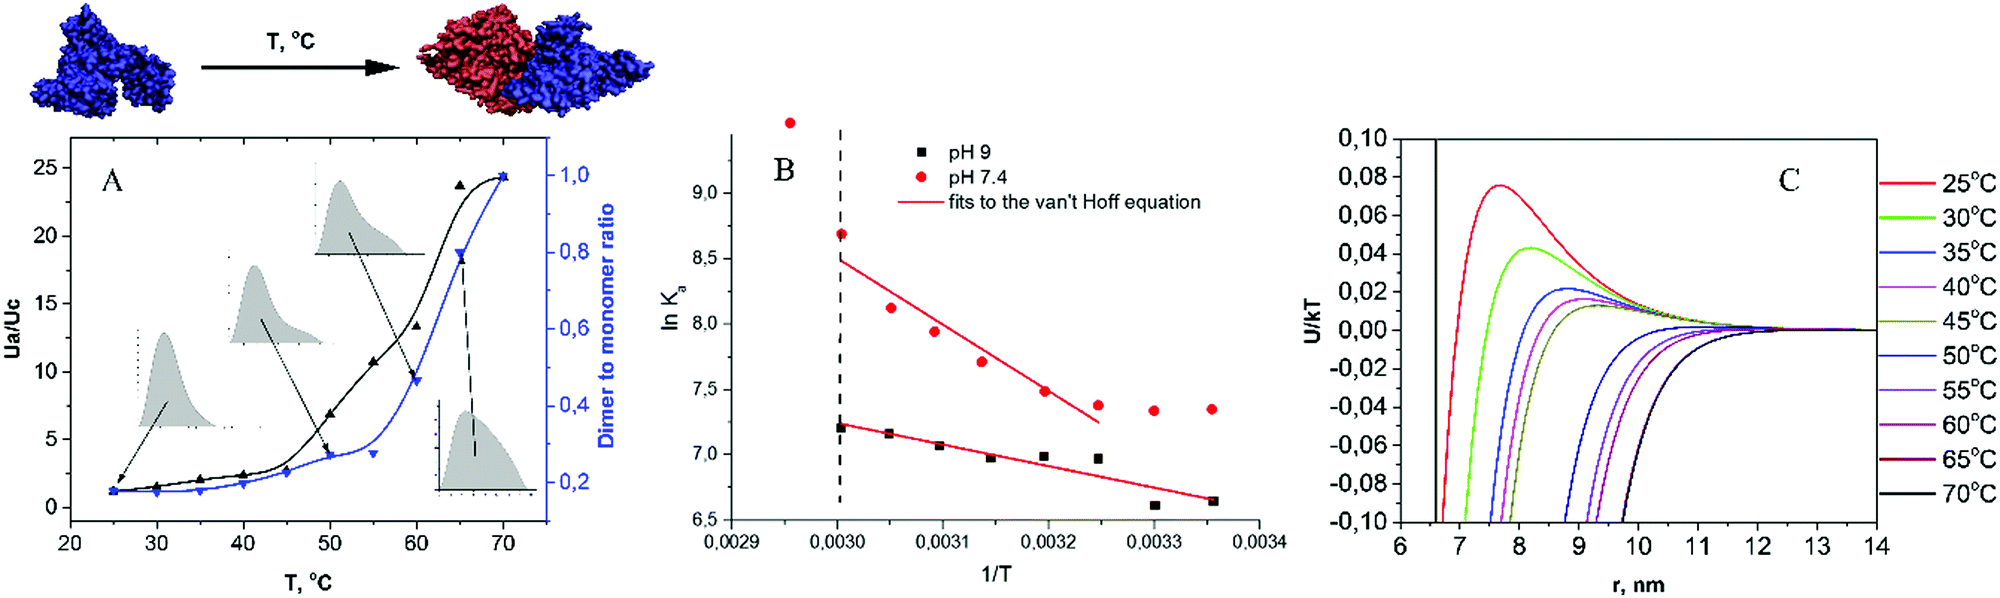 | ||
| Fig. 6 (A) The ratio of attractive to repulsive potentials (Ua/Uc) at a contact (black line) and the dimer to monomer ratio (blue line) versus temperature of the solution B (pH 7.4, I = 0.1 M). (B) Van't Hoff plots for solutions B and C (pH 9.0, I = 0.1 M). (C) Full potential (Ua + Uc) versus protein–protein distance for all temperatures of solution B. Protein concentration c = 10 mg mL−1. | ||
Heating of the protein solution could result in changes of both protein conformation and hydration,67 thus leading to alterations in the oligomeric state. At elevated temperatures and prior to protein melting, the MDRs start to decrease, indicating the formation of dimers (Fig. 3). The P(r) analysis indicates that dimers would have linear organization, as inferred from the doubling of Dmax (maximum distance in P(r)) (Fig. S9 and S13, ESI†). The Guinier–Porod model also indicates the appearance of elongated particles at elevated temperatures (Fig. 4), confirming the presence of linear BSA dimers at low temperatures. This is in agreement with the results of ref. 66, where the shape of the BSA dimer was obtained from the SEC–SAXS measurements.
For all temperatures below the melting point, the increase of Rrealg was strongly correlated with the growth of I(0), indicating that the change of Rrealg was connected only with the dimer and not with a change of the monomers' shape. The almost constant slope of the second region in the Guinier plots with temperature (Fig. 1) also confirms the assumption of a constant shape of BSA monomers prior to the melting point. In the protein transition range (i.e. in the vicinity of the melting point) higher order aggregates appear and proteins exhibit an aggregation burst, as seen in the P(r) trends and Guinier plots. From the Rg analysis (Fig. 2 and Fig. S6 and S7, ESI†) it can be seen that the melting temperature shifts to higher values upon (i) the increase of protein concentration, (ii) the increase of pH and (iii) the decrease of ionic strength. The observed shift of the melting temperature to higher values with the increase of electrostatic repulsion (i.e. with increase of pH or concentration) is in agreement with the data obtained using differential scanning calorimetry,68 namely, TM = 63.2 ± 0.4 °C and 65.5 ± 0.4 °C for pH 7.4 and 9, respectively.
Assuming, according to the literature data,38 that in the 25–55 °C range BSA conformational changes are reversible, the association constant for dimerization was calculated on the basis of MDR values for pH 7.4 and 9 solutions (10 mg mL−1, I = 0.1 M). The results are presented in Fig. 6B in the form of van't Hoff plots, i.e. lnKaversus 1/T. Both curves exhibit a negative slope, corresponding to endothermic reaction. The dependence of lnKa on 1/T for pH 9 is close to linear, which implies an almost constant entropy in the selected temperature range. In contrast to that, the van't Hoff plot for pH 7.4 is significantly non-linear, suggesting a change in the system entropy upon heating. A lower tendency towards dimerization at pH 7.4 can be explained by a lower value of electrostatic repulsion between BSA molecules. By fitting the linear parts of the plots, we obtained the dimer formation enthalpies of 32 and 76 kJ mol−1, respectively. Of note, the melting enthalpy for BSA at pH 7.4 and 9 as measured via differential scanning calorimetry is significantly higher, namely, ca. 320 and 400 kJ mol−1, respectively.68
As dimer formation results in a decrease of the accessible protein surface, the number of water molecules in the hydration shell of BSA per monomer becomes lower at higher temperatures: e.g., ref. 39 reported 3500 vs. 6000 water molecules in the first hydration layer of albumin, respectively. This trend is in accordance with the results of ref. 69, where a decrease in HSA hydration was observed upon heating the protein solution up to 50 °C. It is known from the SANS measurements that the water molecules in the first hydration shell are densely packed compared to bulk solution,9 and ∼98% orientation of water molecules of the first layer was demonstrated for HSA,70 thus providing a significant contribution to the entropy of the system, which could lead to non-linearity of the van't Hoff plot.67 However, separating the role of solvent molecules in BSA aggregation propensity from the other interactions in the system requires further investigation.
Interestingly, as reported by Vogtt et al.,71 where temperature-induced aggregation of β-lactoglobulin was studied, the initial state of the protein was dimeric, and an increase in temperature led to dimer dissociation. For this system, thermodynamic studies also demonstrated non-linear van't Hoff plots for the dimerization constant, but, in contrast to BSA, with a positive slope.67 This was interpreted by the change of heat capacity and the dominant role of burial of the hydrophobic surfaces upon dimer formation. From this perspective, it could be speculated that BSA conformational changes in the 25–55 °C range do not result in a significant change of the overall protein hydrophobicity.
To further investigate processes accompanying BSA intermolecular interactions at elevated temperatures, we performed the global fitting of SAXS curves with the two-Yukawa model, which revealed the following trends. First, the attractive potential depth J decreased with protein concentration (Table 1, Tables S3 and S4, ESI†). The ratio of attractive to repulsive potential at contact, Ua/Uc, decreases following the series A > B > C, in line with the P(r) analysis. Most importantly, it can be observed that the Ua/Uc value increases with temperature (Fig. 6A), which correlates with the formation of aggregates, as seen in the P(r) and in the Guinier plot analysis (Fig. 5).
Fig. 6C demonstrates a change of the interaction potential with temperature: upon temperature increase, the aggregation barrier is lowered and a significant enhancement of attraction forces at short distances is observed. Since the short-range attractive potential is due to a combination of van der Waals, hydrophobic and non-specific interaction forces between protein molecules, it is impossible to understand which interaction is responsible for the observed increase of J with temperature. Temperature-induced conformational changes could lead to alterations in the dipole moment of proteins, as well as to the exposure of hydrophobic segments, both leading to an increase of attraction. However, these considerations cannot be regarded as a general case: for instance, Schroer et al.72 observed a decrease of J with temperature for lysozyme solutions in the 5–25 °C range.
We did not find any signs of the molten globule state or any other conformational changes of the monomers below the protein melting point. This means that the decrease of MDR at low temperatures may be mainly due to the increase of the kinetic energy of molecules and not the increase of J. As is known, it is necessary to carry out SEC and SAXS experiments at the same time to make precise estimation of the relation between electrostatic attractive force and MDR, since the attractive interaction and presence of dimers in the solution change the scattering curve in the same way. However, on the basis of our qualitative analysis it is possible to confirm that the protein–protein electrostatic interactions of BSA play a predominant role in thermal-induced oligomer formation at physiological concentrations of the proteins (∼10–40 mg mL−1).
Acknowledgements
The authors wish to thank Dr Nikolai Sluchanko (A.N. Bach Institute of Biochemistry, Research Center of Biotechnology of the Russian Academy of Sciences) for providing the SEC data. The work was funded by RFBR according to the research projects no. 16-32-00049 mol_a and no. 16-32-60168 mol_a_dk.References
- M. Stefani and C. M. Dobson, Protein aggregation and aggregate toxicity: new insights into protein folding, misfolding diseases and biological evolution, J. Mol. Med., 2003, 81(11), 678–699 CrossRef CAS PubMed.
- C. A. Ross and M. A. Poirier, Protein aggregation and neurodegenerative disease, Nat. Med., 2004, 10(7), S10–S17 CrossRef PubMed.
- C. Chothia, The nature of the accessible and buried surfaces in proteins, J. Mol. Biol., 1976, 105(1), 1–12 CrossRef CAS PubMed.
- S.-H. Chong and S. Ham, Impact of chemical heterogeneity on protein self-assembly in water, Proc. Natl. Acad. Sci. U. S. A., 2012, 109(20), 7636–7641 CrossRef CAS PubMed.
- S. H. Chong and S. Ham, Interaction with the surrounding water plays a key role in determining the aggregation propensity of proteins, Angew. Chem., Int. Ed., 2014, 53(15), 3961–3964 CrossRef CAS PubMed.
- A. J. Rader, B. M. Hespenheide, L. A. Kuhn and M. F. Thorpe, Protein unfolding: rigidity lost., Proc. Natl. Acad. Sci. U. S. A., 2002, 99(Track II), 3540–3545 CrossRef CAS PubMed.
- M. Grimaldo, et al., Hierarchical molecular dynamics of bovine serum albumin in concentrated aqueous solution below and above thermal denaturation., Phys. Chem. Chem. Phys., 2015, 17(6), 4645–4655 RSC.
- S. D. Nidhi Kaur Bhatia, Diagnostic tools for sctuctural characterization and elucidation of fibrils and their precursors in amyloid fibril formation pathway, J. Proteins Proteomics, 2013, 4, 149–164 Search PubMed.
- D. I. Svergun, S. Richard, M. H. Koch, Z. Sayers, S. Kuprin and G. Zaccai, Protein hydration in solution: experimental observation by X-ray and neutron scattering., Proc. Natl. Acad. Sci. U. S. A., 1998, 95(5), 2267–2272 CrossRef CAS.
- F. Zhang, et al., Hydration and interactions in protein solutions containing concentrated electrolytes studied by small-angle scattering, Phys. Chem. Chem. Phys., 2012, 14(14), 2483–2493 RSC.
- H. S. Kim, et al., SAXS/SANS on Supercharged Proteins Reveals Residue-Specific Modifications of the Hydration Shell, Biophys. J., 2016, 110(10), 2185–2194 CrossRef CAS PubMed.
- L. R. S. Barbosa, M. G. Ortore, F. Spinozzi, P. Mariani, S. Bernstorff and R. Itri, The importance of protein–protein interactions on the pH-induced conformational changes of bovine serum albumin: a small-angle X-ray scattering study, Biophys. J., 2010, 98(1), 147–157 CrossRef CAS PubMed.
- L. Ianeselli, et al., Protein–protein interactions in ovalbumin solutions studied by small-angle scattering: effect of ionic strength and the chemical nature of cations, J. Phys. Chem. B, 2010, 114(11), 3776–3783 CrossRef CAS PubMed.
- F. Zhang, M. W. A. Skoda, R. M. J. Jacobs, R. A. Martin, C. M. Martin and F. Schreiber, Protein interactions studied by SAXS: effect of ionic strength and protein concentration for BSA in aqueous solutions, J. Phys. Chem. B, 2007, 111(1), 251–259 CrossRef CAS PubMed.
- N. Javid, K. Vogtt, C. Krywka, M. Tolan and R. Winter, Capturing the Interaction Potential of Amyloidogenic Proteins, Phys. Rev. Lett., 2007, 99(2), 2–5 CrossRef PubMed.
- J. Narayanan and X. Y. Liu, Protein Interactions in Undersaturated and Supersaturated Solutions: a Study Using Light and X-Ray Scattering, Biophys. J., 2003, 84(1), 523–532 CrossRef CAS PubMed.
- F. Sinibaldi, et al., Insights into Cytochrome c – Cardiolipin Interaction. Role Played by Ionic Strength, Biochemistry, 2008, 47, 6928–6935 CrossRef CAS PubMed.
- J. Israelachvili, Intermolecular and Surface Forces, 3rd edn, 2010 Search PubMed.
- O. Ptitsyn, Protein folding: Hypotheses and experiments, J. Protein Chem., 1987, 6(4), 273–293 CrossRef CAS.
- O. B. Ptitsyn, R. H. Pain, G. V. Semisotnov, E. Zerovnik and O. I. Razgulyaev, Evidence for a molten globule state as a general intermediate in protein folding, FEBS Lett., 1990, 262(1), 20–24 CrossRef CAS PubMed.
- O. B. Ptitsyn, Secondary structure formation and stability, Curr. Opin. Struct. Biol., 1992, 2, 13–20 CrossRef CAS; O. B. Ptitsyn, Curr. Opin. Struct. Biol., 1992, 2(1), 13–20 CrossRef.
- K. Kuwajima, The molten globule state as a clue for understanding the folding and cooperativity of globular-protein structure, Proteins: Struct., Funct., Bioinf., 1989, 6(2), 87–103 CrossRef CAS PubMed.
- A. L. Fink, Molten globules., Methods Mol. Biol., 1995, 40(8), 343–360 CAS.
- Y. Yonezawa, S. Tanaka, T. Kubota, K. Wakabayashi, K. Yutani and S. Fujiwara, An insight into the pathway of the amyloid fibril formation of hen egg white lysozyme obtained from a small-angle X-ray and neutron scattering study, J. Mol. Biol., 2002, 323(2), 237–251 CrossRef CAS PubMed.
- A. E. Langkilde and B. Vestergaard, Methods for structural characterization of prefibrillar intermediates and amyloid fibrils, FEBS Lett., 2009, 583(16), 2600–2609 CrossRef CAS PubMed.
- T. Peters, All About Albumin., 1995 Search PubMed.
- X. M. He and D. C. Carter, Atomic structure and chemistry of human serum albumin., Nature, 1992, 358(6383), 209–215 CrossRef CAS PubMed.
- S. Curry, H. Mandelkow, P. Brick and N. Franks, Crystal structure of human serum albumin complexed with fatty acid reveals an asymmetric distribution of binding sites., Nat. Struct. Biol., 1998, 5(9), 827–835 CrossRef CAS PubMed.
- A. Michnik, K. Michalik and Z. Drzazga, Stability of bovine serum albumin at different pH, J. Therm. Anal. Calorim., 2005, 80(2), 399–406 CrossRef CAS.
- B. Ahmad, M. Z. Kamal and R. H. Khan, Alkali-induced conformational transition in different domains of bovine serum albumin, Protein Pept. Lett., 2004, 11(4), 307–315 CrossRef CAS PubMed.
- P. Sen, B. Ahmad and R. H. Khan, Formation of a molten globule like state in bovine serum albumin at alkaline pH, Eur. Biophys. J., 2008, 37(8), 1303–1308 CrossRef CAS PubMed.
- M. Bhattacharya, N. Jain and S. Mukhopadhyay, Insights into the mechanism of aggregation and fibril formation from bovine serum albumin., J. Phys. Chem. B, 2011, 115(14), 4195–4205 CrossRef CAS PubMed.
- J. Juárez, et al., Additional supra-self-assembly of human serum albumin under amyloid-like-forming solution conditions, J. Phys. Chem. B, 2009, 113(36), 12391–12399 CrossRef PubMed.
- B. Bouma, et al., Glycation Induces Formation of Amyloid Cross-β Structure in Albumin, J. Biol. Chem., 2003, 278(43), 41810–41819 CrossRef CAS PubMed.
- P. Rondeau, S. Armenta, H. Caillens, S. Chesne and E. Bourdon, Assessment of temperature effects on β-aggregation of native and glycated albumin by FTIR spectroscopy and PAGE: relations between structural changes and antioxidant properties, Arch. Biochem. Biophys., 2007, 460(1), 141–150 CrossRef CAS PubMed.
- P. Rondeau, G. Navarra, F. Cacciabaudo, M. Leone, E. Bourdon and V. Militello, Thermal aggregation of glycated bovine serum albumin, Biochim. Biophys. Acta, Proteins Proteomics, 2010, 1804(4), 789–798 CrossRef CAS PubMed.
- J. Juárez, P. Taboada, M. A. Valdez and V. Mosquera, Self-assembly process of different poly(oxystyrene)–poly(oxyethylene) block copolymers: spontaneous formation of vesicular structures and elongated micelles, Langmuir, 2008, 24(14), 7107–7116 CrossRef PubMed.
- R. K. Mitra, S. S. Sinha and S. K. Pal, Hydration in protein folding: thermal unfolding/refolding of human serum albumin, Langmuir, 2007, 23(20), 10224–10229 CrossRef CAS PubMed.
- M. Rezaei Tavirani, S. H. Moghaddamnia, B. Ranjbar, M. Amani and S. A. Marashi, Conformational study of human serum albumin in pre-denaturation temperatures by differential scanning calorimetry, circular dichroism and UV spectroscopy, J. Biochem. Mol. Biol., 2006, 39(5), 530–536 CAS.
- J. Juárez, P. Taboada and V. Mosquera, Existence of different structural intermediates on the fibrillation pathway of human serum albumin, Biophys. J., 2009, 96(6), 2353–2370 CrossRef PubMed.
- R. Wetzel, et al., Temperature behaviour of human serum albumin., Eur. J. Biochem., 1980, 104(2), 469–478 CrossRef CAS PubMed.
- V. Militello, V. Vetri and M. Leone, Conformational changes involved in thermal aggregation processes of bovine serum albumin, Biophys. Chem., 2003, 105(1), 133–141 CrossRef CAS PubMed.
- J. Rescic, V. Vlachy, A. Jamnik and O. Glatter, Osmotic Pressure, Small-Angle X-Ray, and Dynamic Light Scattering Studies of Human Serum Albumin in Aqueous Solutions., J. Colloid Interface Sci., 2001, 239(1), 49–57 CrossRef CAS PubMed.
- A. Guinier and G. Fournet, Small angle scattering of X-rays, Translated by C. B. Walker and K. L. Yudowitch, John Wiley & Sons, New York, 1955, p. 268 Search PubMed.
- O. Glatter and O. Kratky, Small Angle X-ray Scattering, 1982, p. 514 Search PubMed.
- B. Hammouda, A new Guinier–Porod model, J. Appl. Crystallogr., 2010, 43(4), 716–719 CrossRef CAS.
- R. Carrotta, et al., Protein stability modulated by a conformational effector: effects of trifluoroethanol on bovine serum albumin., Phys. Chem. Chem. Phys., 2009, 11(20), 4007–4018 RSC.
- D. Svergun, C. Barberato and M. H. Koch, CRYSOL – A program to evaluate X-ray solution scattering of biological macromolecules from atomic coordinates, J. Appl. Crystallogr., 1995, 28(6), 768–773 CrossRef CAS.
- F. Spinozzi and M. Beltramini, QUAFIT: a novel method for the quaternary structure determination from small-angle scattering data, Biophys. J., 2012, 103(3), 511–521 CrossRef CAS PubMed.
- E. J. W. Verwey and J. T. G. Overbeek, Theory of the stability of lyophobic colloids, Courier Corporation, 1999 Search PubMed.
- J.-P. Hansen and I. McDonald, Theory of simple liquids, 2006 Search PubMed.
- V. N. Korneev, et al., Current status of the small-angle station at Kurchatov center of synchrotron radiation, in Nuclear Instruments and Methods in Physics Research, Section A: Accelerators, Spectrometers, Detectors and Associated Equipment, 2005, vol. 543(1), pp. 368–374 Search PubMed.
- A. P. Hammersley, FIT2D: a multi-purpose data reduction, analysis and visualization program, J. Appl. Crystallogr., 2016, 49, 646–652 CrossRef CAS.
- M. V. Petoukhov, et al., New developments in the ATSAS program package for small-angle scattering data analysis, J. Appl. Crystallogr., 2012, 45(2), 342–350 CAS.
- F. Spinozzi, C. Ferrero, M. G. Ortore, A. De Maria Antolinos and P. Mariani, GENFIT: Software for the analysis of small-angle X-ray and neutron scattering data of macro-molecules in solution, J. Appl. Crystallogr., 2014, 47(3), 1132–1139 CAS.
- T. Ueki, et al., Aggregation of bovine serum albumin upon cleavage of its disulfide bonds, studied by the time-resolved small-angle X-ray scattering technique with synchrotron radiation., Biophys. Chem., 1985, 23(1–2), 115–124 CrossRef CAS PubMed.
- L. A. Feigin and D. I. Svergun, in Structure analysis by small-angle X-ray and neutron scattering, ed. G. W. Taylor, Plenum Press, New York, 1987 Search PubMed.
- A. Tardieu, et al., Proteins in solution:from X-ray scattering intensities to interaction potentials, J. Cryst. Growth, 1999, 196(2), 193–203 CrossRef CAS.
- J. D. Gunton, A. Shiryayev and D. L. Pagan, Protein condensation: Kinetic pathways to crystallization and disease, 2007 Search PubMed.
- J. M. Peula-Garcia, R. Hidaldo-Alvarez and F. J. De las Nieves, Protein co-adsorption on different polystyrene latexes: Electrokinetic characterization and colloidal stability, Colloid Polym. Sci., 1997, 275(2), 198–202 CAS.
- D. Franke, A. G. Kikhney and D. I. Svergun, Automated acquisition and analysis of small angle X-ray scattering data, Nucl. Instrum. Methods Phys. Res., Sect. A, 2012, 689, 52–59 CrossRef CAS.
- J. Anderegg and W. Beeman, An Investigation of the Size, Shape and Hydration of Serum Albumin by Small-angle X-Ray Scattering, J. Am. Chem. Soc., 1955, 77(11), 2927–2937 CrossRef CAS.
- M. G. Ortore, et al., New insights into urea action on proteins: a SANS study of the lysozyme case, J. Phys. Chem. B, 2008, 112(41), 12881–12887 CrossRef CAS PubMed.
- V. Levi and F. L. González Flecha, Reversible fast-dimerization of bovine serum albumin detected by fluorescence resonance energy transfer, Biochim. Biophys. Acta, Proteins Proteomics, 2002, 1599(1–2), 141–148 CrossRef CAS PubMed.
- M. A. Graewert, et al., Automated pipeline for purification, biophysical and X-ray analysis of biomacromolecular solutions., Sci. Rep., 2015, 5, 10734 CrossRef CAS PubMed.
- C. M. Jeffries, M. A. Graewert, C. E. Blanchet, D. B. Langley, A. E. Whitten and D. I. Svergun, Preparing monodisperse macromolecular samples for successful biological small-angle X-ray and neutron-scattering experiments., Nat. Protoc., 2016, 11(11), 2122–2153 CrossRef CAS PubMed.
- K. Sakurai, M. Oobatake and Y. Goto, Salt-dependent monomer – dimer equilibrium of bovine b-lactoglobulin at pH 3, Protein Sci., 2001, 10, 2325–2335 CrossRef CAS PubMed.
- G. A. Picó, Thermodynamic features of the thermal unfolding of human serum albumin, Int. J. Biol. Macromol., 1997, 20(1), 63–73 CrossRef.
- D. Mishra, P. K. Mishra, V. Dubey, M. Nahar, S. Dabadghao and N. K. Jain, Systemic and mucosal immune response induced by transcutaneous immunization using Hepatitis B surface antigen-loaded modified liposomes, Eur. J. Pharm. Sci., 2008, 33(4–5), 424–433 CrossRef CAS PubMed.
- S. Perticaroli, et al., Description of hydration water in protein (GFP) solution, J. Am. Chem. Soc., 2017, 139(3), 1098–1105 CrossRef CAS PubMed.
- K. Vogtt, N. Javid, E. Alvarez, J. Sefcik and M.-C. Bellissent-Funel, Tracing nucleation pathways in protein aggregation by using small angle scattering methods, Soft Matter, 2011, 7(8), 3906 RSC.
- M. A. Schroer, J. Markgraf, D. F. Wieland, C. J. Sahle, J. Möller, M. Paulus and R. Winter, Nonlinear pressure dependence of the interaction potential of dense protein solutions, Phys. Rev. Lett., 2011, 106(17), 178102 CrossRef PubMed.
Footnotes |
| † Electronic supplementary information (ESI) available. See DOI: 10.1039/c6cp08809k |
| ‡ Current address: EMBL c/o DESY, Notkestr. 85, Geb. 25a, 22607 Hamburg, Germany. |
| This journal is © the Owner Societies 2017 |