
 Open Access Article
 This Open Access Article is licensed under a Creative Commons Attribution-Non Commercial 3.0 Unported Licence
Crystalline structure and thermotropic behavior of alkyltrimethylphosphonium amphiphiles†
Ana
Gamarra
,
Lourdes
Urpí
,
Antxon
Martínez de Ilarduya
and
Sebastián
Muñoz-Guerra
 *
*
Departament d'Enginyeria Química, Universitat Politècnica de Catalunya, ETSEIB, Diagonal 647, Barcelona 08028, Spain. E-mail: sebastian.munoz@upc.edu
First published on 5th January 2017
Abstract
Quaternary organophosphonium salts bearing long alkyl chains are cationic surfactants of interest owing to their physical and biological properties. In the present work, the crystal structure and thermotropic behavior of the homologous series of alkyltrimethylphosphonium bromides (nATMP·Br), with the alkyl chain containing an even number (n) of carbon atoms from 12 to 22, have been examined within the 0–300 °C range of temperatures. These compounds were shown to be resistant to heat up to ∼390 °C. The phases adopted at different temperatures were detected by DSC, and the structural changes involved in the phase transitions have been characterized by simultaneous WAXS and SAXS carried out in real-time, and by polarizing optical microscopy as well. Three or four phases were identified for n = 12 and 14 or n ≥ 16, respectively, in agreement with the heat exchange peaks observed by DSC. The phase existing at room temperature (Ph-I) was found to be fully crystalline and its crystal lattice was determined by single-crystal X-ray diffraction methods. Ph-II consisted of a semicrystalline structure that can be categorized as Smectic-B with the crystallized ionic pairs hexagonally arranged in layers and the molten alkyl chain confined in the interlayer space. Ph-II of 12ATMP·Br and 14ATMP·Br directly isotropicized upon heating at ∼220 °C, whereas for n ≥ 16, it converted into a Smectic-A phase (Ph-III) that needed to be heated above ∼240 °C to become isotropic (Ph-Is). The correlation existing between the thermal behavior, phase structure and length of the alkyl side chain has been demonstrated.
Introduction
Tetraalkylphosphonium salts bearing long alkyl chains constitute a family of cationic amphiphiles comparable to the widely known tetraalkylammonium family but that offers superior properties in some aspects. Quaternary organophosphonium compounds are particularly attractive as ionic liquids because they display high thermal stability1 and may be designed with a wide diversity of structures, some of them being able to melt at sub-ambient temperatures.2 Applications as solvents,3–5 phase transfer catalysts,6 or exfoliation agents for nanoclays,7–9 among others have been recently explored for some of these compounds. They are also interesting as building blocks in the design of antimicrobial materials since it has been proved that they are less cytotoxic than organoammonium compounds.10,11 Nevertheless the research carried out to date on organophosphonium salts, and in particular on tetraalkylphosphonium ones, is much less extensive than on their ammonium analogues, so the current knowledge on their structure and properties is relatively limited.12 Such comparative backwardness is mainly due to the synthesis difficulties associated with phosphorus chemistry as well as the restricted availability of trialkylphosphines that are commonly used as starting materials.The ability of tetraalkylammonium surfactants to form thermotropic mesophases is a well-known fact that has been investigated for a good number of systems.13 These compounds usually adopt an amphiphilic arrangement with the ammonium-halide ionic pairs aligned in layers and the hydrophobic alkyl chains in a more or less extended conformation filling the interlayer spacing.14 Tetraalkylphosphonium surfactants are able to adopt similar arrangements but covering broader domains of temperatures and displaying higher clearing points.15 Fortunately, the characterization of the high-temperature phases found in phosphonium surfactants is feasible, thanks to the good thermal stability displayed by these systems. Nevertheless, the literature dealing with the structure and thermal behavior of phosphonium-based surfactants is scarce, a meager situation that is evidenced when compared with the vast amount of information that has been amassed on commercialized surfactants based on tetraalkylammonium salts. To the best of our knowledge, the few studies carried out to date on phosphonium-based surfactants concern salts bearing two, three or four long alkyl chains,15–18 whereas no study has been addressed to examine those containing only one long alkyl chain except that of Kanazawa et al. which was devoted to evaluating the antimicrobial properties of chloride salts of some of these compounds.19
In this paper we wish to report on a series of alkyltrimethylphosphonium bromide surfactants, abbreviated as nATMP·Br (Scheme 1), with the alkyl chain being linear and containing an even number of carbon atoms (n) ranging from 12 to 22. The primary purpose of the work is to provide physicochemical knowledge on the structure and properties of this family of surfactants of potential interest for novel applications, in particular for the synthesis of surfactant–polymer complexes. Comb-like complexes generated by ionic coupling of naturally-occurring polyelectrolytes with ionic surfactants are receiving exceptional attention.20 Thus complexes made of bacterially produced poly(γ-glutamic acid)21 or certain polyuronic acids22,23 and alkyltrimethylammonium soaps have been prepared and demonstrated to be useful for drug encapsulation24 and also as compatibilizers25 for bionanocomposites. For the development of new complexes based on alkytrimethylphosphonium surfactants, the structure of these compounds should be determined and their basic properties properly evaluated. This paper includes the synthesis of the nATMP·Br series, the characterization of their thermal transitions, and the structural analysis of the thermotropic phases that they are able to adopt as a function of temperature.
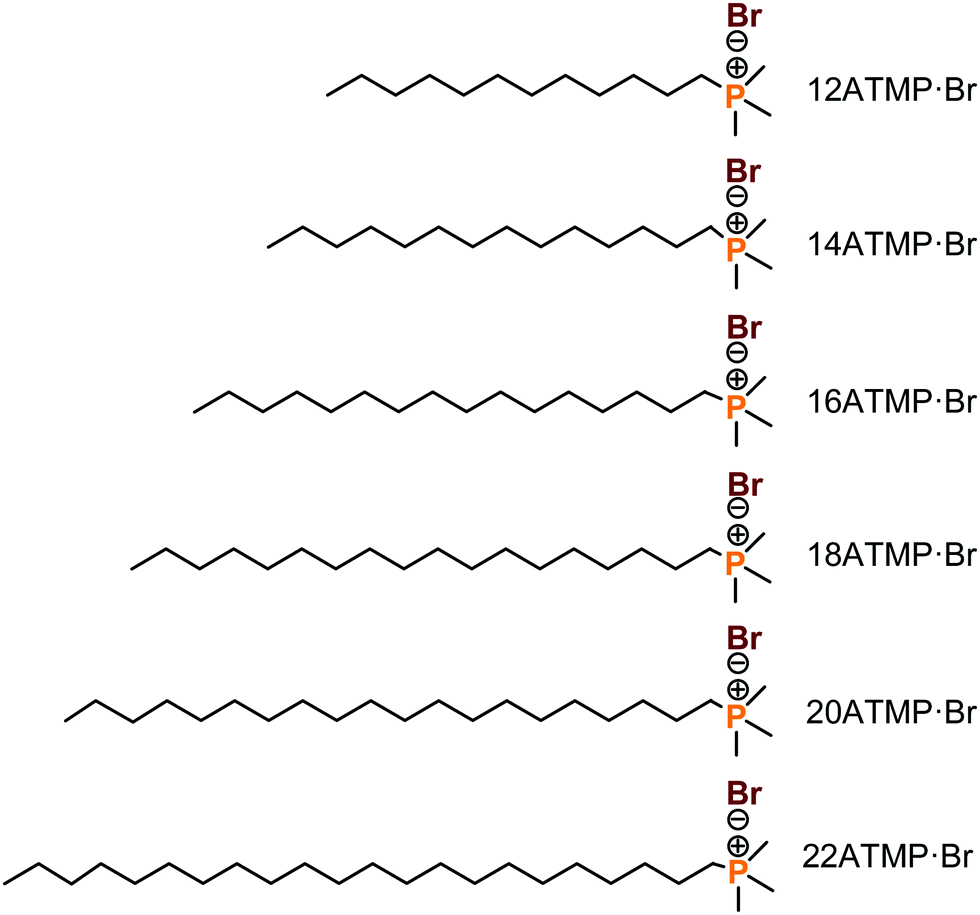 | ||
| Scheme 1 Chemical formulae of nATMP·Br surfactants. | ||
Experimental
Materials
1-Bromododecane (97%), 1-bromohexadecane (97%), 1-bromooctadecane (96%), 1-bromoeicosane (98%), 1-bromodocosane (96%) and trimethylphosphine solution in toluene (1 M) were supplied by Sigma-Aldrich, and 1-bromotetradecane (97%) was from Merck. They all were used as received. Solvents were obtained from Panreac and used without further purification.Synthesis of alkyltrimethylphosphonium bromides
The synthesis of alkyltrimethylphosphonium surfactants (nATMP·Br) was carried out as follows. 5 mL of a 1.0 M solution of trimethylphosphine (TMP) in toluene (5 mmol) was slowly added to 1-bromoalkane (5.5 mmol) preheated at 80 °C under a nitrogen atmosphere. The mixture was then heated in a silicone oil bath up to 116 °C and maintained at that temperature under stirring for a period of 18 to 24 h depending on the value of n. The precipitate formed at the end of the reaction period was collected by filtration. In order to remove the excess of bromoalkane, the precipitate was repeatedly washed with toluene and then dried under vacuum for 48 h. The nATMP·Br salts were recovered as white powders in yields ranging between 70 and 90%. They all were soluble in a variety of organic solvents such as chloroform and methanol, and also in water at temperatures between 20 °C and 60 °C depending on the length of the alkyl chain. Synthesis data for these compounds are given in full detail in the ESI.†Elemental analysis and spectroscopy
Elemental analyses were carried out at the Servei de Microanàlisi at IQAC (Barcelona). Tests were done using a Flash 1112 elemental microanalyser (A5) which was calibrated with appropriate standards of known composition. C and H amounts were determined by the dynamic flash combustion method using He as a carrier gas. The results are given in (w/w) percentages and in duplicate.FT-IR spectra were recorded within the 4000–600 cm−1 interval for powder samples on a FT-IR Perkin Elmer Frontier spectrophotometer provided with a universal ATR sampling accessory for solid samples. 1H and 13C NMR spectra were recorded on a Bruker AMX-300 NMR instrument and using TMS as an internal reference. The spectra were registered at 300.1 MHz for 1H NMR and at 75.5 MHz for 13C NMR MHz for samples dissolved in deuterated chloroform.
Krafft temperatures and critical micelle concentrations (cmc)
Krafft temperatures (TKrafft) were estimated visually. Samples were prepared as follows: 1% (w/w) mixtures of nATMP·Br in water were heated until dissolution and then cooled down to room temperature and kept in a refrigerator at 5 °C for 24 hours. The cooled samples were then introduced in a water bath provided with a magnetic stirrer and heated up in steps of 1 °C every 15 min. The temperature at which turbidity disappeared was taken as the approximate Krafft temperature. The cmc for n = 12, 14 and 16 were determined by 1H NMR following the evolution of the chemical shifts of specific signals of the surfactant with increasing concentration according to the procedure described in the literature.26,27 Samples were dissolved in D2O, and 1H NMR spectra were recorded at the selected temperature using the sodium salt of 3-(trimethylsilyl)-propanesulfonic acid as an internal reference.Thermal measurements
Thermogravimetric analyses were performed under an inert atmosphere with a Perkin-Elmer TGA6 thermobalance at heating rates of 10 °C min−1 using sample weights of 10–15 mg. Calorimetric measurements were performed with a Perkin-Elmer Pyris 1 DSC instrument calibrated with indium and zinc. Sample weights of about 2–5 mg were used to record heating–cooling cycles at rates of 10 °C min−1 within the temperature range of −30 to 280 °C under a nitrogen atmosphere.X-ray diffraction and optical microscopy
X-ray diffraction (XRD) using conventional light was performed in the “Centres Científics i Tecnològics de la Universitat de Barcelona” (CCiT). XRD patterns were registered at room temperature for powder samples, either obtained directly from synthesis or previously heated at selected temperatures. The diffractometer used was a PANalytical X’Pert PRO MPD theta/theta with Cu(Kα) radiation (λ = 0.15418 nm). The reflections collected were those appearing in the 1° ≤ θ ≤ 15° range. Real time X-ray diffraction studies were carried out using X-ray synchrotron radiation at the BL11 beamline (non-crystalline diffraction (NCD)), at ALBA (Cerdanyola del Vallès, Barcelona, Spain). Both SAXS and WAXS spectra were recorded simultaneously for powder samples subjected to heating–cooling cycles at rates of 10 or 0.5 °C min−1. The energy employed corresponded to a 0.10 nm wavelength, and spectra were calibrated with silver behenate (AgBh) and Cr2O3 for SAXS and WAXS, respectively.Optical microscopy was carried out on an Olympus BX51 polarizing optical microscope equipped with a digital camera and a Linkam THMS-600 hot stage provided with a nitrogen gas circulating system to avoid contact with air and humidity. Samples for observation were prepared by casting 1% (w/v) chloroform solutions of the surfactant on a microscope square glass coverslip, and the dried film was covered with another slide.
Single-crystal analysis
The 12ATMP·Br surfactant was subjected to structural analysis using a monocrystal that was grown by the vapor-diffusion technique at 20 °C. The applied procedure was as follows: a solution of the surfactant (0.5 mg mL−1) in CHCl3![[thin space (1/6-em)]](https://www.rsc.org/images/entities/char_2009.gif) :EtOAc (90:10) was prepared and distributed in a multi-well plate, which was then placed in a closed chamber and left to evaporate under an EtOAc saturated atmosphere. After several days a unique large monocrystal of 0.45 × 0.14 × 0.10 mm dimensions suitable for XRD analysis was formed. The selected crystal was mounted on a D8 Venture diffractometer provided with a multilayer monochromator Mo-Kα radiation (λ = 0.071073 nm), and the generated scattering was collected with an area detector Photon 100 CMOS. Unit cell parameters were determined from 7111 reflections within the θ range of 2.23° to 25.14°. Intensities of 25175 reflections collected within the 2.23°–25.39° angular range were measured. The structure was solved by direct methods and refined by the least-squares method (SHELXL-2014 program).28 A detailed description of the methodology used for the structure analysis is given in the ESI.†
:EtOAc (90:10) was prepared and distributed in a multi-well plate, which was then placed in a closed chamber and left to evaporate under an EtOAc saturated atmosphere. After several days a unique large monocrystal of 0.45 × 0.14 × 0.10 mm dimensions suitable for XRD analysis was formed. The selected crystal was mounted on a D8 Venture diffractometer provided with a multilayer monochromator Mo-Kα radiation (λ = 0.071073 nm), and the generated scattering was collected with an area detector Photon 100 CMOS. Unit cell parameters were determined from 7111 reflections within the θ range of 2.23° to 25.14°. Intensities of 25175 reflections collected within the 2.23°–25.39° angular range were measured. The structure was solved by direct methods and refined by the least-squares method (SHELXL-2014 program).28 A detailed description of the methodology used for the structure analysis is given in the ESI.†
Results and discussion
Synthesis and characterization of nATMP·Br
The alkyltrimethylphosphonium bromides (nATMP·Br) studied in this work were synthesized by a nucleophilic reaction of trimethylphosphine with the corresponding alkyl bromide at appropriately adjusted times and temperatures. Specific conditions used for reaction and yields obtained thence for every nATMP·Br are detailed in Table 1. The elemental composition of carbon and hydrogen of nATMP·Br was determined by combustion analysis and their chemical constitution was ascertained by both FT-IR and NMR spectroscopy. Infrared spectra showed bands at ∼990 and ∼715 cm−1 indicative of the presence of the trimethylphosphonium group29,30 as well as others at ∼2900–2850 and ∼1470 cm−1 arising from the C–H stretching and bending vibrations, respectively, whose absorbance increased with the length of the long alkyl chain. 1H and 13C NMR spectra were in full agreement with the structure expected for nATMP·Br with all the observed signals being appropriately assigned regarding both chemical shifts and intensities. The whole collection of spectra registered from the nATMP·Br series is reproduced in the ESI.†| n | t (h) | T (°C) | Yield (%) | Elemental analysisa | T Krafft (°C) | cmcc (mM) | |
|---|---|---|---|---|---|---|---|
| C (%) | H (%) | ||||||
| a In parenthesis, calculated values for the expected compositions. b Visually estimated for a 1% (w/w) concentration. c Measured by 1H NMR at 25 °C. | |||||||
| 12 | 16 | 116 | 70 | 55.53 (55.53) | 10.50 (10.59) | <0 | 9.9 |
| 14 | 17 | 116 | 80 | 58.03 (57.92) | 10.79 (10.90) | <0 | 2.7 |
| 16 | 18 | 116 | 85 | 60.06 (59.96) | 11.00 (11.16) | 15 | 0.65 |
| 18 | 20 | 116 | 70 | 61.56 (61.73) | 11.22 (11.38) | 30 | n.d. |
| 20 | 22 | 116 | 80 | 63.12 (63.26) | 11.37 (11.58) | 45 | n.d. |
| 22 | 24 | 116 | 70 | 64.70 (64.61) | 11.65 (11.75) | 55 | n.d. |
As expected, the solubility and aggregation properties of the nATMP·Br series depend on n. The Krafft temperatures (TKrafft) and the critical micellar concentrations (cmc) of the surfactants are listed in Table 1. The TKrafft of the phosphonium surfactants are lower than those displayed by their ammonium analogs31 with values falling below zero for n = 12 and 14. The cmc were measured by NMR for those members displaying TKrafft below room temperature, i.e. for n = 12, 14 and 16. As expected and according to what is observed in other ionic surfactant series, the cmc decreased exponentially as the length of the alkyl chain increased. It is remarkable that the values observed for this series are noticeably lower than those reported for the alkyltrimethylammonium series.26 A detailed account of cmc determination carried out by the NMR method is given in the ESI.†
Thermal stability
The TGA traces recorded for nATMP·Br surfactants under an inert atmosphere are depicted in Fig. 1, and the most relevant thermal decomposition parameters measured either directly from these traces or their derivative curves (ESI†) are listed in Table 2.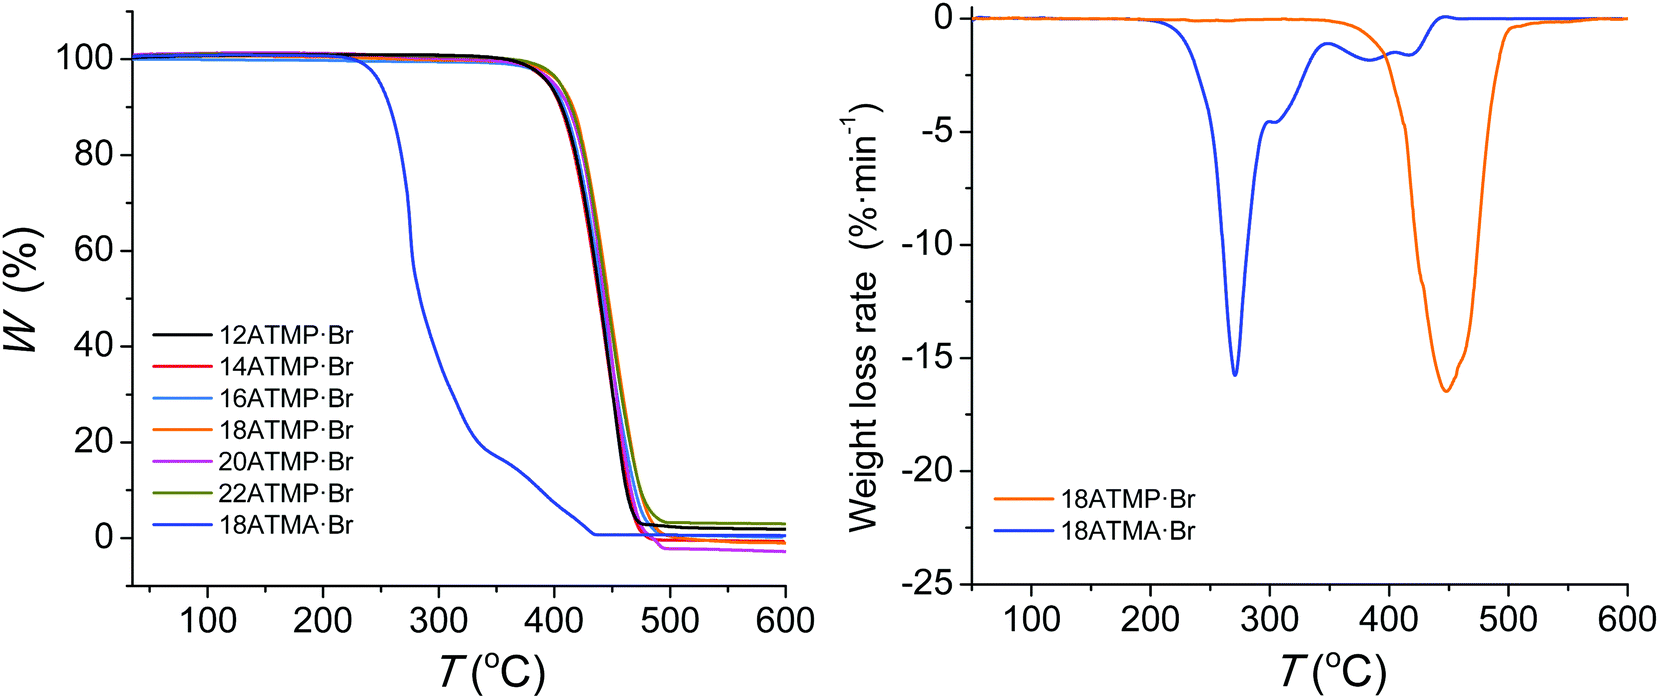 | ||
| Fig. 1 Left: TGA traces of the nATMP·Br series recorded under a nitrogen atmosphere. The trace produced by octadecyltrimethylammonium bromide (18ATMA·Br) is included for comparison. Right: Comparison of derivative traces of 18ATMP·Br and 18ATMA·Br. | ||
| n | TGAa | DSCb | ||||||||||
|---|---|---|---|---|---|---|---|---|---|---|---|---|
| o T d (°C) | max T d (°C) | W (%) | 1st heating | Cooling | 2nd heating | |||||||
| I/II | II/III | III/Is | II/I | III/II | Is/III | I/II | II/III | III/Is | ||||
| a o T d = onset decomposition temperature for 5% of weight loss; maxTd = maximum rate decomposition temperature; W = remaining weight after heating at 600 °C. b Temperatures (°C) and enthalpies (kJ mol−1, in parenthesis) observed upon heating and cooling for the indicated phase transitions. | ||||||||||||
| 12 | 395 | 443 | ∼1 | 66 (39.0) | 215 (12.1) | 40 (−14.0) | 212 (−11.5) | 59 (20.6) | 214 (11.5) | |||
| 14 | 395 | 443 | ∼0 | 75 (44.7) | 225 (11.3) | 59 (−13.2) | 218 (−11.4) | 73 (21.2) | 225 (10.9) | |||
| 16 | 398 | 443 | ∼0 | 84 (49.5) | 228 (10.4) | 241 (1.5) | 68 (−18.4) | 224 (−10.9) | 240 (−1.6) | 75 (21.2) | 228 (10.7) | 242 (1.6) |
| 18 | 399 | 444 | ∼1 | 89 (60.6) | 227 (10.1) | 260 (1.6) | 76 (−23.1) | 220 (−11.3) | 258 (−1.6) | 84 (24.3) | 227 (10.1) | 260 (1.5) |
| 20 | 400 | 445 | ∼0 | 91 (69.2) | 223 (10.0) | 263 (1.3) | 80 (−27.6) | 217 (−11.3) | 264 (−1.1) | 87 (28.9) | 224 (10.3) | 268 (1.2) |
| 22 | 405 | 445 | ∼3 | 99 (76.0) | 225 (10.8) | 271 (1.5) | 90 (−31.7) | 218 (−10.4) | 271 (−1.2) | 96 (33.5) | 225 (10.1) | 271 (1.2) |
Decomposition temperatures corresponding to a 5% loss of the initial weight (oTd) were above 390 °C, and the maximum decomposition rate temperatures were observed in the 440–445 °C range with a slight trend towards higher values as the length of the alkyl chain increased. Only one peak is displayed in the derivative plots indicating that decomposition takes place cleanly in one single step with almost negligible residual weight. This behavior contrasts with the thermal decomposition reported for octadecyltrimethylammonium bromide (18ATMA·Br), which displays a oTd below 200 °C and decomposes through a complex mechanism whose main step takes place at temperatures below 300 °C.15 The trace of this compound is included in Fig. 1 for comparison and the complete collection of traces of the nATMA·Br series is included in the ESI.† It is precisely the great thermal stability displayed by the nATMP·Br surfactants that make them particularly appealing for their use as clay modifiers in the design of nanocomposites with high resistance to heat.32 An isothermal assay carried out with 18ATMP·Br revealed that this compound lost less than 2% of its original weight after heating at 280 °C for three days under an inert atmosphere (ESI†).
Thermal transitions
The DSC analysis on nATMP·Br was aimed at bringing out the occurrence of thermal transitions, and it consisted of recording three heating–cooling cycles over the −30 to 280 °C range for each surfactant. The recorded DSC traces are depicted in Fig. 2, and temperatures and enthalpies associated with the heat exchanges observed in the traces are listed in Table 2.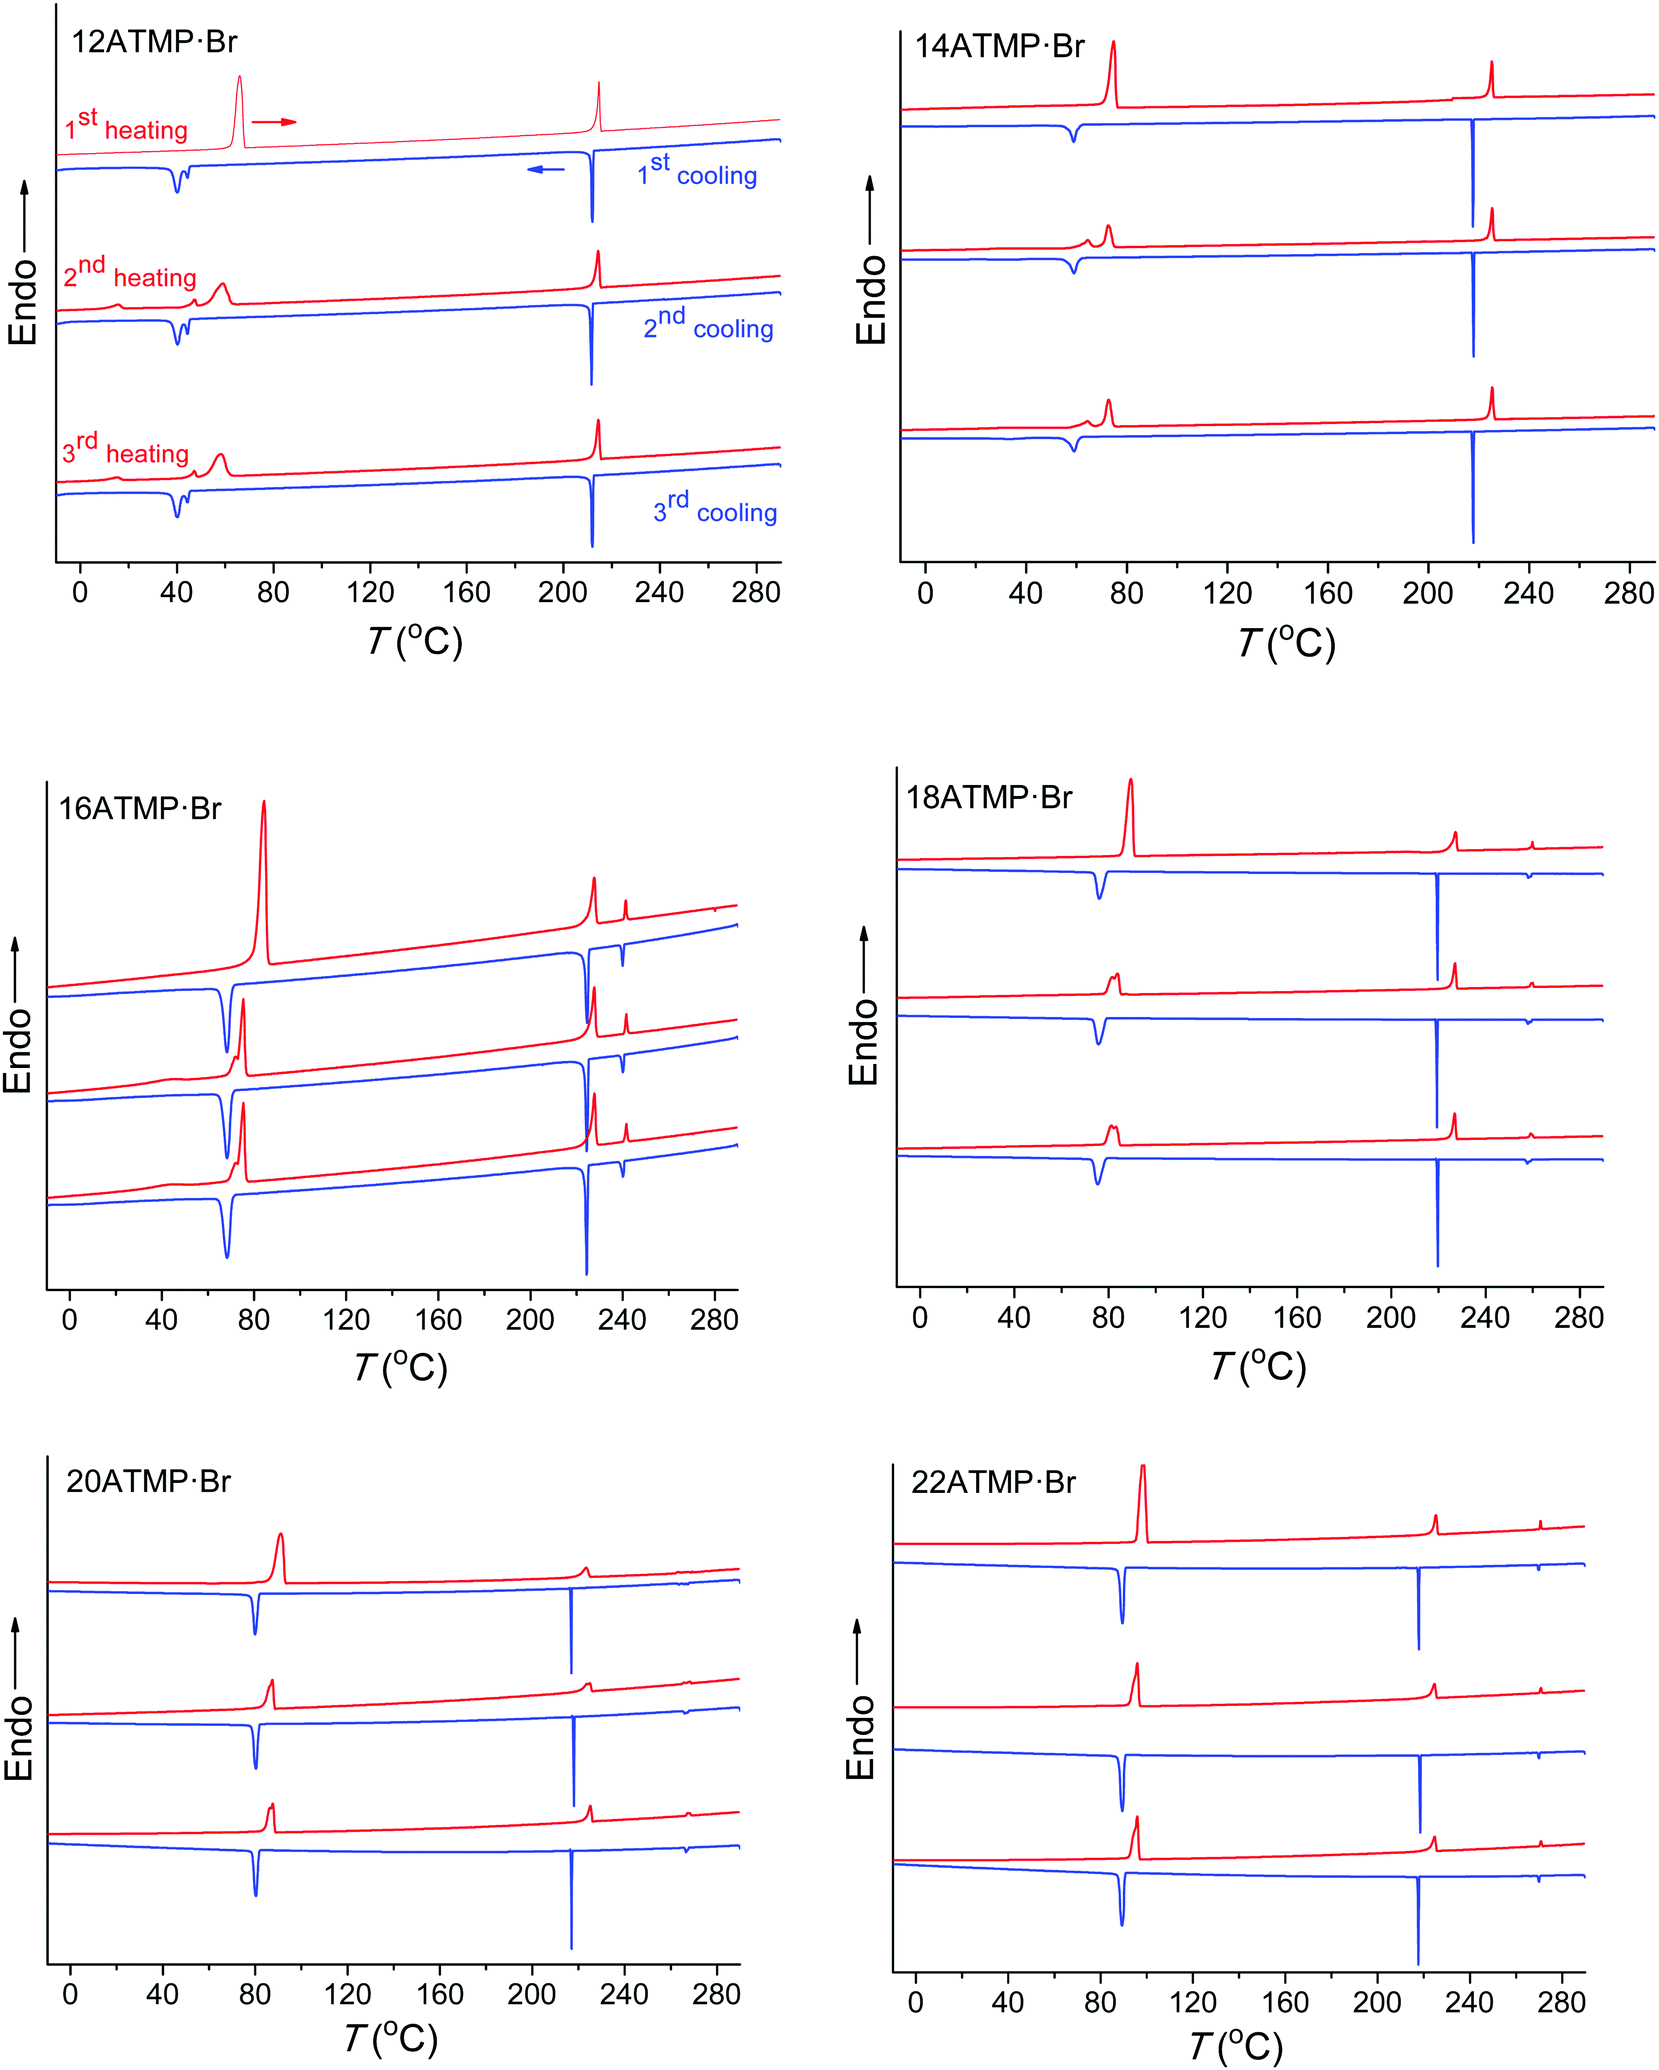 | ||
| Fig. 2 DSC traces of nATMP·Br for successive heating–cooling cycles over the −30 °C to 280 °C range. | ||
Two main endothermal peaks were observed in the first heating traces within the 60–100 °C and 210–225 °C ranges, respectively, both of them reappearing after cooling and reheating, and two exothermal peaks were also observed in their respective cooling traces at somewhat lower temperatures. It is noticed that the transition occurring in the low temperature region (below 100 °C) required a significant supercooling (∼10–25 °C) that steadily increased as the length of the alkyl chain diminished, and produced a material showing at the second heating an endothermic peak with the enthalpy reduced by about 30–40% of its initial value. These features strongly suggest that this transition must involve the interconversion between a crystal phase (Ph-I) and a molten phase (Ph-II) through the melting–crystallization processes that are homogenously nucleated.
Peak doubling occasionally observed for the Ph-I/Ph-II transition deserves additional comments. The main endothermal peak arising from this transition at the second and third heating traces of both 12ATMP·Br and 14ATMP·Br is accompanied by a second minor peak appearing at lower temperatures. The two peaks seem to move closer to each other as n increases so that a single sharp peak is only present for highest values of n. On the other hand, 12ATMP·Br is the only surfactant showing a double peak for the exotherm appearing for this transition at the cooling traces. The presence of double melting should be associated with the existence of two crystallite populations differing in size or/and crystal structure and that could crystallize in one or two stages depending on the mechanism implied in their nucleation. As it will be demonstrated below by polarizing optical microscopy, phase II generated upon cooling is not structurally homogeneous due to the slow conversion rate of phase III. Such heterogeneity may be the reason for the complexity observed for the heat exchange involved in the Ph-I/Ph-II transition. This point will be further discussed in the section dealing with the thermotropic behavior of the high temperature phases.
At difference with that observed at lower temperatures, the second heat exchange taking place above 200 °C showed almost negligible supercooling, and the initial endothermal peak was almost exactly reproduced in the second heating trace with both position and intensity essentially preserved at the original values. The transition associated with this peak-pair should therefore imply an interconversion between two liquid-crystal phases (Ph-II and Ph-III) that must be very closely interrelated. In addition to these two transitions, a third endo/exo heat exchange was detectable for nATMP·Br with n ≥ 16 when heated above 240 °C. This third transition takes place at temperatures steadily increasing with n and involves a very small heat exchange (∼1–1.5 kJ mol−1) that is not appreciably depending on n, and that reverses without perceivable supercooling. As it will be seen below, this peak is associated with the isotropization of Ph-III taking place in nATMP·Br with n ≥ 16.
Temperatures, enthalpies and entropies involved in the thermal transitions observed for nATMP·Br are plotted against n in Fig. 3. The almost linear trend followed by the three parameters as a function of n becomes clearly apparent in these plots and the comparative analysis of the plotted data provides insight into the nature of the transitions: (a) the sloping linear dependence of the Ph-I/Ph-II transition parameters, both T and ΔH, on n is consistent with the occurrence of a process entailing the melting/crystallization of the polymethylene chain. (b) In contrast, the invariance observed for these parameters in the Ph-II/Ph-III interconversion indicates that the trimethylphosphonium group must be the counterpart of the surfactant mainly implied in the rearrangement taking place in this transition with the alkyl chain playing an irrelevant role. On the other hand, the linear dependence on n of the Ph-III/Ph-Is transition temperature and the very small enthalpy involved therein suggest the occurrence of an entropically driven process leading to the complete disordering of the system. It is interesting to note that extrapolation of the T–n straight line of Ph-III/Ph-Is to n values of 14 and 12 includes the corresponding points of the Ph-II/Ph-III line. It could be therefore interpreted that for these two surfactants, Ph-II is directly converted into Ph-Is without going through Ph-III; Ph-III is then envisaged as an intermediate phase that exists only when the alkyl chains are sufficiently long. A scheme of the domains of existence for different phases is depicted in Fig. 4.
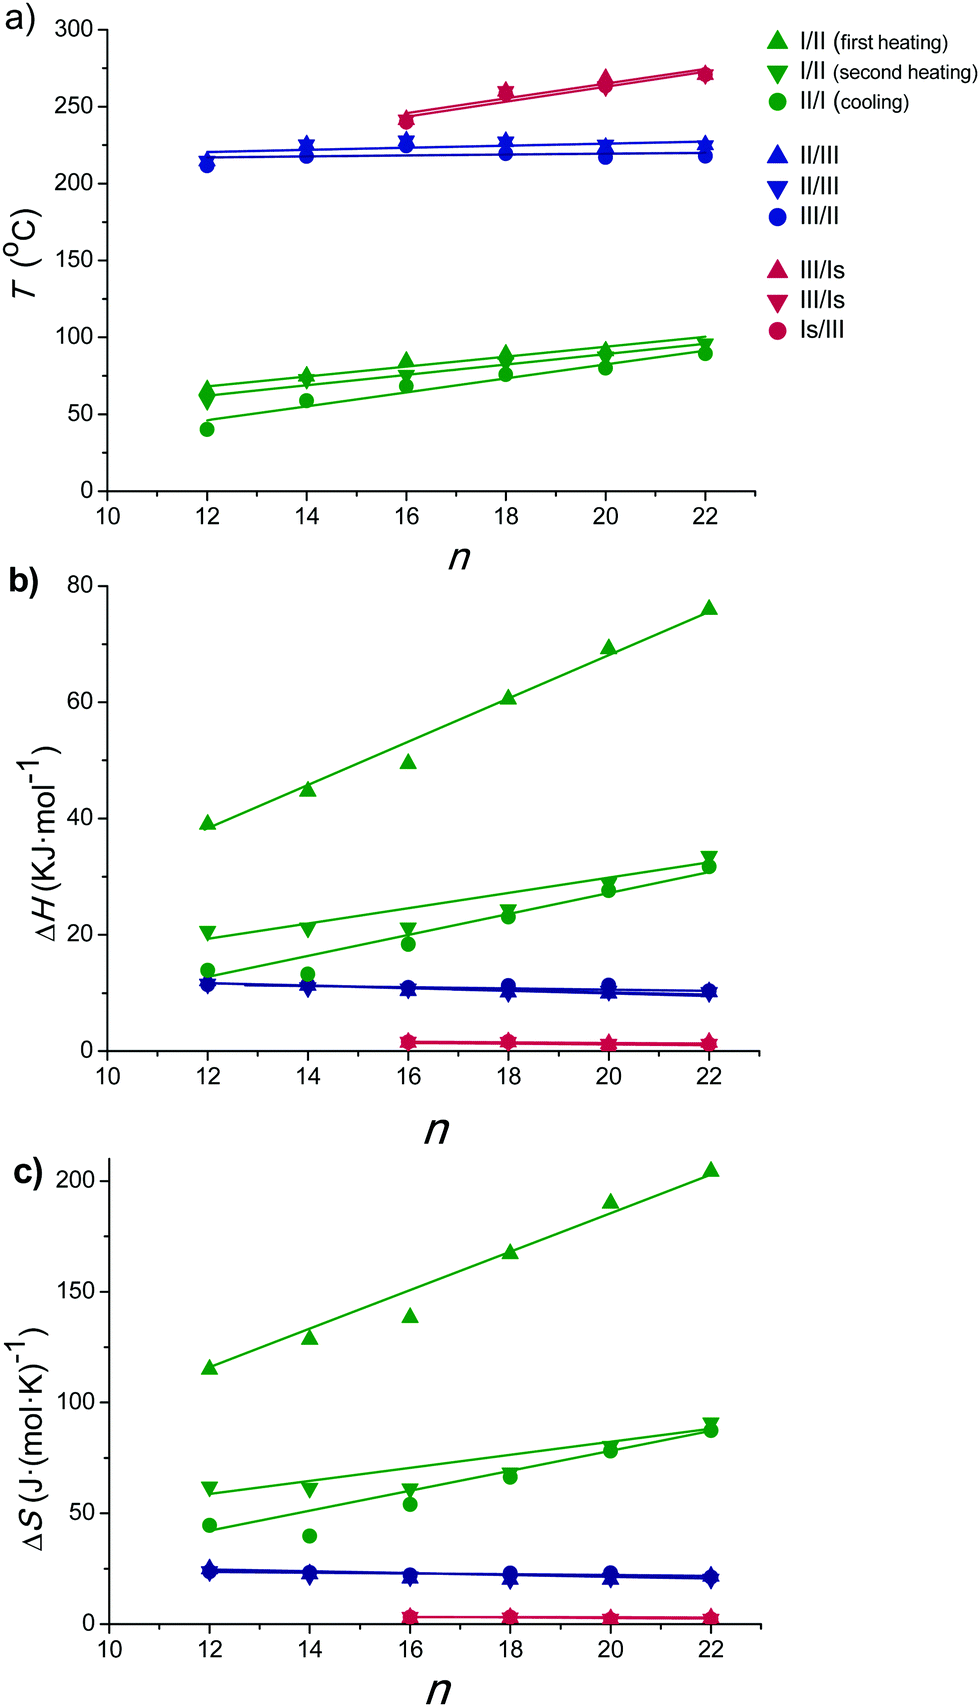 | ||
| Fig. 3 Phase transition temperatures (a), enthalpies (b) and entropies (c) of nATMP·Br surfactants as a function of n. In (b) both the negative ΔH registered at cooling and the positive ΔH registered at heating are represented in absolute values for a straight comparison. | ||
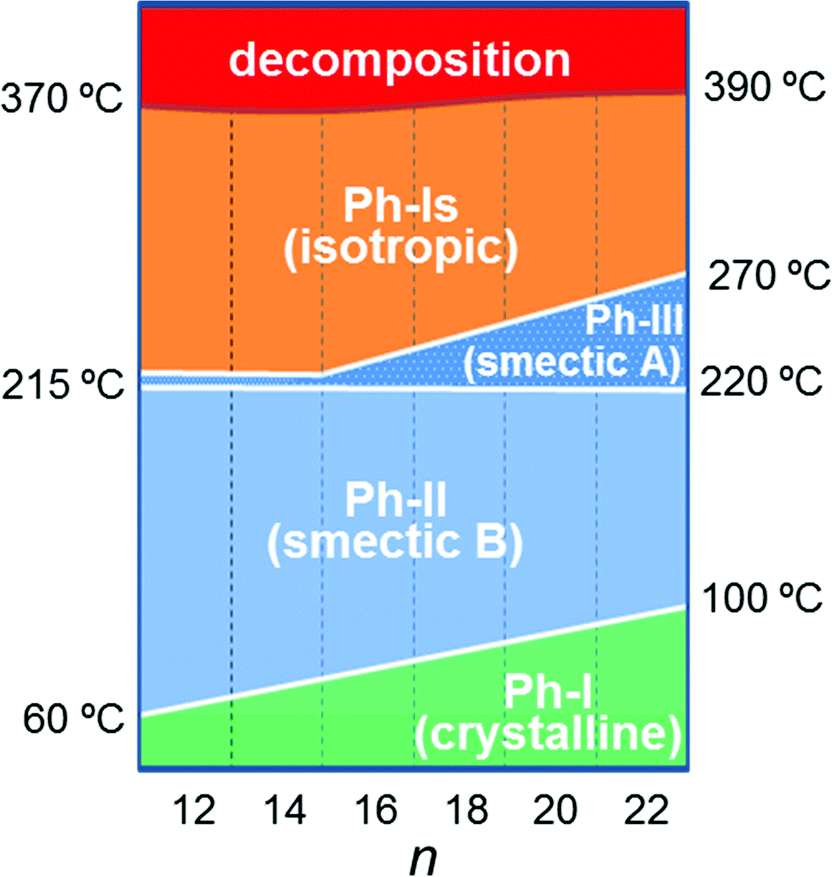 | ||
| Fig. 4 Domains of existence of nATMP·Br phases. Approximate temperatures are indicated. | ||
Crystal structure of nATMP·Br at room temperature (phase I)
Phase I (Ph-I) is the phase adopted by nATMP·Br surfactants at room temperature over a domain of existence that extends up to 60–100 °C depending on n. The scattering produced by this phase when subjected to X-ray diffraction (XRD) consists of a profile made of multiple discrete peaks characteristic of a crystalline state. In the SAXS region (≥1.5 nm), a very sharp strong peak corresponding to a repeat ranging from 1.8 up to 2.8 nm is conspicuously observed as n increases from 12 to 22 (Fig. 5a). According to what is known for other surfactants related to those made of a trimethylammonium group bearing a long polymethylene chain,33 such spacing is interpreted as arising from the periodical distance (L) characteristic of the layered biphasic structure usually adopted by these compounds. On the other hand, the diffraction pattern of nATMP·Br in the WAXS region (∼0.7–0.3 nm) consists of a good number of peaks of varying intensity with most of them being shared by the whole series (Fig. 5b), which strongly suggests that the same crystal structure is very probably adopted in all cases. It should be noted that some slight mismatching is more than reasonable to occur since minor deviations in the crystal lattice dimensions of nATMP·Br must be expected due to differences in the alkyl chain length.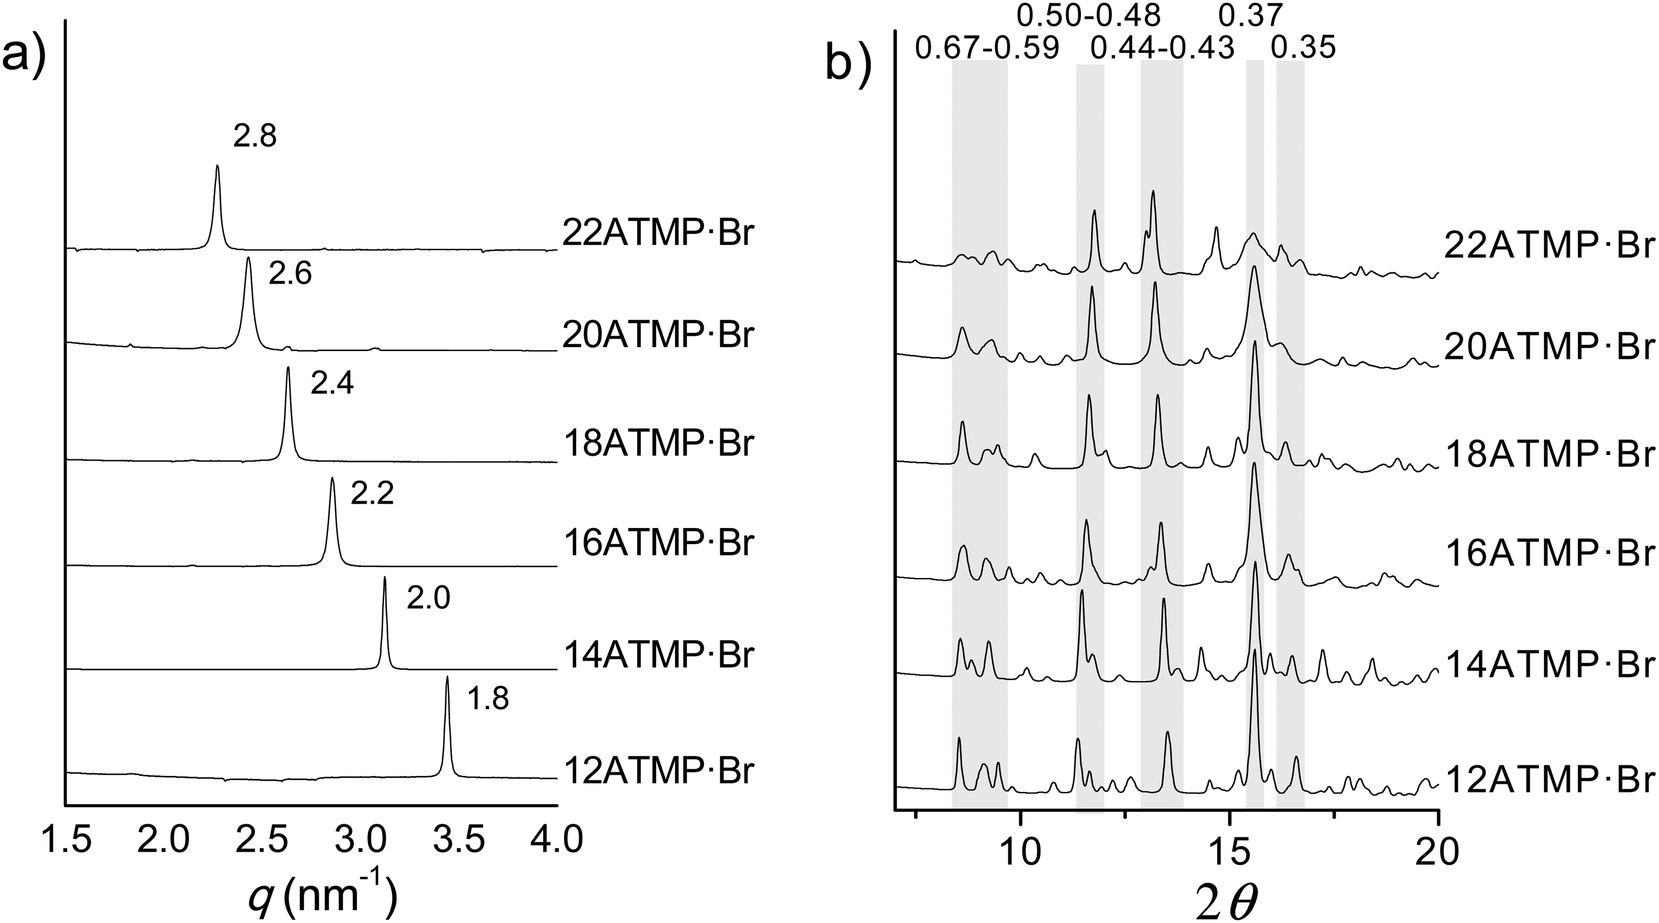 | ||
| Fig. 5 Comparison of powder X-ray diffraction profiles of nATMP·Br recorded at 25 °C. (a) SAXS region showing sharp reflections that arise from the periodical spacing characteristic of the layered structure. (b) WAXS region with shaded stripes embracing the 2θ intervals that show similar scattering. In both plots, spacings are indicated in nm. | ||
Upon precipitation from organic solution nATMP·Br rendered a microcrystalline powder with diffracting properties characteristic of Ph-I. In order to resolve the structure of this phase, a monocrystal suitable for single-crystal XRD analysis was grown from 12ATMP·Br using the vapor-diffusion method in complete absence of humidity. A picture of the analyzed crystal together with a full account of the crystallographic data collected and handled in this study is given in the ESI.† 12ATMP·Br crystallized in a monoclinic lattice belonging to the P21/c space group, with cell parameters: a = 1.829 nm, b = 0.797 nm, c = 1.267 nm, β = 93.119°, and with a single molecule in the asymmetric unit. The compound crystallized without inclusion of any solvent molecule. An ORTEP representation of the 12ATMP·Br molecule in the conformation adopted in the crystal as well as lists of its atomic coordinates and torsion angles are given in the ESI.† The alkyl chain is in a fully extended conformation and the phosphonium group deviates slightly from the average atomic plane defined for the chain. The same molecular arrangement has been found for the crystal structure of dodecylammonium bromide.34
A representation of the crystal structure of 12ATMP·Br as viewed along the b-axis is depicted in Fig. 6. The alkyl chain is oriented approximately parallel to the ac diagonal and molecules are packed in a biphasic array of alternating hydrophilic and hydrophobic layers. The hydrophilic layer is constituted by the trimethylphosphonium bromide groups and is approximately parallel to the bc plane of the crystal. Conversely, the hydrophobic domain contains the dodecyl chains, which are tilted about 30° to the plane defined by the phosphonium bromide ionic pairs. A similar conformation and packing were found for hexadecyltrimethylammonium bromide35 although it should be mentioned that there are other reported cases in which the long alkyl chain is not fully extended.36,37 In this structure the bromide ion is surrounded by five surfactant molecules but interacts with only one phosphonium atom which is separated by a distance of 0.413 nm. Such a distance is in agreement with that found in the trimethyl-2-phenylethylphosphonium bromide crystal (0.415 nm),38 but significantly shorter than that reported for tetra-decylphosphonium bromide (0.486 nm).39
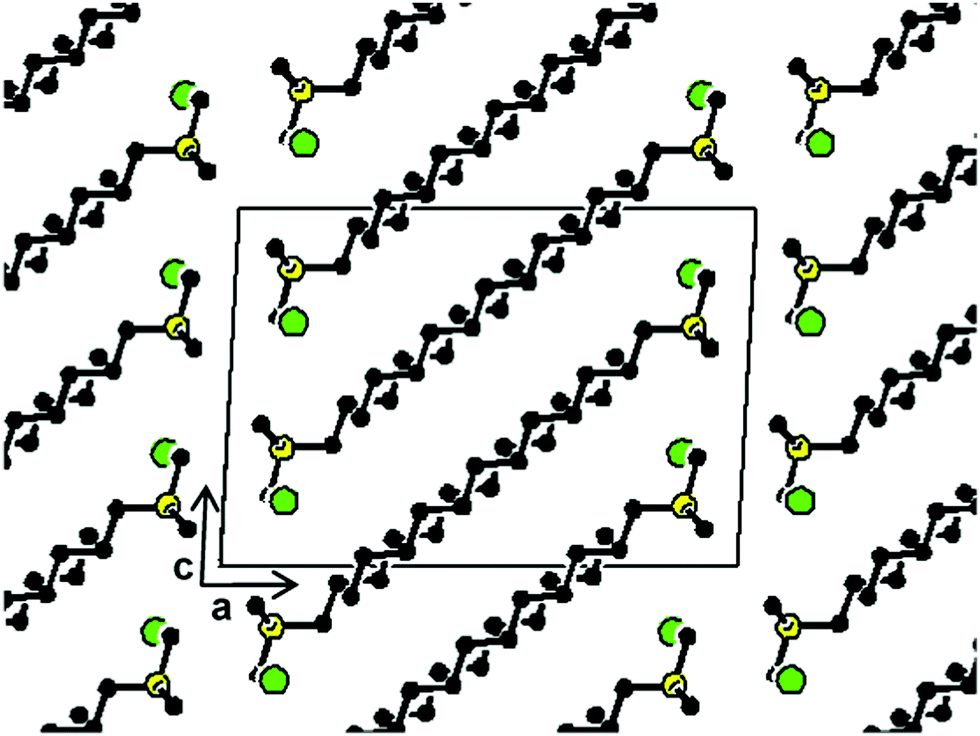 | ||
| Fig. 6 View of the 12ATMP·Br crystal (Ph-I) projected along the b-axis with the unit cell outlined. Code colors: bromide in green, phosphorus in yellow, carbon in black; hydrogens have been omitted for clarity. (Drawn using CERIUS2 4.9 program, Accelrys Inc.40) | ||
In Fig. 7 the powder XRD pattern simulated for a crystal lattice of 12ATMP·Br by means of the CERIUS2 4.9 program (Accelrys Inc)40 is compared to the pattern experimentally recorded for a powder sample of this surfactant obtained by precipitation from toluene. The crystal lattice used for simulation was modelled on the basis of the crystal unit cell determined by single crystal analysis. The extremely high coincidence attained between simulated and experimental profiles, including both SAXS and WAXS regions, leads to ascertain without ambiguity that the crystal structure adopted by 12ATMP·Br at room temperature (Ph-I) must be the same as that found in the monocrystal prepared by diffusion–evaporation.
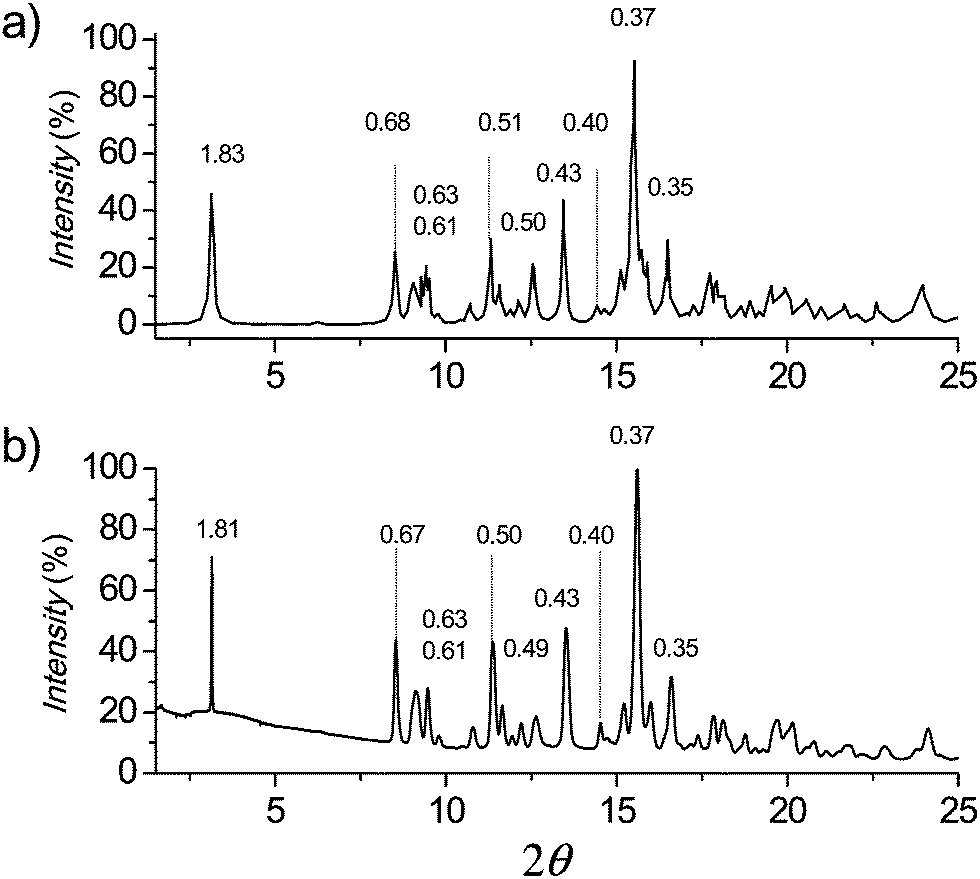 | ||
| Fig. 7 Comparison of powder X-ray diffraction profiles of 12ATMP·Br in Ph-I. (a) Profile simulated for the monoclinic crystal lattice found in the monocrystal. (b) Profile experimentally obtained for the powder sample obtained by precipitation. | ||
The respective crystal lattices were then modelled for all the other members of the nATMP·Br series by taking the 12ATMP·Br monoclinic crystal structure as a starting point. The methylene units necessary to appropriately enlarge the alkyl chain were added and the unit cell size was accordingly readjusted by changing both a and β parameters, while keeping b and c at the same value that they have in 12ATMP·Br. The XRD powder profiles obtained by simulation of the crystal lattices built for nATMP·Br, for n = 14 to 22, showed again an extreme similarity with those experimentally recorded for their respective powder samples, which allowed us to conclude that the monoclinic crystal structure determined for 12ATMP·Br can be successfully extrapolated to the whole series. The unit cell parameters resulting for each nATMP·Br surfactant are provided in the ESI,† and a comparison of the most characteristic XRD spacings calculated for such unit cells with those experimentally observed is provided in Table 3.
| n | 12 | 14 | 16 | 18 | 20 | 22 | ||||||
|---|---|---|---|---|---|---|---|---|---|---|---|---|
| Obs. | Calc. | Obs. | Calc. | Obs. | Calc. | Obs. | Calc. | Obs. | Calc. | Obs. | Calc. | |
| a The intensities of peaks (in parenthesis) are visually estimated for observed reflections and are given in normalized % for calculated reflections. b L refers to the 100 spacing. | ||||||||||||
| Phase I | ||||||||||||
| L | 1.8 | 1.8 | 2.0 | 2.0 | 2.2 | 2.2 | 2.4 | 2.4 | 2.6 | 2.6 | 2.8 | 2.8 |
| hkl | ||||||||||||
| 002 | 0.63m | 0.63 (9) | 0.63w | 0.63 (5) | n.o. | 0.62 (3) | 0.62m | 0.62 (3) | n.o. | — | n.o. | — |
| 011 | 0.67m | 0.67 (32) | 0.67m | 0.67 (22) | 0.67m | 0.67 (21) | 0.67m | 0.67 (29) | 0.67m | 0.67 (13) | 0.67m | 0.66 (11) |
| 012 | 0.50m | 0.50 (15) | 0.50m | 0.49 (14) | 0.50m | 0.49 (12) | 0.49m | 0.49 (8) | 0.49s | 0.48 (7) | 0.49s | 0.48 (5) |
| 013 | 0.37s | 0.37 (22) | 0.37s | 0.37 (18) | 0.37s | 0.37 (17) | 0.37s | 0.37 (12) | 0.37s | 0.37 (9) | 0.37s | 0.37 (7) |
| 121 | 0.37 (100) | 0.37 (100) | 0.37 (100) | 0.37 (100) | 0.37 (100) | 0.37 (100) | ||||||
| 020 | 0.40w | 0.40 (9) | 0.40m | 0.40 (4) | 0.40m | 0.40 (15) | 0.40m | — | 0.40m | 0.40 (10) | 0.40m | 0.40 (11) |
10![[2 with combining macron]](https://www.rsc.org/images/entities/char_0032_0304.gif) |
0.61m | 0.61 (10) | 0.62m | 0.62 (12) | 0.63m | 0.63 (10) | 0.63m | 0.64 (7) | 0.63m | 0.63 (4) | 0.62m | 0.63 (3) |
| 221 | 0.35m | 0.35 (34) | 0.35m | 0.35 (29) | 0.35m | 0.35 (23) | 0.35m | 0.35 (22) | 0.35m | 0.36 (18) | 0.35m | 0.36 (17) |
| 302 | 0.43m | 0.43 (53) | 0.43m | 0.44 (55) | 0.43m | 0.44 (51) | 0.43m | 0.44 (52) | 0.44s | 0.44 (44) | 0.44s | 0.45 (45) |
| Phase II | ||||||||||||
| L | 2.4 | 2.7 | 2.9 | 3.2 | 3.5 | 3.7 | ||||||
| hkl | ||||||||||||
| 010 | 0.63–0.62 | 0.64–0.60 | 0.62–0.60 | 0.65–0.62 | 0.64–0.62 | 0.64–0.62 | ||||||
| 011 | 0.36 | 0.36 | 0.36 | 0.36 | 0.36 | 0.36 | ||||||
| 020 | 0.31 | 0.31 | 0.31 | 0.31 | 0.31 | 0.31 | ||||||
| Phase III | ||||||||||||
| L | — | — | 3.0 | 3.3 | 3.6 | 3.8 | ||||||
Thermotropic behavior of nATMP·Br (phases II, III and Is)
The thermal transitions between the nATMP·Br phases that were identified by DSC were then examined by XRD with synchrotron radiation. For this purpose, SAXS and WAXS spectra were simultaneously recorded in real time for each surfactant subjected to heating/cooling at a rate of 10 °C min−1 within the 10–300 °C range. The heating traces registered every 5 °C over the tested temperature range are shown in Fig. 8 for 14ATMP·Br and 20ATMP·Br surfactants. In both cases clear changes were observed in the two scattering regions in agreement with the heat exchange peaks present in their respective DSC traces. In the SAXS region of 14ATMP·Br, the initial peak initially appearing at 2.0 nm jumped to 2.7 nm and it increased in intensity when the temperature reached ∼75 °C. Simultaneously, the multiple-peak scattering observed at room temperature in the WAXS region was reduced to three small groups of peaks centered at around 0.62, 0.36 and 0.31 nm. This pattern can be made to correspond to a two-dimensional pseudo-hexagonal array of a = 0.72 nm that characterizes Ph-II. A similar behavior was observed for 20ATMP·Br with the transition temperature being ∼90 °C, in agreement with the DSC results, and the long spacing peak jumping in this case from 2.6 nm to 3.5 nm. Nevertheless the SAXS response given by 14ATMP·Br and 20ATMP·Br to heating in the high temperature region, i.e. above 200 °C, was different. In the former case, the 2.7 nm peak disappeared at ∼220 °C, whereas in the latter, the 3.5 nm peak remained practically unchanged in intensity and slightly shifted to a spacing of 3.6 nm and eventually disappears when temperature was around to 265 °C. Such differences provide evidence of the occurrence of an additional thermotropic phase (Ph-III) prior to isotropization (Ph-Is) in 20ATMP·Br, and are consistent with the small endothermal peak that is detected in the DSC trace of this compound but that is absent in the case of 14ATMP·Br. Comparable results were attained in the thermal XRD analysis of the other nATMP·Br with 12ATMP·Br following the diffraction pattern observed for 14ATMP·Br and the remaining ones displaying a behavior similar to 20ATMP·Br (available in the ESI†). The XRD spacings collected for the full nATMP·Br series along the whole range of temperatures within which they have been examined are listed for every phase in Table 3 with indication of their corresponding Miller indices and peak intensities. These results definitively confirm the occurrence of the four phases evidenced by DSC with the domains of existence as depicted in Fig. 4.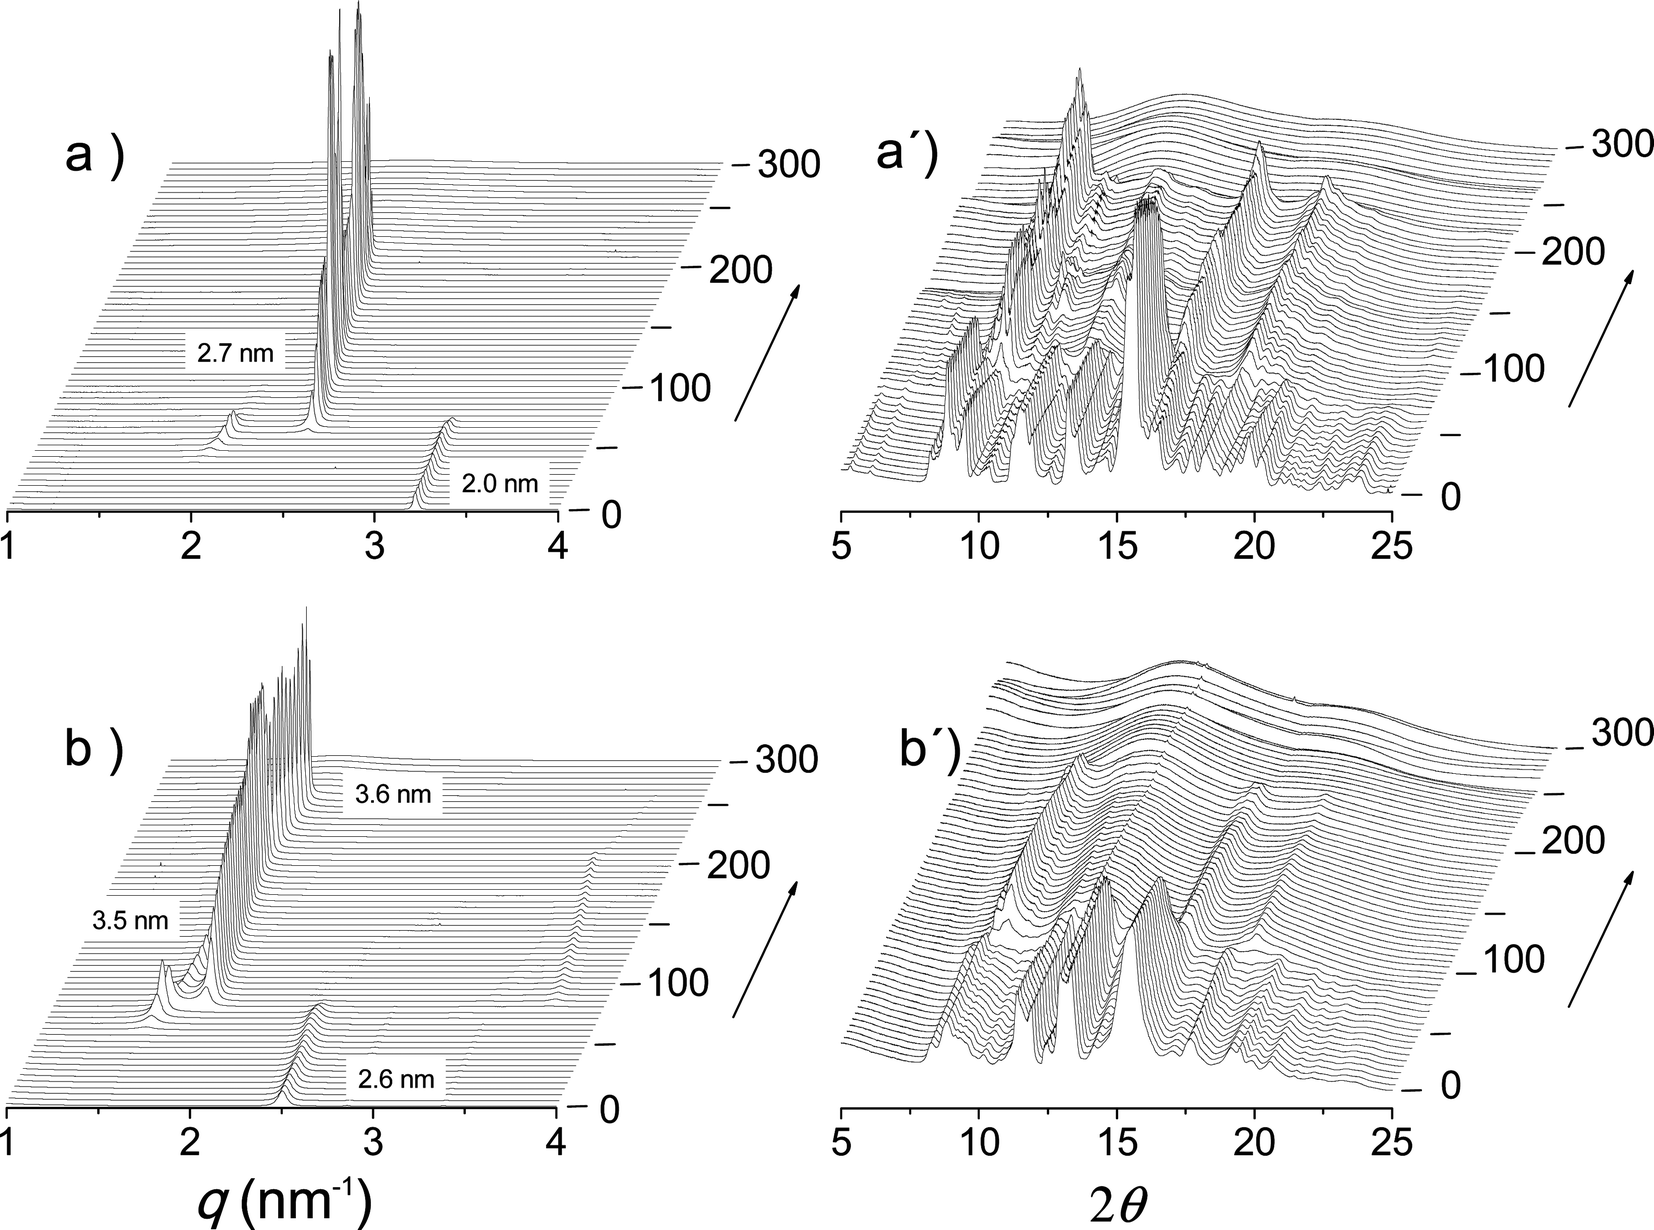 | ||
| Fig. 8 SAXS (left) and WAXS (right) plots of 14ATMP·Br (a, a′) and 20ATMP·Br (b, b′) registered during heating over the 0–300 °C range. | ||
It should be noted that thermally driven phase-interconversion in nATMP·Br is not a very fast process, in particular when it takes place at relatively low temperatures. The reversibility of the Ph-I ↔ Ph-II ↔ Ph-III ↔ Ph-Is interconversional sequence has been examined by thermal XRD at real time by applying heating/cooling cycles at rates between 5 and 0.5 °C min−1. It was observed that Ph-III and Ph-II were almost instantaneously recovered upon cooling from Ph-Is and Ph-III (or Ph-Is for n = 12 and 14) respectively, but the conversion of Ph-II into Ph-I was found to be incomplete within the applied time scale. However Ph-I could be fully recovered from Ph-II after several hours of standing at room temperature. The complete collection of XRD plots including both SAXS and WAXS profiles registered during heating/cooling cycles for the whole series is available in the ESI.†
The textures of the phases characterized for nATMP·Br were evidenced by polarizing optical microscopy observation carried out on heated/cooled samples along the same temperature ranges as used for DSC and XRD analyses. Representative optical micrographs of the three phases adopted by 14ATMP·Br are shown in Fig. 9. Pictures were taken from the same area of the surfactant film (initially Ph-I), which was first heated to 250 °C for isotropization (Ph-Is) and then slowly cooled down to room temperature to recover Ph-I by passing through Ph-II. The observed differences in the texture of Ph-I before and after treatment are reasonable due to differences in thermal history and also to a probably incomplete conversion of Ph-II. The texture displayed by Ph-II at 150 °C is indicative of a smectic arrangement although not so clearly as to be able to identify the smectic phase that it is dealing with.
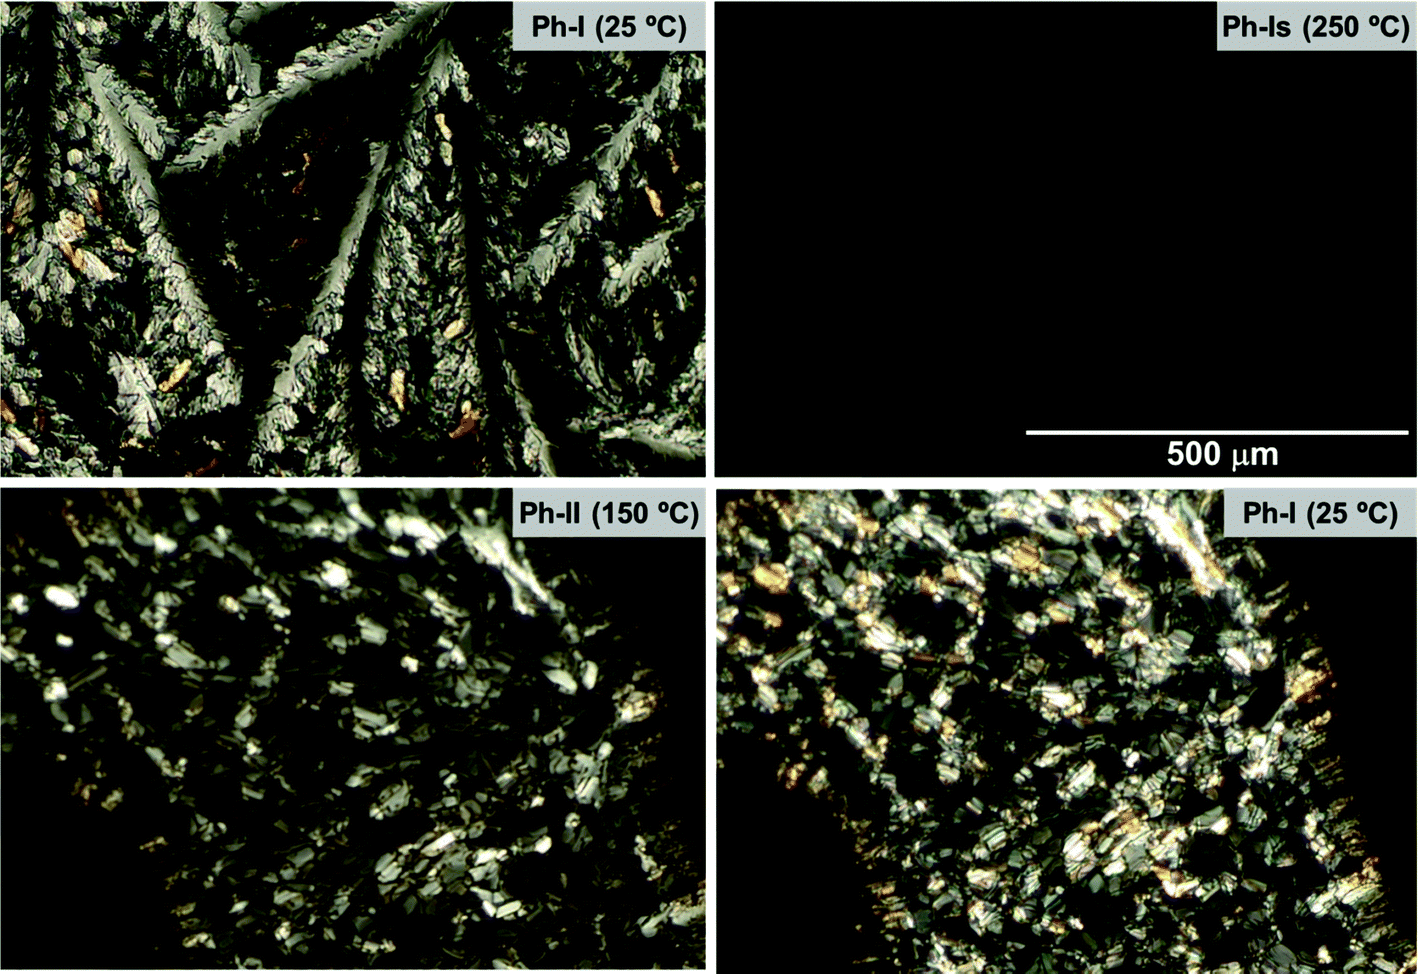 | ||
| Fig. 9 POM micrographs of 14ATMP·Br recorded at the indicated temperatures. | ||
The POM pictures recorded for 20ATMP·Br following a similar protocol are depicted in Fig. 10. In this case the four phases previously identified for this compound by DSC and XRD were clearly evidenced. The initial microcrystalline powder of Ph-I that is observed at room temperature was first isotropicized at 300 °C (Ph-Is). Upon cooling at 230 °C the isotropic phase converted into Ph-III displaying a focal-conical fan-like texture characteristic of a Smectic-A structure. Upon further cooling to 190 °C, the morphology slightly changed to show a more polygonal texture lacking fan shapes but consistent with the occurrence of a Smectic-B phase (Ph-II). A careful inspection of the pictures recorded along the whole Ph-II domain of temperatures, reveals for this phase the presence of frequent non-regular striations that intensify as temperature decreases. The Ph-I recovered by cooling at 30 °C displays conspicuous black stripes reminiscent of the striations present in Ph-II. This is a very interesting observation that brings out the close structural interrelation between the semicrystalline Ph-II and the fully crystalline Ph-I, and that could account for the complexity observed for the heat exchange observed for the Ph-I/Ph-II transition by DSC (Fig. 2). A complete assortment of POM pictures illustrating the phase textures for the whole series of nATMP·Br is included in the ESI.†
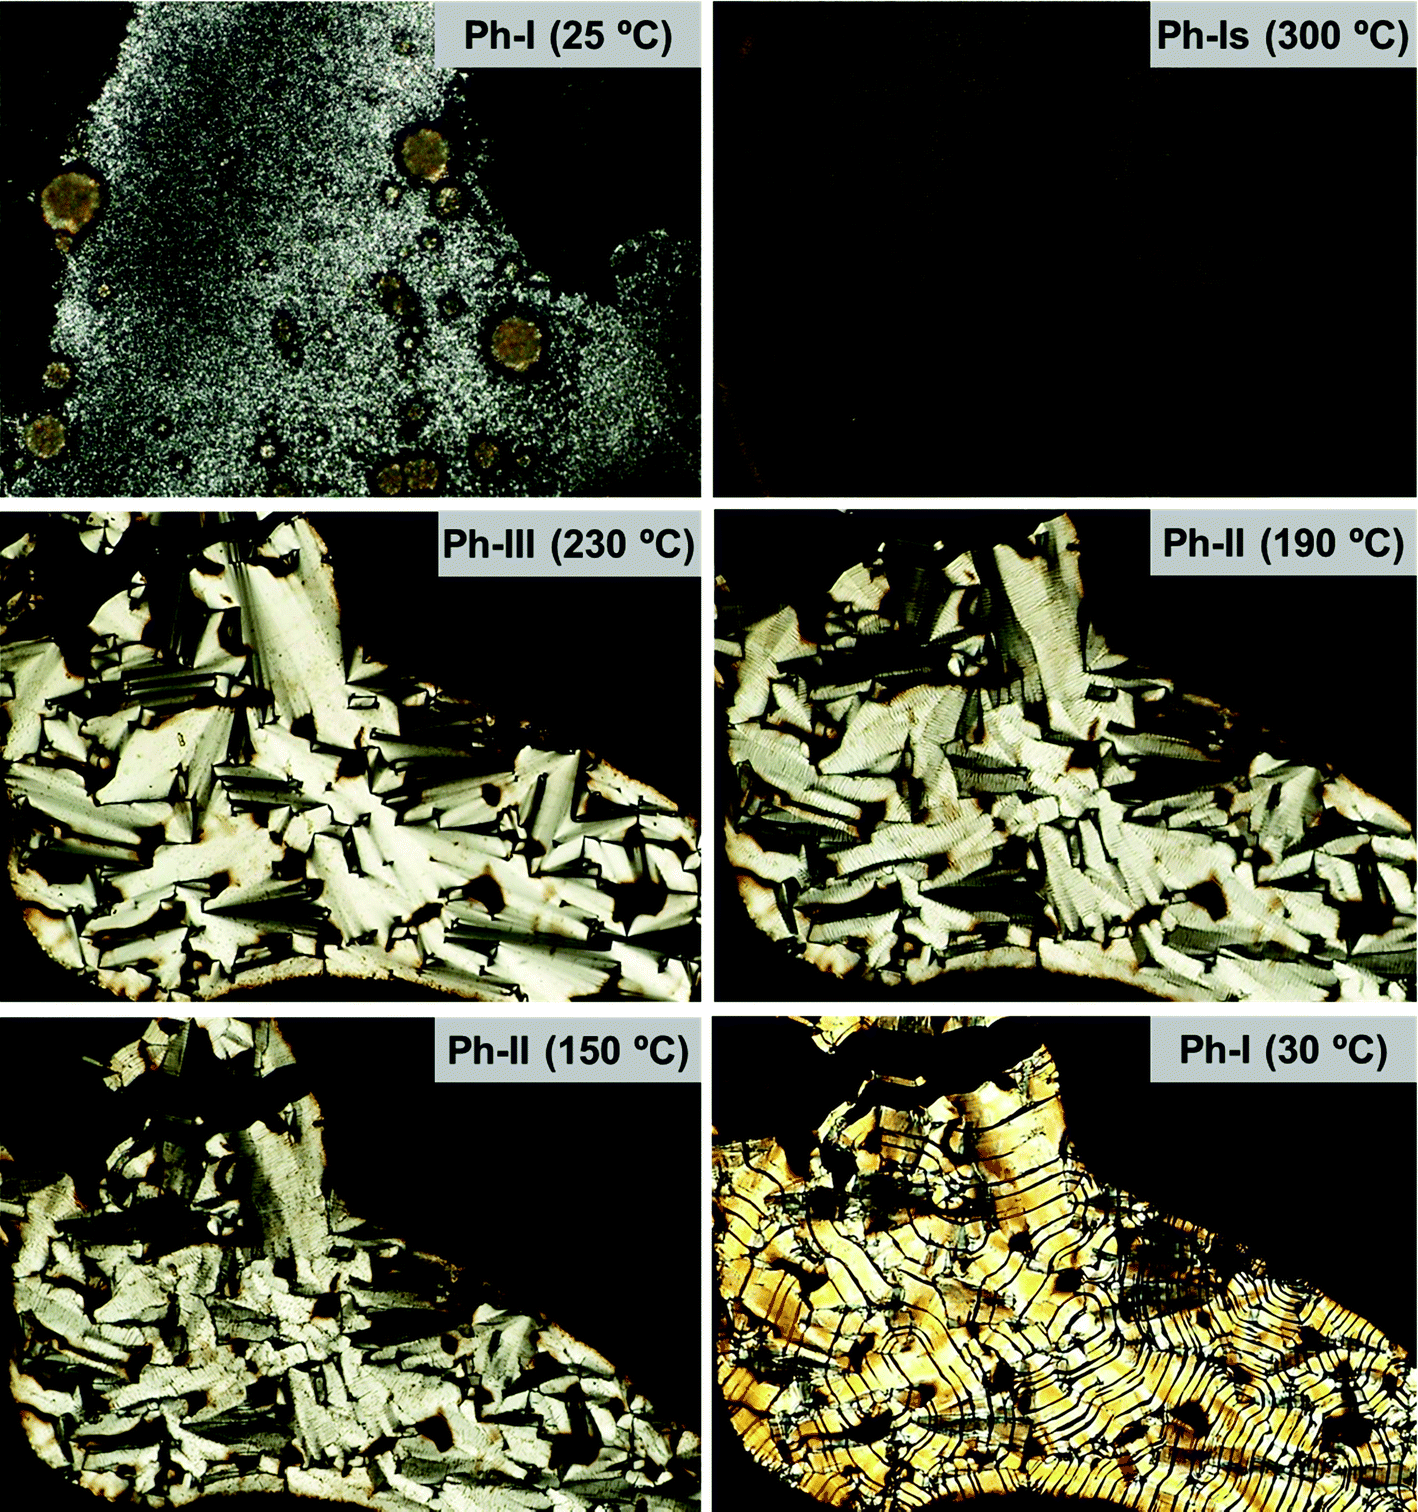 | ||
| Fig. 10 POM micrographs of 20ATMP·Br recorded at the indicated temperatures. | ||
Molecular arrangements in the nATMP·Br phases
The L values for the nATMP·Br phases displaying long-range order are plotted against n in Fig. 11. A remarkable feature of this plot is that an almost straight linear fitting is observed for every phase and that lines with very similar equations in both the gradient and the L-intercept are displayed for the phases formed upon heating (Ph-II and Ph-III). On the other hand, the L–n points for Ph-I become almost perfectly aligned along a straight line that is significantly displaced downwards and has a slightly smaller slope. The graphical analysis of the L–n plots reveals relevant details of the phase geometry as they are the thickness of both the polar layer containing the trimethylphosphonium-bromide pairs (L0) and the paraffinic layer containing the long alkyl chains (L − L0). The ratio of L − L0 to the length of the alkyl chain in the all-trans conformation (l) gives indication of the shortening undergone by the structure due to chain tilting, degree of interpenetration or occurrence of gauche conformation effects. The results of these calculations are compared in Table 4.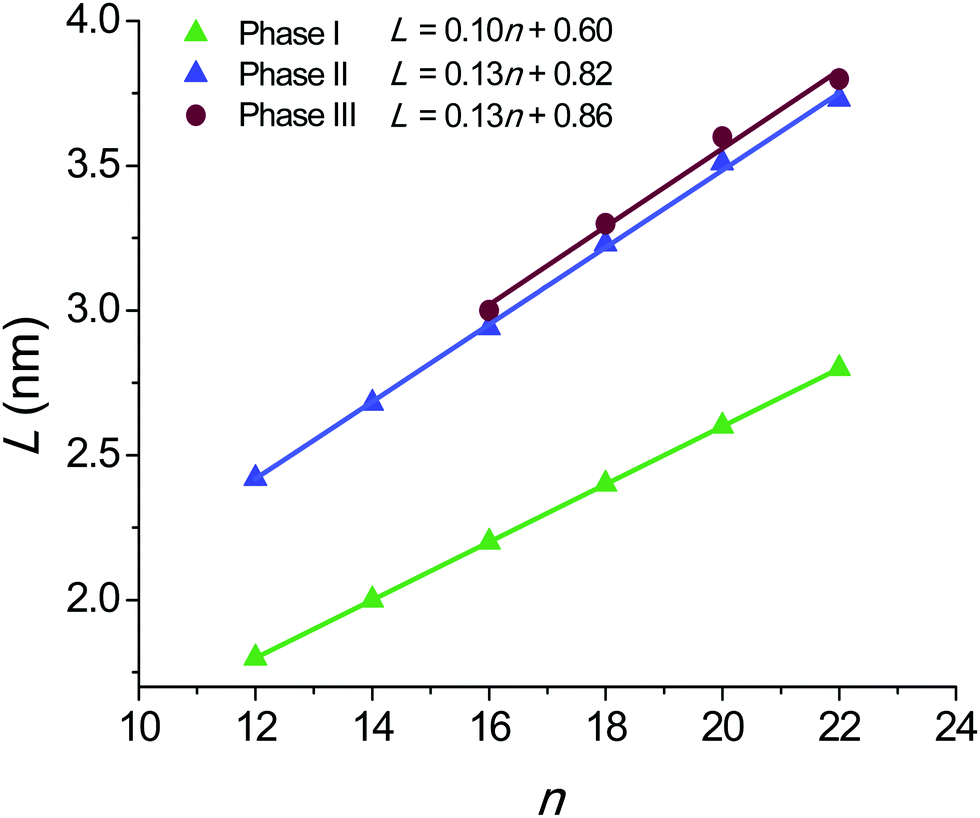 | ||
| Fig. 11 Plot of the long spacing L measured by SAXS against n for the crystalline and liquid-crystal phases found in nATMP·Br. | ||
| n | l | Phase I | Phase II | Phase III | ||||||
|---|---|---|---|---|---|---|---|---|---|---|
| L | L 0 | (L − L0)/l | L | L 0 | (L − L0)/l | L | L 0 | (L − L0)/l | ||
| a Length of the alkyl chain in a fully extended conformation. b Interplanar spacing experimentally observed by SAXS. c Thickness of the Me3P+ Br− ionic-pair layer. | ||||||||||
| 12 | 1.5 | 1.8 | 0.6 | 0.80 | 2.4 | 0.82 | 1.06 | — | — | — |
| 14 | 1.75 | 2.0 | 0.6 | 0.80 | 2.7 | 0.82 | 1.06 | — | — | — |
| 16 | 2.0 | 2.2 | 0.6 | 0.80 | 2.9 | 0.82 | 1.06 | 3.0 | 0.86 | 1.06 |
| 18 | 2.25 | 2.4 | 0.6 | 0.80 | 3.2 | 0.82 | 1.06 | 3.3 | 0.86 | 1.06 |
| 20 | 2.5 | 2.6 | 0.6 | 0.80 | 3.5 | 0.82 | 1.06 | 3.6 | 0.86 | 1.06 |
| 22 | 2.75 | 2.8 | 0.6 | 0.80 | 3.7 | 0.82 | 1.06 | 3.8 | 0.86 | 1.06 |
The L–n straight line for Ph-I has a slope of 0.1 nm per CH2 and an L-intercept of 0.6 nm. The shrinkage ratio of the paraffinic layer is pretty constant along the series with a value of 0.80. These data are in full agreement with the molecular arrangement put forward for the crystal structure of these compounds on the basis of the monocrystal XRD analysis of 12ATMP·Br, i.e. the alkyl chains are crystallized in an almost fully interdigitated arrangement and are tilted by about 37° with respect to the basal plane of the structure. Furthermore, the ionic layer thickness of 0.6 nm defined by the L-intercept is also consistent with the molecular volume calculated for the trimethylphosphonium-bromide pair as it is arranged in the crystal.
The geometric parameters resulting from the analysis of the Ph-II plot are clearly different from those calculated for Ph-I. The large expansion in L taking place when Ph-I converts into Ph-II entails a considerable enlargement of L0 in spite of the fact that the line slope now becomes about 0.13 nm per CH2. Also the (L − L0)/l ratio is larger for Ph-II than for Ph-I attaining now a value close to unity. These values are in agreement with a layered structure in which the alkyl chains are still fully or almost fully interdigitated and standing approximately normal to the basal plane of the structure. The larger thickness displayed by the polar layer can be explained by assuming that a rearrangement has occurred in the packing of the ion pairs within this layer. According to data provided by XRD it is reasonable to interpret therefore that Ph-II consists of a “semicrystalline” phase (Smectic-B) in which the polar heads of the surfactant remain crystallized in a pseudo-hexagonal array whereas the alkyl tails with a quasi-extended conformation are side-by-side packed without crystalline order.
Ph-III is observed only for nATMP·Br with n ≥ 16. The graphical differences found between L–n plots of Ph-II and Ph-III are non-relevant and only entail a small expansion (less than ∼5%) in both L and L0. However the scattering produced by Ph-III in the WAXS region merely consists of a broad plateau centered on ∼0.5 nm without showing any vestige of discrete scattering characteristic of the crystalline material. The structure of this phase is therefore envisaged as a Smetic-A phase in which trimethylphosphonium bromides continue to be confined in layers but without crystalline order and the alkyl chains are filling the interlayer paraffinic space in an arrangement close to that adopted in Ph-II.
A simple scheme sketching approximately the molecular arrangements adopted in Ph-I, Ph-II and Ph-III of nATMP·Br is depicted in Fig. 12. Accordingly the description of the thermal phase conversion process can be envisaged as follows: the I/II transition involves melting/crystallization of the paraffinic layer together with a slight rearrangement of the phosphonium-bromide pairs, which converts the monoclinic lattice present in Ph-I into the two-dimensional pseudo-hexagonal array present in Ph-II and vice versa. The transition from Ph-II to Ph-III implies the complete melting of the ionic layer and probably an increased disordering of the paraffinic core although the polymethylene chains must remain essentially extended to maintain the long periodicity revealed by SAXS. Finally complete disordering takes places when Ph-III is converted into the isotropic phase Ph-Is. The direct conversion of Ph-II into Ph-Is observed for 12ATMP·Br and 14ATMP·Br is thought to be due to the incapability of these compounds to generate a stable Ph-III because of the insufficient length that the polymethylene chain has in these cases. No evidence indirectly suggesting the presence of disordered mesoscopic structures in the Ph-Is of nATMP·Br has been met along this work. Further specific studies supported by microcalorimetry and spectroscopy should be made in order to discard definitively the occurrence of such structures in these surfactants.
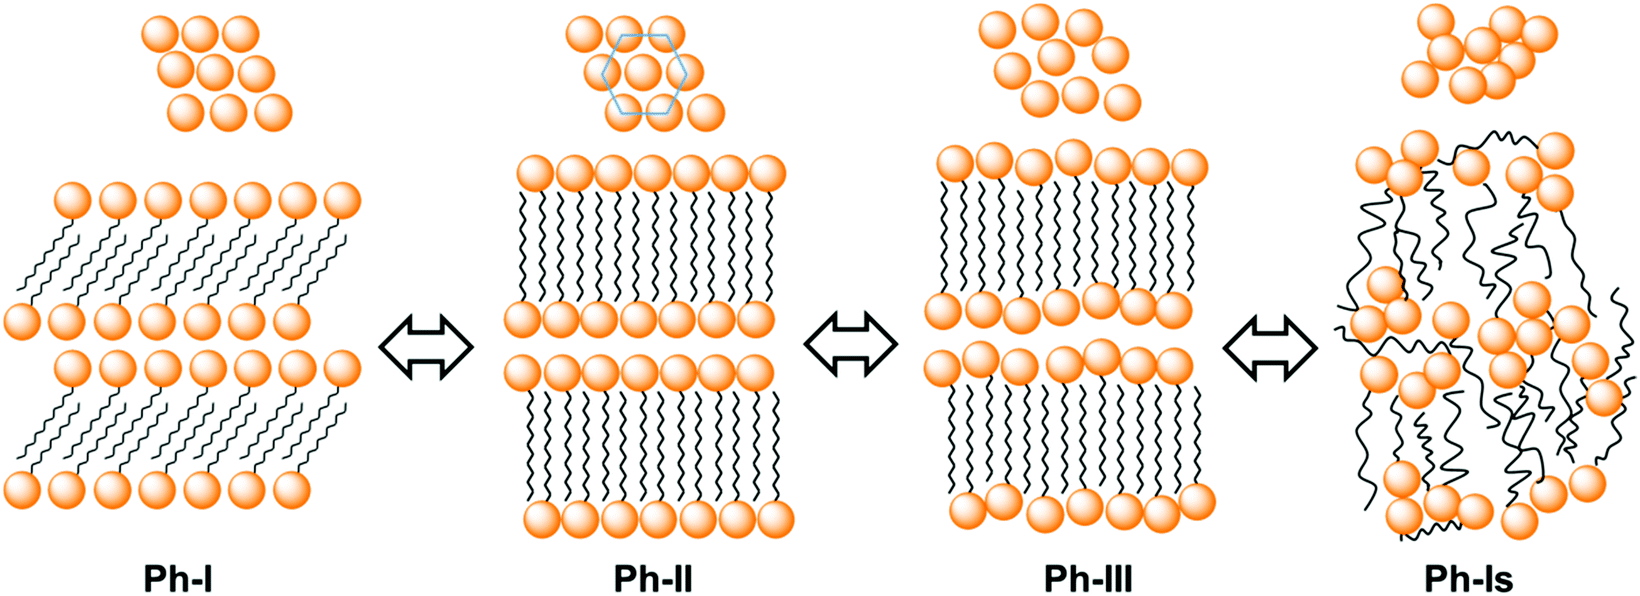 | ||
| Fig. 12 Scheme of the molecular arrangements adopted in the nATMP·Br phases. On the top the 2D array of the polar heads in the 100 planes is depicted indicating that it changes from oblique in Ph-I to pseudo-hexagonal in Ph-II to become finally disordered in Ph-III. In Ph-Is any ordered arrangement is lost. | ||
Conclusions
A series of alkyltrimethylphosphonium bromides (nATMP·Br) bearing linear alkyl chains with an even number (n) of carbon atoms from 12 to 22 have been synthesized and chemically characterized. These amphiphilic compounds have Kraftt temperatures steadily going up from below 0 up to 55 °C for increasing values of n, and they show cmc lower than those reported for their alkyltrimethylammonium bromide analogs. nATMP·Br appear to be highly thermally stable compounds with onset decomposition temperatures close to 400 °C. Their response to heating within the 0–300 °C range of temperatures involves two or three thermotropic transitions depending on n. At room temperature, all nATMP·Br crystallize in a monoclinic lattice with the Me3P·Br ionic heads arranged in layers and the long alkyl chains in a fully extended conformation, filling the interlayer spacing with a tilted orientation. This crystalline phase is converted upon heating into a Smectic-B phase that maintains a similar stratified arrangement but with the alkyl chains in the molten state. For n ≥ 16, the Smectic-B phase changes to Smectic-A when heated around 225 °C to become finally isotropic when temperatures increase above 240 °C. For n = 12 and 14, isotropization occurs at 215–220 °C without formation of the Smectic-A phase. All the thermal transitions observed for nATMP·Br are reversible but proceed at moderate rates in particular when they take place at low temperatures.Acknowledgements
This work received financial support from MCINN (Spain) with a grant MAT2012-38044-C03. Portions of this research were carried out at the BL11 line of ALBA synchrotron (Cerdanyola, Spain) with the invaluable support of Dr. Christina Kamma-Lorger. The authors are indebted to Dr. Luis Oriol (Universidad de Zaragoza) for useful comments on the structure of the liquid crystal phases. Thanks are also due to the MICINN for the PhD grant awarded to Ana Gamarra.References
- W. Xie, R. Xie, W. P. Pan, D. Hunter, B. Koene, L. S. Tan and R. Vaia, Chem. Mater., 2002, 14, 4837–4845 CrossRef CAS.
- K. J. Fraser and D. R. MacFarlane, Aust. J. Chem., 2009, 62, 309–321 CrossRef CAS.
- D. A. Gerritsma, A. Robertson, J. McNulty and A. Capretta, Tetrahedron Lett., 2004, 45, 7629–7631 CrossRef CAS.
- N. Ito, S. Arzhantsev, M. Heitz and M. Maroncelli, J. Phys. Chem. B, 2004, 108, 5771–5777 CrossRef CAS.
- J. McNulty, A. Capretta, J. Wilson, J. Dyck, G. Adjabeng and A. Robertson, Chem. Commun., 2002, 1986–1987 RSC.
- T. Ramnial, D. D. Ino and J. A. C. Clyburne, Chem. Commun., 2005, 325–327 RSC.
- G. Panek, S. Schleidt, Q. Mao, M. Wolkenhauer, H. W. Spiess and G. Jeschke, Macromolecules, 2006, 39, 2191–2200 CrossRef CAS.
- C. B. Hedley, G. Yuan and B. K. G. Theng, Appl. Clay Sci., 2007, 35, 180–188 CrossRef CAS.
- C. Byrne and T. McNally, Macromol. Rapid Commun., 2007, 28, 780–784 CrossRef CAS.
- A. Cieniecka-Rosłonkiewicz, J. Pernak, J. Kubis-Feder, A. Ramani, A. J. Robertson and K. R. Seddon, Green Chem., 2005, 7, 855–862 RSC.
- V. Kumar and S. V. Malhotra, Bioorg. Med. Chem. Lett., 2009, 19, 4643–4646 CrossRef CAS PubMed.
- K. Binnemans, Chem. Rev., 2005, 105, 4148–4204 CrossRef CAS PubMed.
- K. V. Axenov and S. Laschat, Materials, 2011, 4, 206–259 CrossRef CAS.
- S. Kamitori, Y. Sumimoto, K. Vongbupnimit, K. Noguchi and K. Okuyama, Mol. Cryst. Liq. Cryst., 1997, 300, 31–43 CrossRef CAS.
- A. Kanazawa, O. Tsutsumi, T. Ikeda and Y. Nagase, J. Am. Chem. Soc., 1997, 119, 7670–7675 CrossRef CAS.
- G. Adamová, R. L. Gardas, L. P. N. Rebelo, A. J. Robertson and K. R. Seddon, Dalton Trans., 2011, 40, 12750–12764 RSC.
- D. J. Abdallah, A. Robertson, H. Hsu and R. G. Weiss, J. Am. Chem. Soc., 2000, 122, 3053–3062 CrossRef CAS.
- D. J. Abdallah, R. E. Bachman, J. Perlstein and R. G. Weiss, J. Phys. Chem. B, 1999, 103, 9269–9278 CrossRef CAS.
- A. Kanazawa, T. Ikeda and T. Endo, Antimicrob. Agents Chemother., 1994, 38, 945–952 CrossRef CAS PubMed.
- M. Antonietti, J. Conrad and A. Thuenemann, Macromolecules, 1994, 27, 6007–6011 CrossRef CAS.
- G. Pérez-Camero, M. García-Álvarez, A. Martínez de Ilarduya, C. Fernández, L. Campos and S. Muñoz-Guerra, Biomacromolecules, 2004, 5, 144–152 CrossRef PubMed.
- A. Tolentino, A. Alla, A. Martínez de Ilarduya and S. Muñoz-Guerra, Carbohydr. Polym., 2011, 86, 484–490 CrossRef CAS.
- A. Tolentino, A. Alla, A. Martínez de Ilarduya and S. Muñoz-Guerra, Carbohydr. Polym., 2013, 92, 691–696 CrossRef CAS PubMed.
- A. Tolentino, A. Alla, A. Martínez de Ilarduya and S. Muñoz-Guerra, Int. J. Biol. Macromol., 2014, 66, 346–353 CrossRef CAS PubMed.
- A. Tolentino, A. Alla and S. Muñoz-Guerra, Eur. Polym. J., 2012, 48, 1838–1845 CrossRef CAS.
- Y. S. Lee and K. W. Woo, J. Colloid Interface Sci., 1995, 169, 34–38 CrossRef CAS.
- A. Tolentino, A. Alla, A. Martinez de Ilarduya, M. Font-Bardia, S. Leon and S. Munoz-Guerra, RSC Adv., 2014, 4, 10738–10750 RSC.
- G. M. Sheldrick, Acta Crystallogr., 2015, C71, 3–8 CrossRef PubMed.
- G. Witschard and C. E. Griffin, Spectrochim. Acta, 1963, 19, 1905–1910 CrossRef CAS.
- M. A. A. Beg and Samiuzza, Tetrahedron, 1968, 24, 191–198 CrossRef CAS.
- T. W. Davey, W. a. Ducker, A. R. Hayman and J. Simpson, Langmuir, 1998, 14, 3210–3213 CrossRef CAS.
- H. A. Patel, R. S. Somani, H. C. Bajaj and R. V. Jasra, Appl. Clay Sci., 2007, 35, 194–200 CrossRef CAS.
- K. Iwamoto, Y. Ohnuki, K. Sawada and M. Seno, Mol. Cryst. Liq. Cryst., 1981, 73, 95–103 CrossRef CAS.
- B.-M. Lundén, Acta Crystallogr., 1974, B30, 1756–1760 CrossRef.
- A. R. Campanelli and L. Scaramuzza, Acta Crystallogr., Sect. C: Cryst. Struct. Commun., 1986, C42, 1380–1383 CrossRef CAS.
- V. Ermolaev, V. Miluykov, I. Rizvanov, D. Krivolapov, E. Zvereva, S. Katsyuba, O. Sinyashin and R. Schmutzler, Dalton Trans., 2010, 39, 5564–5571 RSC.
- C. M. Wang, T. Y. Chang, C. W. Chiu, H. M. Lin and K. H. Lii, Inorg. Chem., 2014, 53, 3266–3268 CrossRef CAS PubMed.
- F. G. Riddell, M. Rogerson, W. B. Turnbull and F. Fülöp, J. Chem. Soc., Perkin Trans. 2, 1997, 95–100 RSC.
- D. J. Abdallah, R. E. Bachman, J. Perlstein and R. G. Weiss, J. Phys. Chem. B, 1999, 103, 9269–9278 CrossRef CAS.
- Accelrys Cerius2 Manual, 4.9 ed., Accelrys Inc., 2003 Search PubMed.
Footnote |
| † Electronic supplementary information (ESI) available. CCDC 1519916. For ESI and crystallographic data in CIF or other electronic format see DOI: 10.1039/c6cp08304h |
| This journal is © the Owner Societies 2017 |