 Open Access Article
Creative Commons Attribution 3.0 Unported Licence
Space charge storage in composites: thermodynamics
Chia-Chin
Chen
 and
Joachim
Maier
Max Planck Institute for Solid State Research, Heisenbergstr.1, D-70569 Stuttgart, Germany. E-mail: s.weiglein@fkf.mpg.de
First published on 15th February 2017
Abstract
Contacts of two phases, which allow for synergistic dissociative storage of a component in two space charge zones (“job-sharing storage”), are considered from the viewpoint of point defect thermodynamics. The respective relations between charge and component activity (chemical potential of the component) are derived, or – for more complex cases – the recipes for their derivation are given. These relations describe – according to different experimental conditions – the connection between mass storage and outer partial pressure or between mass storage and the cell voltage in a coulometric titration cell. They also reflect theoretical charge/discharge curves in battery cells when job-sharing storage predominates, and thus are also significant for supercapacitors. In addition to explicitly worked-out cases, it is pointed out how more general situations, such as simultaneous storage in bulk and in boundaries, specific adsorption or size effects, are to be treated.
1. Introduction
Uptake of components by homogeneous mixed ionic-electronic conductors is thermodynamically well understood. Classical examples are oxygen or hydrogen storage in oxides and silver storage in silver chalcogenides.1–11In such cases one refers to stoichiometric changes, corresponding to changes in ionic and electronic concentrations upon variation of the chemical potential of the components. Such chemical potentials can be tuned by varying the respective partial pressures (cf. PO2 variation over binary oxides) in the gas phase or by varying the activities electrochemically (cf. coulometric titration). The latter technique uses an electrochemical cell, which is equivalent to a battery cell. Thus, the single-phase storage of e.g. Li in a Li-battery electrode is an equivalent problem. Notwithstanding the enormous interest in such systems, treatments of electrode storage in terms of charge carrier thermodynamics are rather rare even for simple bulk systems.12–15
Recently, a job-sharing storage mechanism has been proposed that exploits the defect chemistry in space charge zones at interfaces.13,16,17 The effect culminates if a composite of two phases is considered none of which can store Li (i.e. both Li+ and e−) individually, but which enables storage by the fact that one phase stores Li+ (but not e−) while the other stores e− (but not Li+). Examples are Li2O:Ru or LiF:Ni.18 The Li2O:Ru composite has been shown to also dissociatively store hydrogen (presumably as H+ and H−).19 A recent application to a composite of graphite and the superionic conductor RbAg4I5 clearly demonstrates, in addition to storing Ag, the possibility of realizing Ag deficiency by forming vacancies (RbAg4I5 side) and holes (graphite side).20 Moreover, compositional changes in the latter composites turned out to be enormously fast, even if conventional dual phase transport is negligible. Mass storage in composites or in grain boundary containing systems has been referred to in ref. 21–28. Such effects also play an important role in the field of supercapacitor research where the storage phenomena are rather implicitly addressed.29–32 Here we will outline an exact and comprehensive treatment of heterogeneous storage thermodynamics in terms of charge carrier chemistry of the phases involved.
A thermodynamic description in terms of defect chemistry has been given in ref. 13 and 18 in the context of Li-based batteries for large effects and by assuming Li+ to be introduced on vacant interstitial sites (Vi) of an ionic conductor (phase α) forming a lithium interstitial  while excess electrons (e′) are accommodated in an adjacent electronic conductor (phase β). Here and in the following text, all point defects are described in Kröger–Vink notations, in which the subscript refers to the lattice site that the species occupies and the superscript refers to the effective charge (˙ stands for +1 and ′ for −1). Not only can a Li excess be introduced in such a job-sharing way, namely
 | (1) |
 and hole (h˙) formation is possible:
 | (2) |
The present contribution addresses both these cases and describes excess stoichiometry in composites quantitatively for various defect chemical situations. Most elegantly and precisely, the M-content (M = Li, Ag, etc.) in a single- or multi-phase sample can be varied electrochemically via the coulometric titration cell
| M|M+ electrolyte|sample|current collector. |
The results are not only important for transport and storage in heterogeneous systems but also for reaction kinetics and catalysis, where often the presence of heterointerfaces results in unusual kinetics.
2. Defect thermodynamics of bulk storage
Before introducing storage in composite systems, let us briefly summarize the well-understood treatment for bulk systems.2,8,9,33 As an example we use a metal halide M+X− which exhibits ionic disorder in the form of Frenkel disorder of the M-sublattice (cf.ref. 13). The ionic disorder of M+X− is characterized by | (3) |
 and leaving a vacancy
  . Unlike in eqn (1) and (2), here all particles reside in the same phase.
The fundamental electronic disorder is the band–band reaction (excitation of a regular electron to form an excess electron (e′) in the conduction band and leaving a hole (h˙) in the valence band):
| Nil ⇌ e′ + h˙. | (4) |
 | (5) |
 | (6) |
We will first assume dilute conditions such that ideal mass action laws can be assumed (Boltzmann conditions: defect activities = defect concentration) and the activities/concentrations of regular structure elements (Vi,MM) can be considered to be constant. (As far as the deeper connection between building element thermodynamics and structure element statistics is concerned, the interested reader is referred to ref. 12.) Hence, we deal with the three mass action laws, according to eqn (3)–(5)
| KF = cicv | (7-1) |
| KB = cncp | (7-2) |
 | (7-3) |
 ,
,  , e′, and h˙. Note that aM refers to the metal activity in the phase under consideration, not to the activity in the counter electrode.
This set of equations is to be complemented by the electro-neutrality equation
| ci + cp = cv + cn | (8) |
Fig. 1 shows in a double-logarithmic plot the defect concentrations as a function of M-activity. At high aM (N-regime, green in Fig. 1) ci and cn dominate (ci ≈ cn), at low aM (P-regime, blue in Fig. 1) cv and cp dominate (cv ≈ cp), and around aM* at which the exact stoichiometric composition (Dalton-composition) is realized (I-regime, yellow in Fig. 1), usually ionic disorder prevails (ci ≈ cv). (For the discussion of storage in doped materials, cf.ref. 14.)
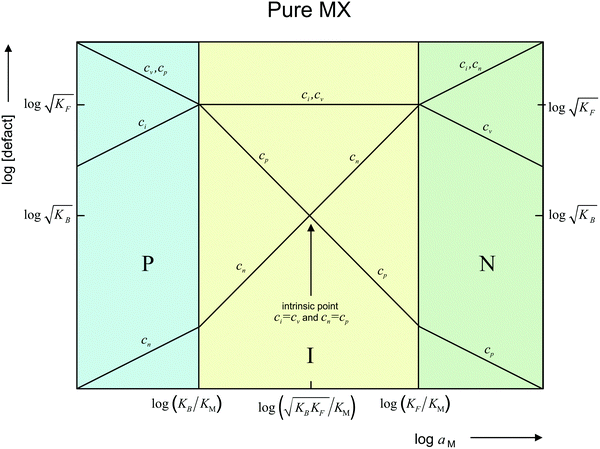 | ||
| Fig. 1 Defect chemistry of an intrinsically ionically disordered compound MX (e.g. AgCl), redrawn from ref. 13. The intrinsic point (q = 0) is characterized by ci = cv and cn = cp. In I regime (yellow), q = F(cn − cp) = F(ci − cv) ≈ 0; P regime (blue), q ≅ −Fcp ≅ −Fcv; and N regime (green), q ≅ Fcn ≅ Fci. | ||
More precisely one obtains
 | (9-1) |
 | (9-2) |
 | (9-3) |
 | (9-4) |
 | (10) |
In the N-regime (ci ≫ cv and cn ≫ cp), we have
 | (11) |
In the I-regime (ci ≅ cv), we obtain
 | (12) |
 | (13) |
 | (14) |
![[thin space (1/6-em)]](https://www.rsc.org/images/entities/char_2009.gif) ln
ln![[thin space (1/6-em)]](https://www.rsc.org/images/entities/char_2009.gif) aM and thus μM(aM = aM*) ≡ μM*) one can rewrite eqn (14) as
aM and thus μM(aM = aM*) ≡ μM*) one can rewrite eqn (14) as | (15) |
 8,34 with an inflection point at q (or δ) = 0. Fig. 2 shows experimental titration curves for silver chalcogenides.19,29 They can be well-described by eqn (15).
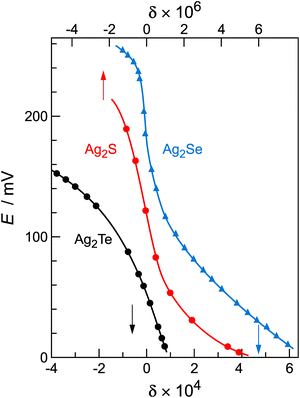 | ||
Fig. 2 Coulometric titration curves for silver chalcogenides, with data taken from ref. 21 and 35. The curves exhibit a characteristic S-shape with the inflection point at δ = 0. The positive δ-values represent silver excess  and the negative represent silver deficiency and the negative represent silver deficiency  . Note that the nonstoichiometry of Ag2S (158 °C) refers to the top x-axis and Ag2Se (105 °C) and Ag2Te (97 °C) refer to the bottom x-axis. . Note that the nonstoichiometry of Ag2S (158 °C) refers to the top x-axis and Ag2Se (105 °C) and Ag2Te (97 °C) refer to the bottom x-axis. | ||
3. Defect thermodynamics of storage at heterojunctions
3.1 Master example: weakly disordered ionic conductor/weakly disordered semiconductor contact
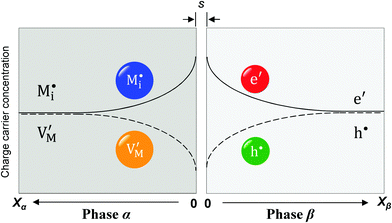
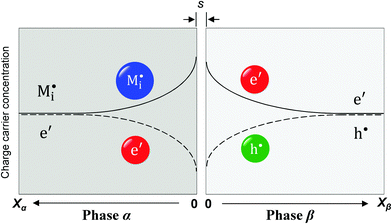
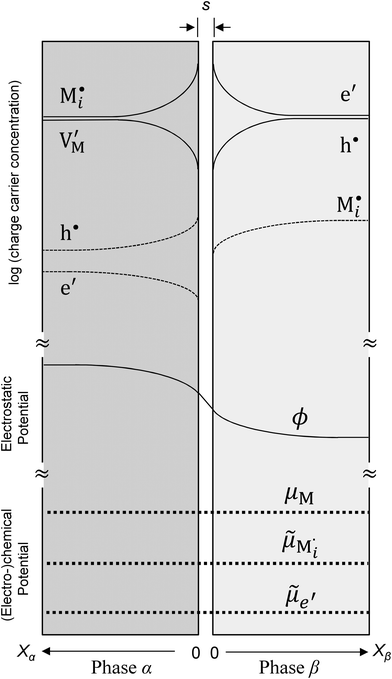
Now let us turn to space charge storage at abrupt junctions. For simplicity, we refer to a pure job-sharing situation for M = M+ + e− in which M+ is only stored in phase α and e− in phase β. As shown in Fig. 3, we assume first that α is a pure, weakly disordered ionic conductor with negligible electronic carrier concentrations and β is a pure wide band-gap semiconductor with no ionic defects. Bulk quantities are referred to by using the index ∞. We denote the total interfacially stored excess charge per area by Q. Assuming pure material and charge carrier equilibrium, the storage in the space charge zones gives rise to Gouy–Chapman layers.In doing so, we have assumed semi-infinite conditions (i.e. the thickness of the space charge layer is large compared to the screening length).
The charge stored in the space charge zone (cf. Appendix I) is given by
 | (16) |
Eqn (16) is rather general as it directly derives from the integration of the Poisson–Boltzmann equation, which assumes charge carrier equilibrium, dilute conditions, semi-infinite boundary conditions, and the absence of time-dependent magnetic fields.‡
If we refer to two carriers with the same absolute charge (z+ = −z− = z) and hence the same bulk concentration c∞, one can simplify to
 | (17) |
 , hence
 | (18) |
 delivers the space charge capacitance as being proportional to
  . These equations are well-known and have been frequently employed in electrochemistry.39
Obtaining the activity dependence of Δϕ∞ is a central problem of this paper. Realizing that in space charge zones with the space charge potential Δϕ∞, the electrochemical potential of a mobile carrier j is constant and hence dilute charge carriers redistribute according to
 | (19) |
 | (20) |
 | (21) |
 | (22) |
 | (23) |
![[small mu, Greek, tilde]](https://www.rsc.org/images/entities/i_char_e0e0.gif) j is the electrochemical potential of species j. As the space charge profiles can be parameterized by the bulk properties (x = ∞) and the properties of the outmost layer (x = 0), it is most straightforward to apply eqn (22) and (23) directly to the two outmost, adjacent positions xα = 0 and xβ = 0 of the two phases in contact, yielding
j is the electrochemical potential of species j. As the space charge profiles can be parameterized by the bulk properties (x = ∞) and the properties of the outmost layer (x = 0), it is most straightforward to apply eqn (22) and (23) directly to the two outmost, adjacent positions xα = 0 and xβ = 0 of the two phases in contact, yielding | (24) |
The respective electrical potential drop across the interface (Δϕ0 ≡ ϕα(xα = 0) − ϕβ(xβ = 0)) can be assumed to be linear. The slope is given by  , where s is the width of the charge-free zone (Fig. 3), and εα, εβ, and εαβ are the relative permittivities in phase α, phase β, and in the charge-free zone. The relations follow from global electroneutrality, i.e. the equality of the total charges stored in phases α and β (Qα and Qβ),
| Q ≡ Qα = Qβ | (25) |
 is given by
  , one obtains
 | (26) |
Let us first consider the simplest situation characterized by M-excess via interstitials and excess electrons and negligible concentration of counter defects. This situation was already treated in ref. 13. It then follows from eqn (20) and (21) by neglecting the second term in the bracket and from eqn (25), that
 | (27) |
aM ∝ Qn![[thin space (1/6-em)]](https://www.rsc.org/images/entities/char_2009.gif) exp(γQ) exp(γQ) | (28) |
 .
.
Note that the power law exponent n is characteristic of the contact problem. Since two phases are in contact, the defect-chemical variability is greater than that for usual bulk problems. Later we will inspect various combinations.
If Debye length ≫ s and Q are not so large that we still can set exp(γQ) ≈ 1 in eqn (28), a simple power law
| aM ∝ Q4 | (29) |
 and e′, we would have aM ∝ q2 (cf.eqn (11) and N-regime in Fig. 1). Eqn (29) is also very different from neutral storage (Mxi) – be it in bulk or at the interface – for which an exponent of 1 would be valid.
On the other hand, if Q is substantial and thus the exponential term in eqn (28) predominates (aM ∝ exp(γQ)), the cell voltage  is linearly related to Q. A usual capacitor law is hence fulfilled referring to the rigid part of the potential drop (cf. electrostatic capacitor), while the prevalence of the power law term reflects the diffuse part of the profile (cf. chemical capacitor). In ref. 18 extensive application of eqn (28) has been made for explaining the excess capacitances in the Ru:Li2O and LiF:Ni composites.
Now let us address the master example at a more general level, by also including the counter carriers, i.e. vacancies in α and electron holes in β (see Fig. 3). Here the charge Q is determined by  or equivalently by
  Incorporating global electro-neutrality (25) with the three mass action laws (i.e.(7-1), (7-2) and (24)), one can express Q in terms of ci(xα = 0) (cf.(20) and (21)) as
 | (30) |
Solving eqn (30) for aM and expressing ci(xα = 0) by Q, one finds
 | (31) |
 | (32) |
Furthermore, eqn (31) reveals three storage regimes:
(i) Intrinsically dominated regime: when the storage is marginal ( and
and  ) and the exponential term is unity, aM is essentially dominated by the intrinsic properties of the constituting phases (aM = constant).
(ii) Diffuse layer dominated regime: when Q prevails in comparison with the intrinsic terms in eqn (31) but is still low enough for the exponential term to be essentially unity, the power law function (aM ∝ Q4) is reproduced.
(iii) Rigid layer dominated regime: when substantial storage leads to the predominance of the exponential term, the capacitor law (aM ∝ exp(γQ)) follows.
It is worth mentioning that eqn (31) holds not only for excess but also for deficiency. In the latter case, analogous relations are obtained (with the power n of the power law in eqn (28) being negative). A more detailed discussion of the interfacial defect chemistry will be given in Section 4.1.
The intrinsic terms can dominate also for substantial charging, namely when the intrinsic disorder is very large. Then a usual capacitor law is obtained. Such characteristics are to be used for RbAg4I5/C, where n = 0.20 Yet at this point we are outside weak disorder and must refer to the upcoming section.
3.2 Contacts involving high disorder
The first complication comes from the fact that energetic and entropic activity coefficients need to be taken into account in the mass action law. We will not consider detailed expressions for the activity coefficients, as this would be specific and out of the scope of this paper. It suffices here to state that, for moderate disorder, such corrections change the aM(Q) functionality. Only if the variation of the activity coefficient with Q is comparatively small, does the aM(Q) relation derived for dilute conditions serve well. More details are given in Appendix III. In the extreme case of very high disorder, such corrections become independent of Q and the functionality is well maintained.§
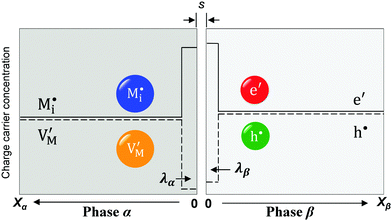
The second complication is met when the Debye length is equal to or smaller than the lattice size. In this case, the space charge layer should be described by a single layer model rather than by a Gouy–Chapman profile. Already at bulk defect concentrations of 1‰, Gouy–Chapman profiles shrink to single layers (for ε = 10, molar volume = 10 cm3 mole−1, Debye length results as 3 Å at 25 °C). Note that such situations cannot be analytically approached via Gouy–Chapman functions by nullifying the Debye-length. This is due to the incompatibility of continuous and discrete considerations under such conditions. For large storage, the relation  holds for Gouy–Chapman profiles regardless of Debye length, while the relation Q ∝ c(x = 0) follows in the single layer situations. Therefore, we need to consider both situations (extended profile and single layer) separately.
In view of this complexity, we will only investigate some characteristic subcases from the treatment of which it should become clear how to treat related problems. Whenever the bulk concentration is of relevance in the aM(Q) relation, the I-regime (cf.Fig. 1) is the simplest because here bulk concentrations are not affected by storage. That is why we mostly address the I-regime whereas N- (and P-) regimes will only be briefly considered in Section 3.3.
Before we start with these considerations, it is important to discuss the consequences of the discreteness of the charge distribution in greater detail. The continuous solution simply applies only if Debye length ≫ s. Otherwise, the variation of the profile on a width of s is substantial, which contradicts s being atomistic. Before the space charge zone degenerates to a single layer, two questions arise. The comparison of the analytical and discrete treatment shows that the price to be paid for not taking account of the discreteness is to introduce an additional rigid capacitor explicitly.40 This is not the only price to be paid. It can be anticipated that the boundary values of a Gouy Chapman profile obtained by fitting them to the experimental values of capacitance or total charge do not coincide with true values of outmost layers at the real contact. Even if the charge is smeared around a lattice plane, it will not coincide with the integrated profile in that zone. Such questions will be investigated in a forthcoming paper. Here it suffices to state that these differences are small for large Debye length and/or small space charge potentials. Most importantly, the fact that in the above considerations the charge was calculated via a Gouy–Chapman profile, but the interaction equilibrium assumed a discrete separation of the layers containing excess charge and counter charge, respectively, does not lead to severe implications as regards the validity of the functionality as represented by eqn (28).
Due to energetic interactions and configurational effects, activity coefficients have to be introduced. The former, including electron–electron repulsion or electron–electron attraction, are formally expressed by the modification of the rigid band model. The latter involve Fermi–Dirac corrections. For details concerning interaction and exhaustibility effects, the reader is referred to ref. 33 and 42.
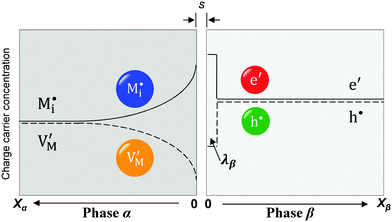
While these effects may be roughly negligible at not too high concentrations, an effect that will occur already in phase β at surprisingly low concentrations (1‰, cf. Section 3.2a) is the collapse of a Gouy–Chapman layer to a single layer. If this is the case and as long as neglecting the activity coefficients is tolerable (cf. Appendix III) one finds
 | (33) |
In eqn (33) we used the fact that in the single layer model on the electron conductor side Q ∝ λβ(cn(xβ = 0) − cp(xβ = 0)) rather than  , which would be valid for Gouy–Chapman profiles and lead to eqn (31). Eqn (33) differs from eqn (31) in terms of the power connected with the electron conductor side. If Q is large compared to the intrinsic carrier concentration we again obtain a power law for the pre-exponential term of eqn (28) but with n = 3 instead of 4. Nonetheless in such cases the exponential term might predominate. If KβB is so high that the excess charge does not substantially alter the intrinsic situation (KβB → max., whereby the maximum value is determined by the effective density of states), the second term in the numerator is independent of Q (i.e.
 is a constant when 4(λβF)2KβB ≫ Q2). Then again eqn (28) is obtained but with n = 2.
The relation characterized by n = 3 will become rather inaccurate if activity coefficients become important and in particular if they are very sensitive with respect to Q (cf. Section 3.2a and Appendix III). Then a numerical treatment is necessary. The case characterized by n = 2 is not severely influenced by such effects as far as the functionality is concerned. Here the electronic concentration will be simply constant, and so will the activity coefficients.
In other words, we find eqn (28) to be rather accurately fulfilled not only for the dilute situation but also for the extremely high concentration range, in particular, when referring to a real metal. In a metal, the excess electrons are not chemically different from the regular ones in the partially filled band being present in an exceeding number (in the simplest model μe− ≅ μe−(T = 0) ∝ concentration2/3).43
The latter case is fulfilled in superionic conductors which in certain respects form the ionic equivalent to a metal.46,47
The first case is, according to eqn (33), described by
 | (34) |
The result is
 | (35) |
3.3 More complex defect chemical situations
So far we have assumed two defect-chemically mutually inert materials, an ion conductor and an electronic conductor, both of which are pure. More complex cases do not only become very complicated, but also become specific. Therefore, in the present paper we only indicate characteristic points and, for the sake of simplicity, only refer to weakly disordered conductors.If the ion conductor is not a pure Frenkel disordered material but a pure Schottky disordered material, the variations are rather trivial. A high complexity arises if various carriers are present at similar concentrations.
Another issue arises if we allow for impure situations. For a doped Frenkel disordered material, the bulk concentration is now given by the dopant concentration rather than by  . Apart from the different temperature dependence, the solutions are analogous.
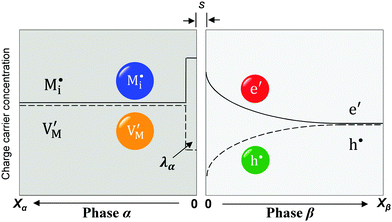
A more complex behavior is met if phase α is a mixed conductor with ionic and electronic carriers ( and e′). This type of contact shown in Fig. 7 is a usual situation in batteries because the electrodes have to conduct both ions and electrons. For phase β the treatment is the same as given in Section 3.1 while for phase α we have to consider both bulk and space charge storage. As far as the storage in bulk is concerned, one refers to the N-regime characterized by
  (cf.Fig. 1). The storage in the space charge zone is determined by
  . The solution aM(Q) is complicated because now both ci(xα = ∞) and ci(xα = 0) depend on metal activity, but it can be given analytically.48 The detailed discussion is out of the scope of the present paper.
When during storage several regimes are traversed, a deconvolution like for bulk defect chemistry would be an appropriate approach (cf. Brouwer's procedure in ref. 49). A comprehensive study has to take both bulk and interfacial defect chemistry into account.
Speaking about a mixed conductor, a major qualitative difference consists then in the fact that a coulometric titration changes both space charge (Q) and bulk composition (q). The overall added M-amount (Moverall) is given by
| MoverallF = Vαq + AαβQ | (36) |
 | (37) |
As for the activity dependence, we follow the example in Fig. 7 and neglect counter carriers. For κ0(α,β) = 1, the dependence of Q on aM is less steep than for q, and space charge storage becomes, even though it is increasing, less relevant when compared to storage in the bulk of the same phase if aM increases.18 This tendency is even stronger if κ0(α,β) > 1 or if the bulk is in the I-regime. The same statement is true symmetrically for deficiency if aM is replaced by 1/aM.
The most general contact is the contact of two mixed conductors for which we have to reckon with various bulk defect regimes, for which then space charge and bulk storage can take place and for which space charge effects are present even at the stoichiometric point.50 The latter is a consequence of carrier redistribution, which e.g. occurs in the extreme cases of p–n junctions42 (electron redistribution at the semiconductor contact) or i–v junctions51 (ion redistribution at the contact of two ion conductors). A charge at the intrinsic point does not only occur at the contact of two mixed conductors where we expect carrier injection from one side to the other side, but also if there is specific adsorption, characterized by a one-sided M+ redistribution.52
3.4 Storage involving specific adsorption
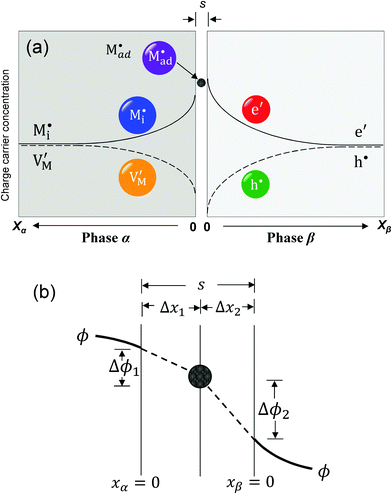
Let us treat this case in greater detail and thus allow for a non-zero charge carrier density in between xα = 0 and xβ = 0 (see Fig. 8). Specific adsorption has been widely discussed in liquid electrochemistry, and has been addressed, in the field of solid state electrochemistry, as the most important feature in the case of composite electrolytes.50,53 As for this “adsorbed” charge , a specific μ0 value is vital, the effect cannot be addressed by the above relations. Rather one has to either introduce a second heterogeneous incorporation equilibrium condition or more elegantly couple an adsorption equilibrium in the form of
 | (38) |
 | (39) |
The latter procedure has the advantage of directly showing that it is possible for the concentration of  (i.e. Qad) to be independent of metal activity. This is the case we will restrict to in the following (a more comprehensive treatment is in preparation). We assume adsorption at a site which is at a distance Δx1 from xα = 0 (Fig. 8(b)).
One notices a two-fold effect:
(1) The total stored charge is influenced by Qad, which we assume to be a positive constant. A well-known example is the interface of LiI and Al2O3.50,53 As Li ions are adsorbed on the surface of Al2O3, lithium ion vacancies have to be formed in the space charge layers because of global electro-neutrality. Different from the previous cases without adsorption, there is now a non-zero (negative) space charge at the stoichiometric point (Q = 0) (i.e. QSC = Q − Qad = −Qad). This LiI:Al2O3 composite is a good example but does not offer the possibility of storing excess Li. Considering the extremely low electronic concentration in LiI, stoichiometric variations are negligible. Such a storage – even though also very small – has been demonstrated for AgCl:Al2O3 and led to Kröger–Vink diagrams of space charge zones.54 A related example considering specific adsorption at the metal/ionic conductor has been shown in ref. 40.
Returning to our master example of the contact of a weakly disordered semiconductor and a weakly disordered ion conductor, in the case of constant specific adsorption, the charge conservation is thus slightly different from eqn (30) and requires taking Qad into account:
 | (40) |
 in the zone Δx1 and slope
  in the zone Δx2. The slope change is determined by Qad according to Gauss's law.
Hence,
 | (41) |
 | (42) |
 , the first term in the numerator of eqn (42) becomes a constant and thus an n-value of 2 will be obtained. For large storage (Q ≫ Qad), we come back to the adsorption-free case characterized by an n-value of 4. Eqn (42) will be exploited in Section 4.2 to highlight interfacial storage involving adsorption.
3.5 Storage of compounds
The power of the concept of job-sharing storage shows the possibility of storing not only a component (M+/e−) but also compounds. In ref. 19, it was shown that the contact of Li2O/Ru has the ability to store H2, presumably in the form of H+(Li2O)/H−(Ru). In ref. 55 it was briefly discussed that a composite consisting of Li2O and CaF2 should be able to store LiF as Li+(Li2O)/F−(CaF2).Independent of any practical relevance and deeper insight, the sheer possibility of such phenomena demonstrates the generality of the job-sharing concept beyond the supercapacitive approach. Analogous effects might be important for catalysts where such splitting effects are possible at interfaces such as the catalyst/gas phase or the catalyst/support. While such dissociation phenomena (cf. spill-over reaction) are part of the discussion in the catalyst community, a pertinent description in terms of defect chemistry still seems to be lacking.
4. Discussion of the stoichiometric variation
4.1 Defect chemistry and interfacial storage without adsorption
After having discussed the solutions for space charge storage at different heterojunctions, this section highlights aspects of general significance as regards stoichiometric variations in the space charge zones. This can be done approximately independent of the contact situation as the aM − Q relations look functionally rather similar in that always a relationship of the form aM ∝ Qn![[thin space (1/6-em)]](https://www.rsc.org/images/entities/char_2009.gif) exp(γQ) – in the following termed as the standard form – is valid as long as interaction and exhaustibility effects are either small (low disorder) or invariant (very high disorder). Table 1 summarizes various situations.
exp(γQ) – in the following termed as the standard form – is valid as long as interaction and exhaustibility effects are either small (low disorder) or invariant (very high disorder). Table 1 summarizes various situations.
This statement is also true if we apply fully discrete calculations instead of a continuous approach. (Note that in order to avoid confusion we used the term “single layer model” if we refer to the situation where all the charges are concentrated there and a “fully discrete model” when the whole profile is discretized.)
In order to connect with the standard form we calculate parameter n′, which is defined as n′ = d(ln![[thin space (1/6-em)]](https://www.rsc.org/images/entities/char_2009.gif) aM − γQ)/d
aM − γQ)/d![[thin space (1/6-em)]](https://www.rsc.org/images/entities/char_2009.gif) ln
ln![[thin space (1/6-em)]](https://www.rsc.org/images/entities/char_2009.gif) Q.¶ The comparison with the standard form shows that n′ = n + ln
Q.¶ The comparison with the standard form shows that n′ = n + ln![[thin space (1/6-em)]](https://www.rsc.org/images/entities/char_2009.gif) Qdn/d
Qdn/d![[thin space (1/6-em)]](https://www.rsc.org/images/entities/char_2009.gif) ln
ln![[thin space (1/6-em)]](https://www.rsc.org/images/entities/char_2009.gif) Q + d
Q + d![[thin space (1/6-em)]](https://www.rsc.org/images/entities/char_2009.gif) ln
ln![[thin space (1/6-em)]](https://www.rsc.org/images/entities/char_2009.gif) A/d
A/d![[thin space (1/6-em)]](https://www.rsc.org/images/entities/char_2009.gif) ln
ln![[thin space (1/6-em)]](https://www.rsc.org/images/entities/char_2009.gif) Q, where A denotes the prefactor to Qn
Q, where A denotes the prefactor to Qn![[thin space (1/6-em)]](https://www.rsc.org/images/entities/char_2009.gif) exp
exp![[thin space (1/6-em)]](https://www.rsc.org/images/entities/char_2009.gif) γQ. If a power law pre-exponential is valid, i.e. the standard form is realized with a constant n-value, the last two terms disappear and n′ becomes identical to n and hence constant with Q. In other words, the validity of the standard form requires a flat n′ vs. ln
γQ. If a power law pre-exponential is valid, i.e. the standard form is realized with a constant n-value, the last two terms disappear and n′ becomes identical to n and hence constant with Q. In other words, the validity of the standard form requires a flat n′ vs. ln![[thin space (1/6-em)]](https://www.rsc.org/images/entities/char_2009.gif) Q relation (but note that this is a necessary but not a sufficient condition, i.e. there may be flat regions where n′ = constant ≠ n).
Q relation (but note that this is a necessary but not a sufficient condition, i.e. there may be flat regions where n′ = constant ≠ n).
The discrete calculations show that the Gouy–Chapman approach loses its validity for very high storage, even when referring to small bulk concentrations. Fig. 9 depicts the transition from a Gouy–Chapman type of situation to a single layer situation, as reflected by reduction of the above defined n′-value. In the example studied in Fig. 9, the region characterized by n′ = 2 (single layer) corresponds to a situation where 90% of the total charge is concentrated in the first layer. This value may be used to formally cut off the continuous model if very high storage is met. Note that the relation of the outmost layer concentration and aM stays invariant. The detailed discussion is out of the scope of this presentation.
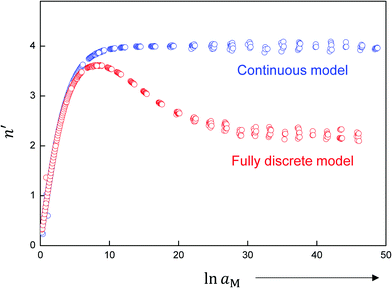 | ||
| Fig. 9 Comparison of continuous and fully discrete models for a weakly disordered ionic conductor/weakly disordered semiconductor junction (cf.Fig. 3). The continuous model is based on eqn (31), and the discrete model follows the procedure used in ref. 40. For the continuous model, as we will describe later in detail, the n′ value monotonically increases from 0 and saturates at 4. The discrete model behaves the same at small storage, but the n′ value drops at some point and saturates at 2. The discrepancy obviously occurs because at large storage the major fraction of charges is accommodated in the first lattice layer. The detailed calculation for this example shows that for the red curve about 90% of the total charge is concentrated in the first layer where n′ = 2 and about 10% where n′ = 4. Note that the Debye lengths for both phases, since they only depend on the bulk concentrations, do not change with Q or aM. Input parameters: KαF = KβB = KαβM = 10−2 mol2 m−6, εα = εβ = εαβ = 5, s = 3 Å, lattice parameter = 3 Å, T = 300 K. | ||
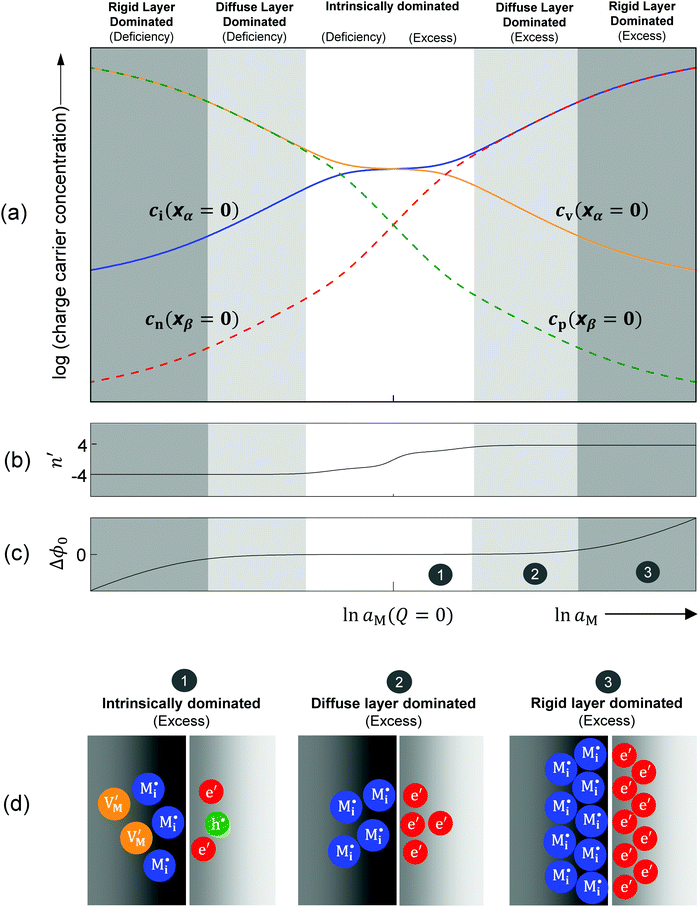
Let us analyze the defect chemistry for our master example, i.e. weakly disordered ion conductor/weakly disordered semiconductor junction in the absence of specific adsorption (cf.Fig. 3). In addition, we ignore the collapse of the Gouy–Chapman layer to a single layer and assume strict validity of eqn (28). In the same way as bulk concentrations, the interfacial concentrations are, at a given temperature and impurity content, only a function of the component activity once the contact has been established. As in Section 3.1 we concentrate on pure systems, equilibrium and dilute conditions. The position dependence is determined by the Gouy–Chapman profiles and then parameterized by bulk and outmost boundary concentrations. Hence, the discussion of the latter suffices. For the master example, Fig. 10a plots the outmost layer concentration for different charge carriers as a function of component activity. At first glance one notices surprising similarity to the classic Brouwer diagrams of bulk defect chemistry (cf.Fig. 1). The reason is as follows: if differences in the dielectric constant are small and the rigid potential drop is negligible, the coupling of the two counter carriers in the outmost layers is similar to the coupling of the two majority carriers in the bulk problem. In the bulk the coupling is given by local electroneutrality (cf. Section 2). At the boundary it is the global electroneutrality which links  these boundary values as e.g. ci(xα = 0) = cn(xβ = 0) with the consequence that power laws are obtained. For our example, we derive that ci(xα = 0) and cn(xβ = 0) are proportional to
  , which is identical to the bulk form in the N-regime for ci∞ = cn∞. As interface and bulk problems may refer to different majority carriers and since at interfaces two phases are involved, the exponents might substantially differ between bulk and boundary. This was already so in the above case when we considered the stored charge (cf.Fig. 10) instead of concentration: Q ∝ aM1/4 but q ∝ aM1/2.
Let us discuss the different regimes in Fig. 10a. Near the stoichiometric point the concentration of added charge is marginal compared to the intrinsic concentration, so the defect chemistry at the interface is mainly determined by the intrinsic properties of the constituting phases, as illustrated in Fig. 10d-1. Unlike the other two regimes we will refer to in the following, all four charge carriers have to been taken into account. On deviating from the intrinsic situation, the n′ parameter in Fig. 10b changes monotonically from 0 (at Q = 0) to ±4, where the positive sign refers to M excess and the negative one to M deficiency. This symmetrical behavior is reflected by the symmetric functionality of eqn (31).
In the power law regimes, the counter defects have become negligible and the storage characteristics are determined by the majority carrier in the diffuse layer (Fig. 10d-2). Fig. 10a shows that in this regime ci(xα = 0) ≈ cn(xβ = 0) for excess and cv(xα = 0) ≈ cp(xβ = 0) for deficiency. The n′ parameter remains at ±4 as Q dominates the constant term in the brackets of eqn (31) but the exponential term is still negligible.
The storage enters the rigid-layer dominated regime when a significant amount of charge has accumulated in the space charge layer. Notwithstanding that ci(xα = 0) = cn(xβ = 0) is still valid, the electrostatic potential drop Δϕ0 substantially rises in this regime (see Fig. 10a and c). This characteristic electrostatic-capacitor feature is most different from bulk defect chemistry and has been widely discussed in supercapacitors.
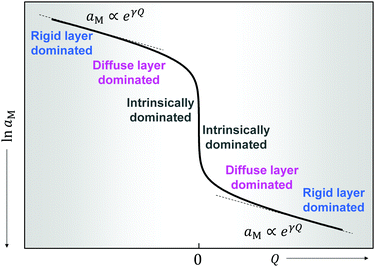
Fig. 11 plots the aM(Q) function in the form ln![[thin space (1/6-em)]](https://www.rsc.org/images/entities/char_2009.gif) aMvs. Q, which – as the y-axis reflects the cell voltage of the titration cell – is equivalent to a titration curve for the job-sharing mechanism. Also here the various regimes are obvious. At high storage (large |±Q|) the just discussed rigid-layer dominated regime is in the form of a linear feature, i.e. a typical capacitor law with a slope
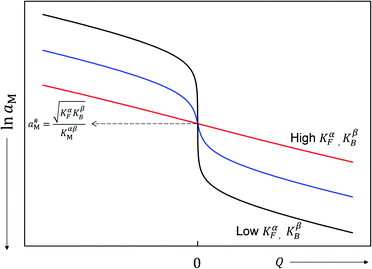
aMvs. Q, which – as the y-axis reflects the cell voltage of the titration cell – is equivalent to a titration curve for the job-sharing mechanism. Also here the various regimes are obvious. At high storage (large |±Q|) the just discussed rigid-layer dominated regime is in the form of a linear feature, i.e. a typical capacitor law with a slope  . In between these extreme regions, Fig. 11 displays the transition to the intrinsic situation via traversing the diffuse layer dominated regimes (characterized by power laws). Fig. 12 indicates how sensitively these regime zones depend on the ionic and electronic disorders, i.e. on KαF and/or KβB. In fact the slope at Q = 0 is directly determined by these mass action parameters (see Appendix IV).
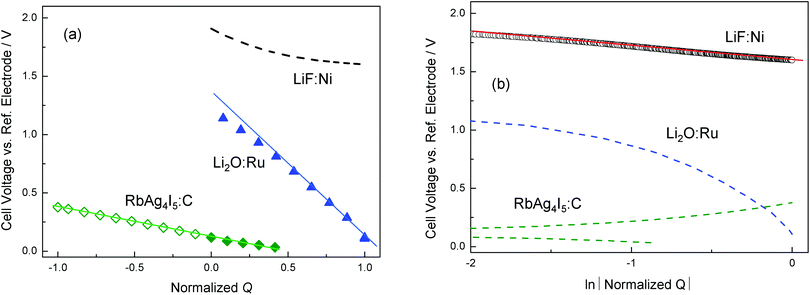
Fig. 13 shows experimental results for LiF/Ni, Li2O/Ru, and RbAg4I5/C, as given in ref. 18 and 20. Note that the cell voltage (y-axis) reflects ln![[thin space (1/6-em)]](https://www.rsc.org/images/entities/char_2009.gif) aM. In the representation ln
aM. In the representation ln![[thin space (1/6-em)]](https://www.rsc.org/images/entities/char_2009.gif) aMvs. Q linearity suggests an exponential dependence, while for ln
aMvs. Q linearity suggests an exponential dependence, while for ln![[thin space (1/6-em)]](https://www.rsc.org/images/entities/char_2009.gif) aMvs. ln
aMvs. ln![[thin space (1/6-em)]](https://www.rsc.org/images/entities/char_2009.gif) Q linearity means a power law. For LiF/Ni a power law has been found, corresponding to the characterization given in ref. 18. In the case of Li2O/Ru, a power law is found to be only marginally fulfilled (namely only for small storage) while owing to large storage the rigid-layer term is not negligible. Here the full eqn (28) provided a good fit.18 Exponential behavior completely dominates the case of RbAg4I5/C, where the situation is essentially determined by the intrinsic defect chemistry.20 Note that the above contacts Li2O/Ru and LiF/Ni are not only relevant as far as interfacial storage in conversion reactions is concerned in which they form the end products,56,57 but they can also be viewed as representatives of the contacts of passivation layers (solid electrolyte interface (SEI) between the electrolyte and the current collector58,59) in lithium batteries with current collecting phases (typically carbon).
Q linearity means a power law. For LiF/Ni a power law has been found, corresponding to the characterization given in ref. 18. In the case of Li2O/Ru, a power law is found to be only marginally fulfilled (namely only for small storage) while owing to large storage the rigid-layer term is not negligible. Here the full eqn (28) provided a good fit.18 Exponential behavior completely dominates the case of RbAg4I5/C, where the situation is essentially determined by the intrinsic defect chemistry.20 Note that the above contacts Li2O/Ru and LiF/Ni are not only relevant as far as interfacial storage in conversion reactions is concerned in which they form the end products,56,57 but they can also be viewed as representatives of the contacts of passivation layers (solid electrolyte interface (SEI) between the electrolyte and the current collector58,59) in lithium batteries with current collecting phases (typically carbon).
4.2 Defect chemistry and interfacial storage with strong adsorption
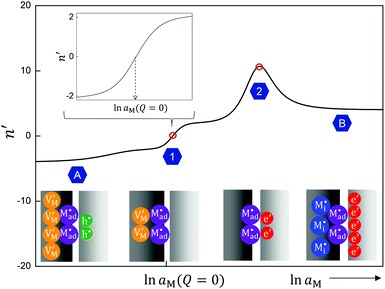
If we assume the adsorbed charge (Qad) to be large ( ) and express the numerical solution in the entire range in terms of the above-defined n′ parameter, the plot given in Fig. 14 is obtained. In the case of adsorption, the point of zero charge on the semiconductor side (point 1) is different from the point (point 2) at which the charge in the space charge zone on the ionic conductor side disappears. Point 1 corresponds to an inflection point separating power law regimes with n′ = ±2 from each other (see inset of Fig. 14). (In the adsorption-free case, n′ = ±4.) As here the charge in the semiconductor is zero and the space charge in the ionic conductor is compensated by a constant and large adsorbed charge, the result resembles the result obtained for an adsorption-free situation in which the charge in the ionic conductor is compensated by a rather concentrated charge in the electronic conductor.
At point 2, n′ strives towards large values which simply means that Q becomes rather independent of aM, since it is compensated by the constant adsorbed charge. It is worth mentioning that it is the space charge on the ionic conductor side that becomes aM-independent at point 1.
4.3 Size variation
At this point, it is conceptually highly revealing to go to the subnano-limit by letting the grain sizes of the composite approach the atomistic limit (see Fig. 15b).55 Owing to the increased homogeneity (see Fig. 15c), the exponential term in eqn (28) eventually becomes unity. Simultaneously, as a consequence of the flat profiles, Q ∝ c(x = 0) rather than is obtained and the exponent n of the power law in eqn (28) changes to 2. As expected this is the same relation that one obtains for a chemical capacitor for a homogeneous intercalation process (see eqn (7-3)). (Note that the distribution in Fig. 15c has to be dilute and at random for these considerations to apply.) Not only is this thought experimentally insightful, it is of major relevance for possible future mesoscopic electrode composites. At a very general level, the sequence given in Fig. 15 is a conceptual example of a transition from a semi-infinite to a finite, and, from a finite to a mesoscopic and eventually artificially homogeneous situation.60
 | ||
| Fig. 15 Schematic of (a) a composite of macroscopic job-sharing phases, (b) the mesoscopic situation, and (c) an artificial, homogeneous mixed conductor. For simplicity an ordered arrangement is shown; in particular in Fig. 15c the carrier distribution is to be randomized. | ||
5. Conclusions and outlook
Using simple defect-chemical and electrostatic arguments, this paper presents a rather systematic treatment of the thermodynamics of job-sharing storage at interfaces of ionic and electronic contacts. We are convinced that these considerations are of no less significance than classic bulk considerations at least if it comes to nano-sized systems. Even if one concentrates on single boundaries, the carrier concentrations at boundaries are of great importance, e.g. for a relevant discussion of transfer resistances. The treatment is also expected to form the basis of supercapacitors based on solid phases. Irrespective of the practical significance for the fields of energy and chemical reactions, the thermodynamic considerations may be used to differentiate between various mechanistic situations. They also show the major adjusting screws for controlling such interfacial storage phenomena.The treatment is hoped to pave the way for important generalizations:
(i) Combination of bulk and space charge storage is important if mixed conductors are considered rather than ionic and electronic conductors.
(ii) Generally, defect redistribution and doping can also occur if stoichiometric phases are contacted. Here the effects of storage are particularly delicate.
(iii) Size variations do not only show elegantly the connection between electrostatic and chemical capacitance, they should be of specific significance for future artificial electrodes.
(iv) Discretization offers insight into the precision of the core-space charge picture and more generally into the validity of continuous approaches and of the implantation of capacitive elements.
All the points will be subject of future more detailed considerations.
Appendix I
In the space charge region, the electrostatic potential (ϕ) and the local charge density (ρ) are correlated by Poisson's equation: | (A1) |
 | (A2) |
 | (A3) |
 ,
,  can be rewritten as
  and eqn (A3) as
 | (A4) |
 | (A5) |
 , one obtains
 | (A6) |
Appendix II
The figure above is the equilibrium picture at the job-sharing contact of a weakly disordered ion conductor and a weakly disordered electronic conductor. The constancy of the potentials given at the bottom throughout the phases assumes that there are, at a low level, electronic carriers in phase α and M interstitials in phase β. (Note that ∇μM = 0 follows from
 ).
).
The electrochemical equilibrium of the M incorporation reaction is given by
 | (A7) |
 and e′ to the outmost positions, i.e.
 and
and  . For dilute considerations, eqn (A7) can be rewritten as
 | (A8) |
Rearranging eqn (A8) yields eqn (24) in the main text:
 .
.
Appendix III
A typical concentration above which we obtain a single layer model is 0.1 M. Table 2 provides data for ionic activity coefficients in aqueous solutions. The increase from 0.1 M to 0.2 M corresponds to a relative concentration increase of 100% whereupon the activity coefficient only changes by about 10%. Under such circumstances the dilute relation aM(Q) can roughly be used with a different proportionality constant. Unfortunately data on activity coefficients in concentrated situations for ionic solids are very scarce. If the cube root model is taken that is proved worthwhile for silver halides,61,62 PbI2,63 and SrTiO3,64 not only the activity coefficients but also their variations appear to be severe. A similar conclusion can be drawn from ref. 65 reporting activity coefficients for Debye–Hückel interactions. This suggests that the range of validity of the dilute aM(Q) relation for a highly disordered situation is very small. (Note the enormous difference in the dielectric constants for water (∼80) and for ionic solids, e.g. NaCl (∼6).) On the other hand, the above models are not expected to be valid for high concentrations. Various other effects such as a higher degree of two-dimensionality of defect interaction in the single layer case, additional repulsion effects as well as site exhaustion effects will counteract the long-range defect–defect interaction and the activity coefficients might change less steeply. At the present stage of research not much more can be safely stated.| Total salt concentration | With KNO3 | With KCl | With HCl | With TlNO3 |
|---|---|---|---|---|
| The unit of concentration is the mole number of (TlCl + salt) in 1000 g H2O. | ||||
| 0.1 | 0.742 | 0.715 | 0.718 | 0.686 |
| 0.2 | 0.676 | 0.613 | 0.630 | 0.546 |
Appendix IV
Eqn (31) in the main text, i.e.can be simplified to
 | (A9) |
 | (A10) |
References
- F. A. Kröger, The Chemistry of Imperfect Crystals, North-Holland Pub. Co., 1974 Search PubMed.
- C. Wagner, Prog. Solid State Chem., 1971, 6, 1–15 CrossRef CAS.
- H. Kanai, J. Mizusaki, H. Tagawa, S. Hoshiyama, K. Hirano, K. Fujita, M. Tezuka and T. Hashimoto, J. Solid State Chem., 1997, 131, 150–159 CrossRef CAS.
- E. Bakken, T. Norby and S. Stølen, Solid State Ionics, 2005, 176, 217–223 CrossRef CAS.
- D. N. Mueller, R. A. De Souza, H.-I. Yoo and M. Martin, Chem. Mater., 2012, 24, 269–274 CrossRef CAS.
- T. Norby, M. Wideroe, R. Glockner and Y. Larring, Dalton Trans., 2004, 3012–3018 RSC.
- O. Glemser and C. Naumann, Z. Anorg. Allg. Chem., 1951, 265, 288–302 CrossRef CAS.
- N. Valverde, Z. Phys. Chem., 1971, 75, 1–6 CrossRef CAS.
- U. V. Oehsen and H. Schmalzried, Ber. Bunsen-Ges., 1981, 85, 7–14 CrossRef.
- R. Andreaus and W. Sitte, J. Electrochem. Soc., 1997, 144, 1040–1044 CrossRef CAS.
- G. Beck and J. Janek, Solid State Ionics, 2004, 170, 129–133 CrossRef CAS.
- J. Maier, Z. Phys. Chem., 2012, 226, 863–870 CrossRef CAS.
- J. Maier, Angew. Chem., Int. Ed., 2013, 52, 4998–5026 CrossRef CAS PubMed.
- J. Maier and R. Amin, J. Electrochem. Soc., 2008, 155, A339–A344 CrossRef CAS.
- J.-Y. Shin, D. Samuelis and J. Maier, Solid State Ionics, 2012, 225, 590–593 CrossRef CAS.
- J. Jamnik and J. Maier, Phys. Chem. Chem. Phys., 2003, 5, 5215–5220 RSC.
- J. Maier, Solid State Ionics, 1989, 32–33(part 2), 727–733 CrossRef.
- L. Fu, C.-C. Chen, D. Samuelis and J. Maier, Phys. Rev. Lett., 2014, 112, 208301 CrossRef.
- L. Fu, K. Tang, H. Oh, K. Manickam, T. Bräuniger, C. V. Chandran, A. Menzel, M. Hirscher, D. Samuelis and J. Maier, Nano Lett., 2015, 15, 4170–4175 CrossRef CAS PubMed.
- C.-C. Chen, L. Fu and J. Maier, Nature, 2016, 536, 159–164 CrossRef CAS PubMed.
- W. T. Petuskey, Solid State Ionics, 1986, 21, 117–129 CrossRef CAS.
- V. Stubican, C. Lin and E. Macey, Nonstoichiometric Compounds, Advances in Ceramics, American Ceramic Society, Inc., 1987, vol. 23, pp. 97–105 Search PubMed.
- J. Maier, in Modern Aspects of Electrochemistry, ed. B. E. Conway, C. G. Vayenas, R. White and M. Gamboa-Adelco, Springer US, 2005, ch. 1, vol. 38, pp. 1–173 Search PubMed.
- S. Kim and J. Maier, J. Electrochem. Soc., 2002, 149, J73–J83 CrossRef CAS.
- P. Lupetin, G. Gregori and J. Maier, Angew. Chem., Int. Ed., 2010, 49, 10123–10126 CrossRef CAS PubMed.
- S. Kim, R. Merkle and J. Maier, Surf. Sci., 2004, 549, 196–202 CrossRef CAS.
- Y. M. Chiang, E. B. Lavik, I. Kosacki, H. L. Tuller and J. Y. Ying, Appl. Phys. Lett., 1996, 69, 185–187 CrossRef CAS.
- A. Tschöpe, Solid State Ionics, 2001, 139, 267–280 CrossRef.
- B. E. Conway, Electrochemical Supercapacitors: Scientific Fundamentals and Technological Applications, Plenum Publishers, New York, 1999 Search PubMed.
- P. Simon, Y. Gogotsi and B. Dunn, Science, 2014, 343, 1210–1211 CrossRef CAS PubMed.
- N.-S. Choi, Z. Chen, S. A. Freunberger, X. Ji, Y.-K. Sun, K. Amine, G. Yushin, L. F. Nazar, J. Cho and P. G. Bruce, Angew. Chem., Int. Ed., 2012, 51, 9994–10024 CrossRef CAS PubMed.
- R. Kötz and M. Carlen, Electrochim. Acta, 2000, 45, 2483–2498 CrossRef.
- J. Maier, Physical Chemistry of Ionic Materials: Ions and Electrons in Solids, John Wiley & Sons, 2004 Search PubMed.
- C. Wagner, J. Chem. Phys., 1953, 21, 1819–1827 CrossRef CAS.
- T. Takahashi and O. Yamamoto, J. Electrochem. Soc., 1971, 118, 1051–1057 CrossRef CAS.
- B. E. Conway, in Advanced Treatise of Physical Chemistry, ed. H. Eyring, Academic Press Inc., New York, 1970, vol. IXA, pp. 1–157 Search PubMed.
- L. Onsager, Chem. Rev., 1933, 13, 73–89 CrossRef CAS.
- J. Th. G. Overbeek, in Colloid Science, ed. H. R. Kruyt, Elsevier, Amsterdam, 1952, vol. 1, p. 129 Search PubMed.
- C. Barlow Jr., in Physical Chemistry, An Advanced Treatise, ed. H. Eyring, Academic Press Inc., New York, 1970, vol. IXA, pp. 167–246 Search PubMed.
- R. D. Armstrong and B. R. Horrocks, Solid State Ionics, 1997, 94, 181–187 CrossRef CAS.
- K. Sasaki and J. Maier, Solid State Ionics, 2000, 134, 303–321 CrossRef CAS.
- S. M. Sze and K. K. Ng, Physics of Semiconductor Devices, John Wiley & Sons, 2006 Search PubMed.
- C. Kittel, Introduction to Solid State Physics, Wiley, 1971 Search PubMed.
- S. Kim and J. Maier, Electrochem. Solid-State Lett., 2003, 6, J7–J9 CrossRef CAS.
- J. Maier, Z. Phys. Chem., 2005, 219, 35–46 CrossRef CAS.
- J. Maier and W. Münch, Z. Anorg. Allg. Chem., 2000, 626, 264–269 CrossRef CAS.
- J. Maier, Solid State Ionics, 2003, 157, 327–334 CrossRef CAS.
- C.-C. Chen and J. Maier, in preparation.
- G. Brouwer, Philips Res. Rep., 1954, 9, 366–376 CAS.
- J. Maier, Prog. Solid State Chem., 1995, 23, 171–263 CrossRef CAS.
- N. Sata, K. Eberman, K. Eberl and J. Maier, Nature, 2000, 408, 946–949 CrossRef CAS PubMed.
- J. Maier, Ber. Bunsen-Ges., 1985, 89, 355–362 CrossRef CAS.
- C. C. Liang, J. Electrochem. Soc., 1973, 120, 1289–1292 CrossRef CAS.
- J. Maier, J. Phys. Chem. Solids, 1985, 46, 309–320 CrossRef CAS.
- J. Maier, Faraday Discuss., 2007, 134, 51–66 RSC.
- P. Balaya, H. Li, L. Kienle and J. Maier, Adv. Funct. Mater., 2003, 13, 621–625 CrossRef CAS.
- H. Li, P. Balaya and J. Maier, J. Electrochem. Soc., 2004, 151, A1878–A1885 CrossRef CAS.
- E. Peled, J. Electrochem. Soc., 1979, 126, 2047–2051 CrossRef CAS.
- P. Verma, P. Maire and P. Novák, Electrochim. Acta, 2010, 55, 6332–6341 CrossRef CAS.
- J. Maier, Chem. Mater., 2013, 26, 348–360 CrossRef.
- R. Merkle and J. Maier, Z. Anorg. Allg. Chem., 2005, 631, 1163–1166 CrossRef CAS.
- F. Zimmer, P. Ballone, J. Maier and M. Parrinello, J. Chem. Phys., 2000, 112, 6416–6423 CrossRef CAS.
- N. Hainovsky and J. Maier, Phys. Rev. B: Condens. Matter Mater. Phys., 1995, 51, 15789 CrossRef CAS.
- R. Merkle and J. Maier, Phys. Chem. Chem. Phys., 2003, 5, 2297–2303 RSC.
- A. Allnatt and P. Hoines, J. Chem. Phys., 1967, 46, 1154–1155 CrossRef CAS.
- G. Kortum, Treatise on Electrochemistry, Elsevier, Amsterdam, 1965 Search PubMed.
Footnotes |
| † The situation is different in doped materials or materials with a large fraction of frozen native defects as (ci − cv) − (cn − cp) is not zero but equal to a constant. In these cases, the definition of M-excess is not unambiguous.13 But the particularly relevant questions concerning variations or total stoichiometric change (cf. battery capacity) are unaffected, since dq+ = dq− = dq when defined as above. |
| ‡ Another imprecision of the Poisson–Boltzmann equation stems from strictly equating ϕ's in the electrochemical potential and in the Poisson equation.36–38 |
| § For a highly disordered conductor, the activity coefficient deviates distinctly from unity but becomes rather insensitive with respect to stoichiometric variations (that are now negligible compared to the intrinsic level). This is analogous to yttria-stabilized zirconia bulk with a high doping level of 8%, in which the oxygen partial pressure dependence of the electronic concentrations still follows the predictions derived from the dilute situation. In this example, the activity coefficient for oxygen vacancies is very different from unity but constant with regard to oxygen partial pressure.41 |
¶ In the case of constant adsorption, the definition of n′ has to be extended by replacing γQ with  . (cf.Fig. 14). . (cf.Fig. 14). |
| This journal is © the Owner Societies 2017 |

