Non-collinear ferromagnetic short range order in MgO decked multi-layered graphene
Kummari V.
Sreenivasulu
a,
Naresh K.
Rotte
a,
Vadali V. S. S.
Srikanth
*a and
Sharika Nandan
Kaul
*b
aSchool of Engineering Sciences and Technology, University of Hyderabad, Hyderabad 500046, India. E-mail: vvsssse@uohyd.ernet.in; Tel: +91-40-23134453
bSchool of Physics, University of Hyderabad, Hyderabad 500046, India. E-mail: sn.kaul@uohyd.ac.in; Tel: +91-40-23134322
First published on 28th November 2016
Abstract
A careful magnetic study of MgO decked multi-layered graphene (MDMLG), synthesized by a combustion process that does not involve the use of graphite (which can be a source of magnetic impurities) was conducted and an elaborate analysis of high-precision magnetization data permits us to completely rule out the presence of a long-range ferromagnetic (FM) ordering at temperatures T ≥ 2.5 K. Instead, a non-collinear FM short-range order persists up to temperatures as high as 300 K and a concomitant paramagnetic component is present at all the temperatures. The observed exponential temperature variations of the ‘field-cooled’ and ‘zero-field-cooled’ magnetizations, remanent magnetization, saturation magnetization, coercive field, exchange field and random anisotropy field are shown to basically reflect the exponential growth of the correlation length for the spins at the zigzag edges of graphene as the temperature falls below the temperature, Tx ≅ 10 K where a crossover from extremely weak to moderately weak magnetic anisotropy occurs. In sharp contrast, a paramagnetic response is induced by the defects in nanometer-sized MgO crystallites in MDMLG.
Introduction
The unconventional magnetic behaviour of carbon allotropes namely C60,1 amorphous carbon nanofibers,2 carbon nanofoam,3 protonated graphite4 and graphene5 has been attributed to the presence of either defects or ad-atoms6–9 in them. It has also been observed that multi-layered graphene (MLG) exhibits ferromagnetic as well as antiferromagnetic behaviour.10 The magnetic behaviour of graphene-related materials is not clearly understood and the subject is still a matter of debate.11 In the present work, the intrinsic magnetic behaviour of MgO-decked multi-layered graphene (MDMLG) is reported. MDMLG has been prepared by using a rudimentary combustion synthesis process12 that does not involve the use of graphite, which can be a source of magnetic impurities. The innate nature of the synthesis process excludes any possibility of the contribution of impurities in the starting materials to the overall magnetic behaviour. The importance of the present work lies in its unambiguous determination of the intrinsic magnetic behaviour of graphene and related materials.Experimental
Preparation and characterization of MDMLG
3 g of Mg turnings were combusted in a groove made in a dry ice slab. The groove was covered tightly with another dry ice slab immediately after the ignition of Mg turnings and until completion of the combustion process. The product was treated with 5 M HCl and dried in an oven for 12 h at 100 °C.The morphology of the sample was studied using a field emission scanning electron microscope (FESEM, Model Zeiss Ultra 55) and a transmission electron microscope (Model FEI Technai G2 S-Twin) that were operated at 5 and 200 kV, respectively. The Energy Dispersive X-ray (EDX) spectrum of the sample was recorded using the EDX module in the FESEM at an accelerating voltage of 15 kV. X-ray diffraction (XRD) pattern of the sample was recorded using a Bruker's AXS Model D8 Advance System. The XRD pattern was recorded from 10 to 100° using Cu Kα as the X-ray source (λ = 1.54 Å). Micro-Raman scattering from the sample was recorded using a Alpha 300 of WiTec Raman spectrometer. The 532 nm green line of the Nd-YAG laser was used as the excitation source. The Raman spectrum was recorded in the wavenumber range of 500–3000 cm−1. Inductively Coupled Plasma Mass Spectroscopy (ICP-MS) was carried using a Perkin Elmer NexION 300 instrument. To study the ionic concentration of Fe in the MDMLG powder, the powder was dispersed in 100 ml of distilled water at different concentrations (2, 5, 10, 25, 50 and 100 mg) of MDMLG. These solutions were then uniformly shaken for 6 h using a shaker (Remi-make). Subsequently, each sample was filtered with a 0.22 μm disposable filter. The filtered samples were then analysed for concentration of Fe ions using standard ICP-MS practices. The pH of the solutions was measured to be in the range 7.21–6.47.
Magnetic measurements
Magnetic measurements were performed by using a Physical Property Measurement System-Vibrating Sample Magnetometer (PPMS-VSM), QUANTUM Design Inc. Magnetization (M) was measured as a function of magnetic field strength (H) at constant temperatures (M–H isotherms) and as a function of temperature (T) at constant H (M–T curves). After cooling the MDMLG sample from 300 K in ‘zero-field’ to the measurement temperature, magnetization, M versus H, hysteresis loops were measured at fixed temperatures of 2.5, 10, 50, and 300 K in the field range extending from −50 kOe to +50 kOe. Magnetization was also measured as a function of temperature at low fields (250 Oe and 1 kOe) in the ‘zero-field-cooled’ (ZFC) and ‘field-cooled’ (FC) modes. These measurements were repeated on the empty sample holder under exactly the same experimental conditions and using the same measurement protocol as that used prior to the removal of the sample from it. The data (background), so obtained, are subtracted from that recorded on the sample plus holder to arrive at the true sample signal.Results and discussion
Structural, morphological and phase characteristics
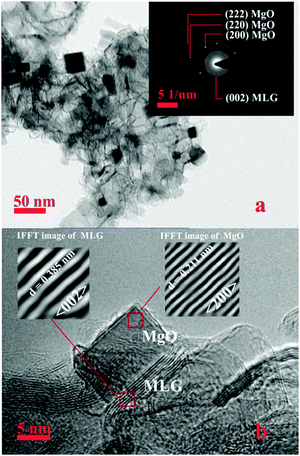
The structural attributes of MDMLG were unravelled by analysing X-ray and electron diffraction patterns. The XRD pattern of MDMLG is shown in Fig. 1. The broad diffraction peak at 2θ ≃ 26.34° is indexed as the (002) Bragg peak of MLG13 in MDMLG. Other prominent diffraction peaks, marked with corresponding Miller indices, belong to the cubic MgO (confirmed by the Crystallographica search-match database PDF no. 77-2179). The diffraction peak at 2θ ≃ 43.14° shows contributions from (100) MLG and (200) MgO overlapping Bragg peaks. However, the weak Bragg peak at 2θ ≃ 94.32° corresponds to the (400) reflection of MgO. The XRD pattern, displayed in Fig. 1, does not indicate the presence of any impurity phases in MDMLG except for the extremely weak (100) and (220) Bragg peaks of Mg(OH)2 and MgO2, respectively.The cube and cuboid-shaped features (of lateral dimensions of a few nm) in the high-resolution transmission electron micrograph (TEM; Fig. 2) correspond to MgO. The micrograph clearly shows that MgO is decked onto MLG at several locations. The electron diffraction pattern of MDMLG, shown in the inset of Fig. 2a, highlights the diffraction rings, corresponding to the (200), (220) and (222) reflections of MgO and (002) reflection of MLG. These observations are not only consistent with the XRD results but are also borne out by the TE micrograph (Fig. 2b). The inter-planar spacing, d, in both MLG and MgO is annotated in Fig. 2b. Inverse fast Fourier transform (IFFT) images further confirm the presence of MgO and MLG in MDMLG.
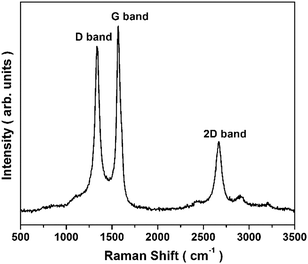
The Raman spectrum (Fig. 3) of MDMLG shows three prominent peaks corresponding to: (i) G-band (∼1568 cm−1), arising from the vibrations of stretching bonds of carbon atoms constituting the basal planes of layered graphene, (ii) D-band (∼1339 cm−1), indicating defects/disorder in the sample and (iii) 2D-band (∼2666 cm−1), characteristic of the layered nature of MLG.14 The broad, asymmetric and red-shifted 2D band signals the presence of layers of graphene stacked along their c-axis.14 Note that the presence of MLG in MDMLG is already confirmed by transmission electron microscopy.
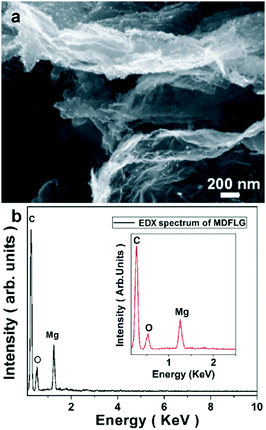
Further, EDX spectroscopy and ICP-MS are used to confirm the absence of all the impurities (in MDMLG) that could possibly contribute to the overall magnetic behaviour of MDMLG. The FESEM image (Fig. 4a) clearly demonstrates that small fragments (bright spots in Fig. 4a are MgO fragments) are decked onto MLG. The representative EDX spectrum (Fig. 4b) of MDMLG shows the presence of only C, Mg and O elements in the probed area. Nevertheless, a negligible amount of Si is detected. The weight and atomic percentages of elements present in MDMLG are displayed in Table 1.
| Element | Weight (%) | Atomic (%) |
|---|---|---|
| C | 75.66 | 82.16 |
| O | 17.22 | 14.04 |
| Mg | 6.86 | 3.68 |
| Si | 0.26 | 0.12 |
| Total | 100 | 100 |
For a particular element to be detected using EDX spectroscopy at the threshold voltage required to eject X-rays from that element, at least 0.1 wt% of that element should be present in the sample being probed.15 Considering that there is a possibility of the presence of magnetic impurities in graphene or MLG when graphite is used as a starting material to synthesize graphene or MLG,11 in this work, a graphite-free combustion process, which involved the use of high purity Mg strips and dry ice as the starting materials, has been used. Moreover, the combustion product was treated with 5 M HCl under vigorous stirring to remove metal contaminants, if any. HCl easily reacts with metals to form metal chlorides, which are easily dissolved in aqueous solutions. In this way also, the possibility of magnetic impurities (if any) has been eliminated. Any remote possibility of the presence of Fe related magnetic impurities (as possible ppm level impurities in Mg strips used in the synthesis) has also been ruled out. 1 ppm of α-Fe or α-Fe3O4 impurities should amount to a magnetization of 2.2 × 10⁻⁴ or 1.3 × 10⁻⁴ emu g−1, respectively.11 Assuming the presence of 0.1 wt% of α-Fe impurity in MDMLG, the room temperature saturation magnetization (Ms) of MDMLG should be11 ∼0.22 emu g−1. However, in the present case, the value ∼6.75 × 10⁻³ emu g−1 of Ms was measured at room temperature, which is approximately equivalent to the presence of 30 ppm of α-Fe. However, ICP-MS detected the amounts of Fe ions ranging between 2 and 17 ppb in the MDMLG. Thus, the Fe impurity level is far less than the amount that could account for the observed value of saturation magnetization. This permits us to conclude that the magnetic behaviour (to be discussed in the subsequent sections) of MDMLG is intrinsic in nature.
Magnetic characteristics
The raw and background-corrected M–H hysteresis loops of MDMLG at different temperatures are shown in Fig. 5. The enlarged view of the hysteresis loops at low fields is displayed as the inset in the respective sub-figures. The salient features of the data presented in Fig. 5 are: (i) magnetic hysteresis in the field range −1 kOe to +1 kOe (insets of Fig. 5), normally associated with the ferromagnetic (FM) ordering of spins, persists to temperatures as high as 300 K, and (ii) a linear relation between M and H outside this field range, reflects a concomitant paramagnetic (PM) contribution. | ||
| Fig. 5 M–H hysteresis loops of MDMLG, with and without background correction (BC), at 2.5 K, 10 K, 50 K and 300 K. The insets show the enlarged view of the hysteresis loops. | ||
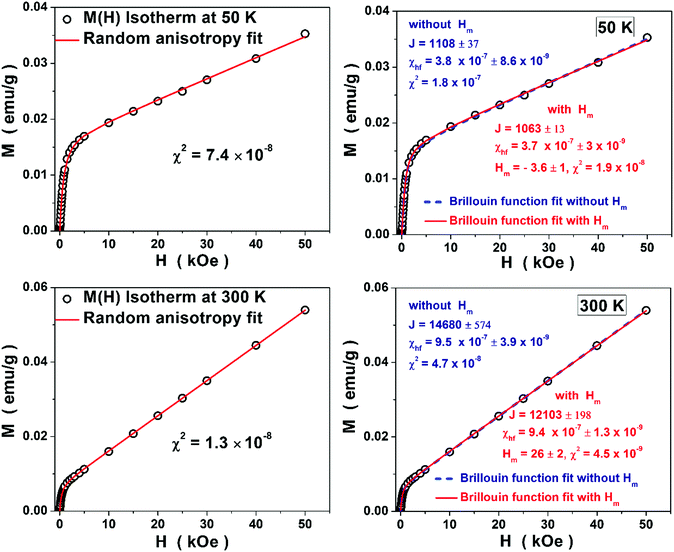
At first, the customary approach is followed and the “virgin” M(H) curves of the background-corrected hysteresis loops, are fit, as shown in Fig. 5, using the Brillouin function for a ferromagnet,
 | (1) |
 Heff = H + Hm is the effective field experienced by the spins within the system, H is the externally applied magnetic field, Hm = λMs is the molecular (exchange) field acting on a given spin because of the remaining exchange-coupled spins in the system, λ is the molecular field constant, Ms is the spontaneous magnetization, N is the number of atoms per unit volume, g is Lande's g-factor, J is the total angular momentum quantum number, μB is the Bohr magnetron and kB is the Boltzmann constant. In view of a strong paramagnetic response observed in the present case, eqn (1) was modified to include an additive term χhf(T) × H (χhf being the high-field susceptibility).
The Brillouin function fits to the M(H) data (open circles), based on the modified version of eqn (1), are obtained by treating J, Hm and χhf as free fitting parameters, and denoted by the continuous curves (dashed curves for Hm = 0) in the right panels of Fig. 6 and 7. The corresponding optimum J, Hm and χhf values are also displayed in these figures.
The Brillouin function (with an additive paramagnetic contribution) seems to describe the observed M(H) isotherms well but with unphysically large J, which is extremely sensitive to temperature. It is evident from Fig. 6 and 7 that, irrespective of the temperature, Hm is so small that its value cannot be fixed with any accuracy, i.e., even if Hm is set equal to zero, the quality of the fits remains essentially unaltered. Hm = 0 implies that no spontaneous magnetization exists at any temperature. It immediately follows that the long-range FM order is absent.
In an attempt to ascertain whether or not the observed M–H hysteresis is symptomatic of long-range FM order, the well-established fact that the characteristic experimental signature of long-range FM order is the existence of a finite spontaneous magnetization, Ms(T) ≅ M(T,H = 0), at temperatures below the Curie temperature, TC, has been considered. To this end, the Arrott scaling equation of state (SES)16 is used and the ‘background-corrected’ M(H) isotherms (shown in Fig. 6 and 7) are converted into the [M(T,H)]2versus [H/M(T,H)] Arrott-plot (AP) isotherms. According to the Arrott SES, the linear high-field portions of the AP isotherms, when extrapolated to (H/M = 0) and M2 = 0, yield17,18 intercepts on the M2 and H/M axes equal to [Ms(T)]2, spontaneous magnetization squared, for T ≤ TC and χ0−1(T), inverse initial susceptibility, for T ≥ TC. From the AP isotherms of MDMLG shown in Fig. 8, it is evident that the extrapolation of the high-field portions of the AP isotherms to H = 0 does not yield any intercepts on the M2-axis at any temperature and hence no spontaneous magnetization exists for T ≥ 2.5 K. Thus, consistent with the results of the Brillouin function analysis, the observed M–H hysteresis loops assert that, at best, short-range FM order (clusters) is (are) present. If these clusters do not interact with one another (superparamagnetic clusters), M(T,H) should be described by the Langevin function. In that case, when the magnetization M is plotted against H/T, all the M(H) isotherms must collapse onto a single universal curve. Such a plot shown in the inset of Fig. 8 clearly demonstrates that we are dealing with the interacting FM clusters in the present case.
With a view to gain further insight into the nature of magnetic ordering, the M(H) isotherms are analysed in terms of the Néel–Brown,19 micromagnetic20 and random anisotropy (RA)21 models for the approach-to-saturation in magnetization. The only model that closely reproduces the observed functional dependence of M on H is the RA model, which considers a ferromagnet with short-range exchange interaction and random single-ion anisotropy. For weak RA, this model predicts a crossover from a correlated spin glass state (having a finite ferromagnetic correlation length) at zero and weak external magnetic fields to a ferromagnet with a wandering axis22 (non-collinear FM state) at large fields. In the large field but weak random field regime (i.e., when H > Hex > Hr), the RA model yields the following expression for the approach-to-saturation in magnetization:
 | (2) |
The parameters Ms(T), Hr(T) and Hex(T), shown in Fig. 9, vary exponentially with temperature (continuous curves). The theoretical calculations,23,24 which consider the spins on the zigzag edges of graphene as the nearest-neighbour 1D classical Heisenberg system with weak axial anisotropy, predict that there exists a crossover temperature Tx ≅ 10 K25 above which the anisotropy effects are negligible and the spin–spin correlation length, ξ, for the zigzag-edge spins (essentially governed by the short-range exchange interactions coupling them) varies with temperature as ξ ∼ T−1, typical of an isotropic Heisenberg system, whereas below Tx, the anisotropy starts becoming important and ξ exhibits an exponential divergence as T → 0 K; a behavior akin to that in a 1D Ising model. In complete agreement with this theoretical prediction, Hex and hence, Ms (which are essentially determined by the exchange correlations) are small for T > Tx ≅ 10 K but grow exponentially as the temperature falls below Tx (Fig. 9). Within the framework of the above-mentioned theoretical calculations,23,24 a sharp peak in χhf(T) at the crossover temperature Tx can be understood as follows. Though the local random anisotropy field, Hr, like Ms and Hex, exhibits an exponential temperature dependence (Fig. 9), the local random anisotropy gets progressively averaged out for T < Tx as ξ grows exponentially. Consequently, as the temperature decreases below Tx, relatively smaller external fields are needed to saturate magnetization and hence χhf declines rapidly. Considering that anisotropy is inherently small for T > Tx, χhf decreases for T > Tx as well. Finite χhf (paramagnetism) at all temperatures presumably results from the defects23,24 in nanometer-sized MgO crystallites present in MDMLG.
 | ||
| Fig. 9 RA model parameters Ms, χhf, Hr and Hex as functions of temperature (open circles). Exponential fits to Ms(T), Hr(T) and Hex(T) are denoted by the continuous curves. | ||
ZFC and FC magnetizations i.e., MZFC(T) and MFC(T) thermomagnetic curves, before and after background correction, are shown in Fig. 10. As the sample temperature is reduced from 300 K, (i) the MZFC(T) and MFC(T) curves at H = 250 Oe (H = 1 kOe) bifurcate at the temperature Tirr ≅ 230 K (Tirr ≅ 80 K), where the irreversibility in magnetization sets in, (ii) both go through a peak at Tp ≅ 56 K (Tp ≅ 48 K), and (iii) regardless of the magnitude of the magnetic field, exhibit a sharp upturn when temperature falls below Tx ≅ 10 K. In sharp contrast with the concave-downward curvature of the MZFC(T) and MFC(T) curves at temperatures below the Curie temperature, Tc, in systems with long-range FM order, such curves in the present case have an overall concave-upward curvature. Customarily, the difference between MFC(T) and MZFC(T) is regarded as a direct measure of the irreversibility in magnetization, i.e., Mirr(T) = [MFC(T) − MZFC(T)]. As elucidated previously,26 the irreversibility in magnetization for T < Tirr results (at low-temperatures and magnetic fields) when a sizable fraction of zigzag-edge spins, trapped in the low-magnetization high-energy metastable state (i.e., in the MZFC(T) state) cannot get thermally activated over the anisotropy energy barrier to the high-magnetization least-energy stable state (i.e., to the MFC(T) state). Since the anisotropy energy-barrier height reduces with increasing temperature and magnetic field, beyond a certain threshold value of the magnetic field, specific to a given system, Mirr gets completely suppressed when all the spins are already in the minimum energy (stable FC) state. The peak in MZFC(T) and MFC(T) at Tp ≅ 56 K for H = 250 Oe, which gets displaced to lower temperatures with increasing fields, is a manifestation of the local antiferromagnetic ordering of spins at the opposite zigzag edges.27 The upturn observed at T ≤ 10 K (Fig. 11) in the MFC(T) and MZFC(T) thermomagnetic curves is normally understood in terms of the Curie–Weiss law, which reflects the paramagnetic contribution. It is evident from Fig. 11 that the exponential temperature dependence describes MFC(T) and MZFC(T) for T ≤ 20 K far better than the Curie–Weiss law, as is the case with Ms(T) and Hex(T). This exponential temperature dependence is a consequence of the exponentially growing correlation length of the spins at the zigzag edges as the temperature falls below Tx. The exponential temperature variations of coercive field, Hc, and remanent magnetization, Mr, displayed in Fig. 12, also have the same origin.
 | ||
| Fig. 11 Exponential and Curie–Weiss fits (continuous curves), to the thermomagnetic curves MZFC(T) and MFC(T) (open circles) at 250 Oe and 1 kOe. | ||
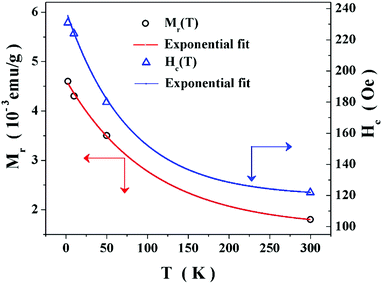 | ||
| Fig. 12 The exponential variations of remanent magnetization, Mr, and coercive field, Hc, with temperature for MDMLG. | ||
Conclusions
With a view to put to rest a longstanding controversy surrounding the intrinsic magnetic behaviour of graphene with zigzag edges, magnetic contamination of MgO decked multi-layered graphene (MDMLG) was avoided by synthesizing MDMLG by a combustion process that does not involve the use of graphite (which can be a source of magnetic impurities). Since MDMLG samples are expected to be feebly magnetic, magnetization as a function of temperature at a constant field, MH(T), and as a function of field at constant temperature, MT(H), is measured under identical conditions (i.e., following exactly the same measurement protocol) on the sample-holder with and without the sample mounted on it. The ‘raw’ data (sample mounted on the sample-holder) were corrected for the background (sample-holder with the sample removed but the mounting tapes, etc., intact) to arrive at the true magnetic signal from the sample. From an elaborate analysis of the high-precision magnetization data, so obtained, the presence of a long-range FM ordering at temperatures T ≥ 2.5 K is completely ruled out. Instead, a non-collinear FM short-range order and a paramagnetic contribution persists up to the highest measurement temperature, 300 K. The Curie–Weiss law fails to correctly describe the upturn observed at T ≲ 10 K in the FC and ZFC thermomagnetic curves taken at low fields. The observed exponential temperature variations of MFC and MZFC, remanent magnetization, saturation magnetization, coercive field, exchange field and random anisotropy field are shown to basically reflect the exponential growth of the correlation length for the spins at the zigzag edges of graphene as the temperature falls below the temperature, Tx ≅ 10 K where a crossover from extremely weak to moderately weak magnetic anisotropy occurs. The paramagnetic response, on the other hand, is induced by the defects in the nanometer-sized MgO crystallites in MDMLG.Acknowledgements
The authors thank the Centre for Nanotechnology, University of Hyderabad, for allowing the use of the Transmission Electron Microscope and the Physical Property Measurement System.References
- T. L. Makarova, B. Sundqvist, R. H. Ehne, P. Esquinazi, Y. Kopelevichk, P. Scharff, V. A. Davydov, L. S. Kashevarova and A. V. Rakhmanina, Nature, 2001, 413, 716 CrossRef CAS PubMed.
- S. Ma, J. H. Xia, V. V. S. S. Srikanth, X. Sun, T. Staedler, X. Jiang, F. Yang and Z. D. Zhang, Appl. Phys. Lett., 2009, 95, 263105 CrossRef.
- A. V. Rode, E. G. Gamaly, A. G. Christy, J. G. Fitz Gerald, S. T. Hyde, R. G. Elliman, B. Luther-Davies, A. I. Veinger, J. Androulakis and J. Giapintzakis, Phys. Rev. B: Condens. Matter Mater. Phys., 2004, 70, 054407 CrossRef.
- P. Esquinazi, D. Spemann, R. Hohne, A. Setzer, K.-H. Han and T. Butz, Phys. Rev. Lett., 2003, 91, 227201 CrossRef CAS PubMed.
- H. Kumazaki and D. Hirashima, Physica E, 2008, 40, 1703 CrossRef CAS.
- Z. He, H. Xia, X. Zhou, X. Yang, Y. Song and T. Wang, J. Phys. D: Appl. Phys., 2011, 44, 085001 CrossRef.
- C. Wang and D. Diao, Appl. Phys. Lett., 2013, 102, 052402 CrossRef.
- L. Xie, X. Wang, J. Lu, Z. Ni, Z. Luo, H. Mao, R. Wang, Y. Wang, H. Huang, D. Qi, R. Liu, T. Yu, Z. Shen, T. Wu, H. Peng, B. Özyilmaz, K. Loh, A. T. S. Wee, Ariando and W. Chen, Appl. Phys. Lett., 2011, 98, 193113 CrossRef.
- R. R. Nair, M. Sepioni, I.-L. Tsai, O. Lehtinen, J. Keinonen, A. V. Krasheninnikov, T. Thomson, A. K. Geim and I. V. Grigorieva, Nat. Phys., 2012, 8, 199 CrossRef CAS.
- H. S. S. Ramakrishna Matte, K. S. Subrahmanyam and C. N. R. Rao, J. Phys. Chem. C, 2009, 113, 9982 Search PubMed.
- M. Venkatesan, P. Dunne, Y. H. Chen, H. Z. Zhang and J. M. D. Coey, Carbon, 2013, 56, 279 CrossRef CAS.
- B. Z. Shakhashiri, Chemical Demonstrations: A Handbook for Teachers of Chemistry, 1983, vol. 1, pp. 90–92 Search PubMed.
- A. Chakrabarti, J. Lu, J. C. Skrabutenas, T. Xu, Z. Xiao, J. A. Maguire and N. S. Hosmane, J. Mater. Chem., 2011, 21, 9491 RSC.
- A. C. Ferrari, Solid State Commun., 2007, 143, 47 CrossRef CAS.
- P. Kuisma-Kursula, X-Ray Spectrum., 2000, 29, 111 CrossRef CAS.
- A. Arrott, Phys. Rev., 1957, 108, 1394 CrossRef CAS.
- S. N. Kaul, J. Magn. Magn. Mater., 1985, 53, 5 CrossRef CAS.
- S. N. Kaul, IEEE Trans. Magn., 1984, MAG–20, 1290 CrossRef CAS.
- W. F. Brown Jr., Phys. Rev., 1940, 58, 736 CrossRef.
- H. Kronmüller, IEEE Trans. Magn., 1979, MAG–15, 1218 CrossRef.
- E. M. Chudnovsky, W. M. Saslow and R. A. Serota, Phys. Rev. B: Condens. Matter Mater. Phys., 1986, 33, 251 CrossRef.
- S. N. Kaul, Curr. Sci., 2005, 88, 78 CAS.
- O. V. Yazyev and M. I. Katsnelson, Phys. Rev. Lett., 2008, 100, 047209 CrossRef PubMed.
- O. V. Yazyev, Rep. Prog. Phys., 2010, 73, 056501 CrossRef and references cited therein.
- A. C. Faria and A. T. Pires, J. Phys. C: Solid State Phys., 1979, 12, 2637 CrossRef.
- S. P. Mathew and S. N. Kaul, J. Phys.: Condens. Matter, 2012, 24, 256008 CrossRef CAS PubMed.
- H. Lee, Y.-W. Son, N. Park, S. Han and J. Yu, Phys. Rev. B: Condens. Matter Mater. Phys., 2005, 72, 174431 CrossRef.
| This journal is © the Owner Societies 2017 |


