
Probing helical transitions in a DNA duplex†
Debayan
Chakraborty
* and
David J.
Wales
*
Department of Chemistry, University of Cambridge, Lensfield Road, CB2 1EW, UK. E-mail: dc550@cam.ac.uk; dw34@cam.ac.uk
First published on 2nd December 2016
Abstract
The complex conformational change from B-DNA to Z-DNA requires inversion of helix-handedness. Multiple degrees of freedom are intricately coupled during this transition, and formulating an appropriate reaction coordinate that captures the underlying complexity would be problematic. In this contribution, we adopt an alternative approach, based on the potential energy landscape perspective, to construct a kinetic transition network. Microscopic insight into the B → Z transition is provided in terms of geometrically defined discrete paths consisting of local minima and the transition states that connect them. We find that the inversion of handedness can occur via two competing mechanisms, either involving stretched intermediates, or a B–Z junction, in agreement with previous predictions. The organisation of the free energy landscape further suggests that this process is likely to be slow under physiological conditions. Our results represent a key step towards decoding the more intriguing features of the B → Z transition, such as the role of ionic strength and negative supercoiling in reshaping the landscape.
Introduction
Despite improvements in computer hardware over the last few decades, simulations of complex systems characterised by ‘rare event’ dynamics remain challenging. Examples include biomolecular folding, chemical reactions, isomerisation of clusters, and phase transitions.1–5 The specific challenges involved in studying these pathways are intricately linked to the complexity of the underlying potential energy surface.6 Such processes are usually not amenable to brute-force simulations. Hence, significant effort in the chemical physics community has been directed towards the development of enhanced sampling methods. To accelerate the exploration of phase space, techniques such as parallel tempering/replica exchange7–10 and Wang–Landau sampling11 exploit multiple simulations at different temperatures or energies, respectively. Umbrella sampling,12,13 metadynamics14,15 and steered molecular dynamics,16 among others,17–20 rely on predefined reaction coordinates or collective variables to sample regions associated with low probability, while schemes based on hyperdynamics21,22 and accelerated molecular dynamics23,24 deform the underlying potential energy surface to accelerate barrier crossing.The simulation techniques described above generally do not preserve kinetic information, and often invoke low-dimensional projections to describe a free energy surface. Kinetically separate regions can merge together in such projections, concealing the true dynamics.25,26 Detailed analysis of an atomic cluster illustrates how even a relatively successful structural order parameter is unable to separate two alternative surface packings.26 Alternative techniques, such as transition path sampling,27,28 transition interface sampling,29,30 milestoning31–33 and forward flux sampling,34,35 which generate reactive trajectories27 between two regions of phase space, do not require a reaction coordinate.
In the present contribution, we treat ‘rare event’ dynamics using kinetic transition networks.36–38 Research in this area has progressed along two complementary fronts. While several groups exploit explicit dynamics to build transition networks in the context of Markov State Models (MSM),37–39 we have actively developed tools based on the potential energy landscape framework.6,36 Our approach is based on a coarse-grained description of the underlying potential energy landscape in terms of stationary points (minima and transition states). The stationary points are located using geometry optimisation in a time-independent fashion, making the approach particularly attractive for landscapes featuring broken ergodicity. The connections between different regions of configuration space are defined geometrically in terms of discrete paths consisting of interconnected min-TS-min triples.40,41 This key feature allows us to probe complex conformational transitions where multiple degrees of freedom are coupled, and defining a useful low-dimensional reaction coordinate may be problematic.
In the present application, we investigate the B → Z transition in a DNA duplex, which involves an inversion of helix handedness. This conformational switch is one of the slowest transformations of contemporary interest in biology,42–44 involving large-scale correlated motions of the DNA helix. Formulating convenient reaction coordinates that would correctly capture the complexity of this helical transition is a formidable task. Characterising the corresponding pathways therefore provides an ideal testing ground for our computational energy landscape framework.
The possibility of a switch in helix-handedness in DNA was first raised when Pohl and Jovin45 reported an inversion of the CD spectrum for a poly(GC) DNA construct at high salt concentration. Subsequently, Rich and coworkers characterised the crystal structure of Z-DNA.46,47 This structure was quite unlike the canonical B-DNA form, exhibiting a zig-zag phosphate backbone with an alternating pattern of syn and anti glycosidic torsions.43,46,47 In particular, sequences having an alternating purine–pyrimidine repeat were found to have a higher propensity to form the Z-DNA structure,43,48,49 although exceptions to this pattern were later reported.50–52 These initial results were considered rather perplexing, and were met with a mix of excitement and apprehension.53,54 However, the revelation that Z-DNA can exist in vivo,55,56 and is associated with key cellular functions,43,53–58 has led to renewed interest in investigating the B → Z transition. Recent studies also indicate that Z-DNA formation may be linked to certain types of cancer59 and Alzheimer's disease.60–62
Although B-DNA is the favoured conformation at physiological conditions, transition to the Z-DNA form can be triggered by increasing the salt concentration,42,43,45,63 methylation,64–66 negative supercoiling,67–69 or binding to specific proteins.70,71 Certain polyamines,72–74 small molecules,75–77 and polynuclear complexes78,79 are also known to stabilise the Z-DNA conformation. Experiments have traditionally employed CD45,80–83 and NMR spectroscopy84–88 to study the B → Z transition. Recent work employing FRET techniques89–91 has complemented these studies and provided new insight into the kinetics of the conformational transformation.
In addition to the wealth of experimental information, several models have been proposed for the B → Z transition. The Harvey model92 suggested that the process is cooperative, and facilitated by rotation of the nucleobases, without the disruption of the Watson–Crick base-pairs and unwinding of the helix. In contrast, the Wang model46 suggested that base-pair opening was necessary before the rotation of the nucleobases could take place. However, as there was no provision for helix unwinding during the reversal of handedness, these models posed a steric dilemma known as the ‘chain sense paradox’.44 The Saenger–Heinemann model93 attempted to address this shortcoming by suggesting the presence of A-DNA type intermediates along the transition path. More recently, Lim and Feng94,95 proposed a stretched intermediate model as a plausible solution to the ‘chain sense paradox’. Another hypothesis known as the zipper model96,97 was suggested to explain the reversal of handedness. This model is based on thermodynamic considerations44,96,97 and proposes that the B → Z transition takes place via the systematic propagation of a B–Z junction. The recent discovery of a crystal structure98 for the B–Z junction lends additional support to this viewpoint. Alternative ideas for the B → Z transition exist, and some of them are variations of the models described above. For a detailed comparison of the different models, including their strengths and their shortcomings, we refer readers to the review by Pérez and coworkers.44
Following early work99–101 on the energetics of the helical transformation, various computational studies have aimed to capture the essential features of the different transition models, and rationalise various aspects of the experimental data. The salt dependent thermodynamics of the B → Z transformation was explained by Hirata and Levy102 using 3DRISM theory, and in later years by Montoro and Abascal103–105 employing different models of DNA. In addition, a recent study exploited thermodynamic integration to provide an accurate estimate of the salt concentration at which B-DNA and Z-DNA can coexist.106 The inversion of the CD spectrum at high salt concentrations, which is a key signature of handedness switching, was investigated using quantum mechanical calculations by Miyahara and coworkers.107,108 Interestingly, the authors suggest that the reversal of sign is caused by the stacking interactions in the Z-DNA conformation, rather than the syn orientations of the purine nucleobases. Detailed comparison of the contrasting viewpoints for handedness switching have generally come from statistical mechanical models,109,110 and studies employing stochastic difference equations.94,111
The complex nature of the B → Z transition,42–44 coupled with the slow kinetics,82,90,91 makes it very difficult to obtain microscopic insight using unbiased simulations. Hence, several studies have employed reaction coordinate based approaches to map out putative transition pathways.95,112–114 While initial studies95,112 employing targeted molecular dynamics simulations argue in favour of a stretched intermediate model, subsequent work113 suggests that a pathway involving B–Z junctions may be more favourable. In recent work, Sagui and coworkers114 also indicate the possibility of two competing mechanisms based on adaptively biased simulations. These studies reveal key details regarding the likely mechanisms for the conformational transition, however, the use of predefined reaction coordinates imposes fundamental limitations. In the present work we provide atomistic insight into the B → Z transition from an energy landscape perspective. Our study illustrates how a large-scale conformational change in DNA can be treated without using any predefined reaction coordinate.
We find that the underlying energy landscape consists of two principal funnels leading to the B-DNA and Z-DNA conformations. The inversion of handedness takes place via two competing pathways, either involving stretched intermediates or a B–Z junction, in agreement with some of the previous studies.94,95,113,114 However, our results reveal some additional complexity, which is unlikely to be captured by projection-based approaches.
Computational methodology
Preparation of starting structures
Here we consider a DNA hexamer duplex with the sequence (CGCGCG)2. The initial coordinates for Z-DNA were taken from a previously published high resolution crystal structure (PDB code: 3P4J).115 The initial structure of B-DNA was constructed using the nucleic acid builder (NAB) module available within the AMBER code.116 The DNA duplex was modelled using a properly symmetrised version of the AMBER99bsc0 force field,117 employing the latest ε and ζ torsional corrections.118 Symmetrisation is essential to ensure that accessible permutational isomers have the same energy.119 For exploration of the energy landscape, solvent effects were treated implicitly using a generalised Born model.120,121 An effective salt concentration of 1.0 M was maintained using the Debye–Hückel approximation.122Molecular dynamics simulations
The initial structures of B-DNA and Z-DNA were solvated in a truncated octahedral box of TIP3P water molecules, with a solvent buffer of at least 10 Å on each side. The net charge in the simulation box was neutralised by adding an appropriate number of Na+ counterions. Extra Na+ and Cl− ions were added to maintain a salt concentration of approximately 1.0 M. The ion parameters appropriate for the TIP3P water model, as proposed by Joung and Cheatham,123 were used. The electrostatic energy was computed using the particle mesh Ewald summation technique,124 using the standard settings in the AMBER code.116 In all the simulations, a 10 Å cutoff for the non-bonded interactions was employed. An integration time-step of 2 fs was used in conjunction with SHAKE constraints125 for all the bonds involving hydrogen atoms. The simulations were carried out using the GPU enabled version of the AMBER12 code.116The solvated systems were first minimised to remove steric clashes. After minimisation, the temperature of the system was raised from 0 to 298 K with 25 ps of NVT dynamics. During this time, 50 kcal mol−1 positional restraints were applied on the DNA molecule. The restraints were relaxed through five subsequent cycles of NVT simulations, each of length 25 ps. During this phase, temperature control was maintained via a Langevin thermostat126 employing a collision frequency of 0.2 ps−1. After heating dynamics and progressive relaxation, the density of the system was equilibrated using 2 ns of NPT simulations, at a constant pressure of 1 bar and temperature of 298 K. Following equilibration, production runs of duration 200 ns were carried out in the NPT ensemble.
The various structural parameters for DNA were calculated using the 3DNA127 software.
Construction of kinetic transition networks using discrete path sampling
The energy landscape of the DNA duplex was explored using the discrete path sampling (DPS) technique.40,41 DPS exploits geometry optimisation to provide a coarse-grained description of the thermodynamics and kinetics in terms of databases of stationary points (minima and transition states). It has previously been used to study a diverse range of atomic and molecular systems,128–131 and has proved to be particularly efficient for landscapes featuring broken ergodicity.36,40,41,132 In contrast to conventional Monte Carlo and molecular dynamics simulations, DPS is largely unaffected by kinetic bottlenecks and can probe ‘rare events’ over a hierarchy of time scales. As the formalism has been discussed in earlier work,40,41 only the key steps are presented in this section.The connectivity between stationary points on the potential energy surface (PES) is described in terms of discrete paths.6,40,41 A discrete path between two endpoints of interest consists of a sequence of minima connected by intervening transition states. The endpoints are denoted as reactant and product, respectively. Here, we use a geometric criterion to identify minima and transition states.133 For each stationary point, the normal mode frequencies are obtained from the eigenvalues of the mass-weighted Hessian matrix.6 A local minimum on the PES is defined as a stationary point for which all the nonzero normal mode frequencies are positive, whereas a transition state has a single imaginary frequency.6,133 Displacements parallel and antiparallel to the corresponding eigenvector are used to define steepest-descent paths that lead to the adjoining minima.6
The OPTIM code134 interfaced with the AMBER9 package135 was used for all the geometry optimisations, transition state searches, and normal mode analysis. Local minimisations were carried out using a modified version of the LBFGS algorithm described by Liu and Nocedal.136 The doubly-nudged137 elastic band138–140 (DNEB) method was used to locate candidate structures for intervening transition states between pairs of local minima. The transition state candidates were further refined using hybrid eigenvector-following.141 Geometry optimisations were deemed to have converged when the root-mean-square-gradient fell below 10−6 kcal mol−1 Å−1. A large number of intervening minima and transition states can be located after each cycle, especially if the reactant and product states are far apart in configuration space. As a result, the number of possible connections between local minima that might be tried to generate a fully connected discrete path increases with each connection cycle. To circumvent a combinatorial problem, the missing connection algorithm142,143 was used to construct a priority list of connection attempts based on appropriate edge weights.
After an initial discrete path was identified between different endpoints of interest, the databases were further expanded using various refinement schemes available within the PATHSAMPLE144 program to locate pathways characterised by lower energy barriers145 (SHORTCUT BARRIER) and shorter path lengths145 (SHORTCUT). During the refinement step we exploited some recently introduced interpolation techniques based on natural internal coordinates146 and quasi-continuous schemes,147 which exploit the connectivity of the covalently bonded network. Our previous experience146,147 suggests that these methods are very effective in circumventing common problems associated with linear interpolations, such as unphysical chain crossings and steric clashes in the intervening images.
Extensive sampling of specific discrete paths can introduce artificial frustration (kinetic traps) into the stationary point databases. This frustration is caused by undersampling, and needs to be removed to make the stationary point databases more faithful representatives of the global kinetics. Here, we used the UNTRAP scheme145 available within the PATHSAMPLE code to remove artificial traps from the databases. Candidate minima for ‘untrapping’ are chosen based on the ratio of the potential energy barrier to the potential energy difference from the product region. Connections were attempted between the selected minima and the product minimum to find lower barriers and better paths. The final stationary point databases were obtained after sequential refinements using the SHORTCUT BARRIER, SHORTCUT and UNTRAP schemes.
The stationary point databases constitute a kinetic transition network, which can be used to analyse the global thermodynamics and kinetics. The rate constant kSSBA for the A → B conformational transition can be expressed as an infinite sum over all discrete paths, when the intervening minima are treated in steady-state and the dynamics between adjacent minima are assumed to be Markovian.40,41 The sum over discrete paths is weighted by the occupation probability of the reactant minimum, as well as the relevant branching probabilities.40,41 The transitions between the DNA conformational states were visualised in terms of pathways (‘fastest paths’) that make the largest contribution to the steady-state rate constants. These pathways were extracted from the stationary point databases using Dijkstra's shortest path algorithm142 with appropriate edge weights.128 In addition, the possibility of competing pathways was considered, and we used the recursive enumeration algorithm148,149 to obtain the set of discrete paths that contribute significantly to the overall rate constant.
Estimation of free energies
Free energies at 298 K were estimated from the stationary point databases using the harmonic superposition approximation (HSA).150 Within the HSA framework, the canonical partition function is written as a sum of contributions from the catchment basin of each local minimum.151,152 The vibrational density of states is estimated from the normal mode frequencies, assuming that the potential well around each minimum is harmonic.128,129,150 A self-consistent regrouping scheme129,153 was used to lump together minima which are separated by free energy barriers below a specified threshold into one macrostate. As a result, the reactant and product states are expanded into ensembles of structures in local equilibrium, and any bias arising due to the original choice of endpoints is alleviated.Visualisation of energy landscapes
Disconnectivity graphs were used to provide a visual representation of the free energy landscape.25,154–157 A disconnectivity graph segregates the energy landscapes into disjoint sets of minima, known as superbasins.154 Minima within each superbasin are mutually accessible via transition states lying below a chosen energy threshold, whereas interbasin transitions must overcome higher potential or free energy barriers. Unlike low-dimensional projections of the energy landscape, which may merge basins separated by high barriers and lead to artificially smooth surfaces,26 disconnectivity graphs capture the underlying complexity and retain the kinetic information.25,157Results and discussion
The B-DNA and Z-DNA ensembles
Molecular dynamics simulations were first carried out at 298 K to assess the thermodynamic stability of the B-DNA and Z-DNA structures. The key results are summarised in Fig. 1. Overall, the trajectories were stable and no major structural distortions were observed. For B-DNA, occasional fraying of the terminal base-pairs was noticeable. This dynamical feature is consistent with previous MD simulations158–161 and experiments.162,163 The terminal cytosines (C1 and C7) have a greater propensity to undergo fraying compared to their guanine partners (G12 and G6). Occasionally, the C1 and C7 nucleobases undergo anti → syn flips about the glycosidic torsion angle (χ) after fraying out of the helix. In contrast, no χ torsional flips were observed for the terminal guanines, G12 and G6. At around 97 ns, the C1 nucleobase undergoes a χ torsional flip after fraying, and subsequently enters the helix to establish a trans Watson–Crick/sugar edge (tWS) base-pair with the G12 nucleobase. The base-pair remains stable for the rest of the trajectory, and does not revert back to the canonical Watson–Crick (WC) orientation. The G6–C7 base-pair adopts a tWS geometry after approximately 170 ns, following the anti → syn flip of C7. Similar base-pairing geometries have also been characterised for RNA structures by Westhof and coworkers.164 In addition to the two internucleotide hydrogen-bonds, an intranucleotide hydrogen-bond formed between the O5′ and O2 atoms of the cytosines lends stability to the tWS base-pair. The strength of the tWS base-pairing interaction and the corresponding lifetimes may be overestimated due to imbalances in the current force field.158,159 Using a reparametrised version,161,165 Orozco and coworkers have recently shown that the tWS base-pairs are usually short-lived and undergo reversible transitions to the canonical WC orientation. In contrast to B-DNA, no base-pair fraying was observed for Z-DNA within the time scale of our MD simulations.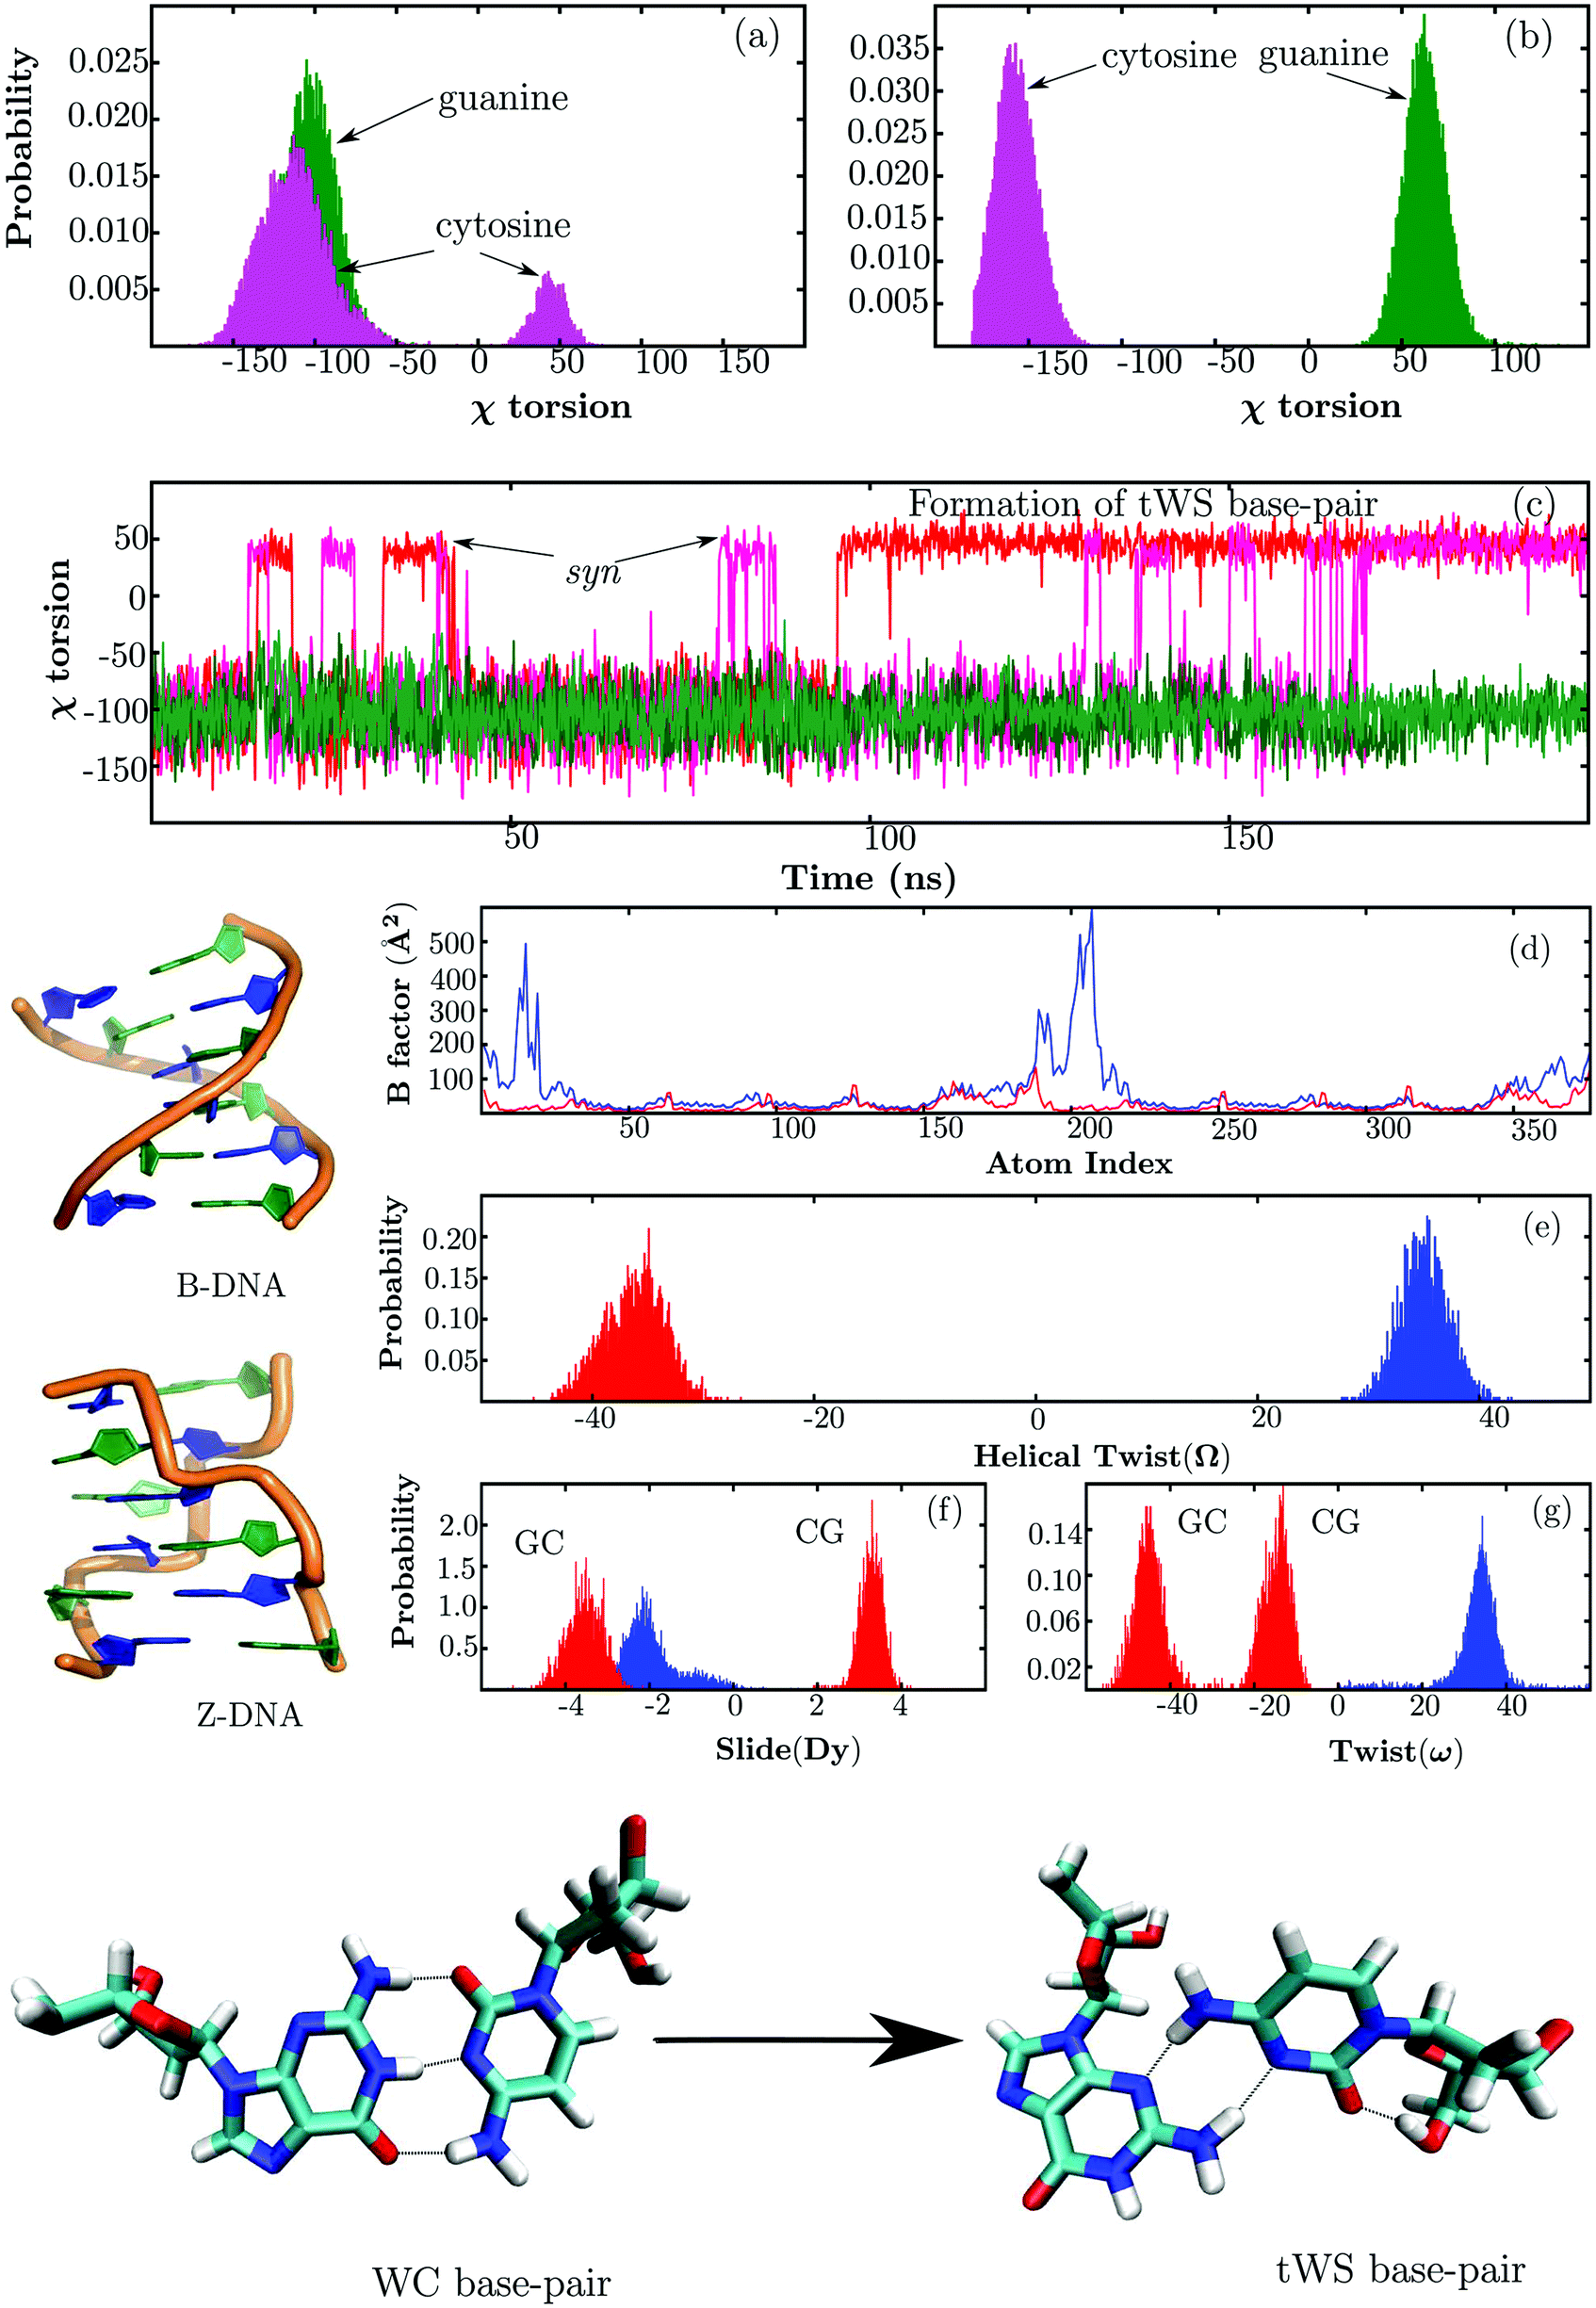 | ||
| Fig. 1 Summary of the key results from the molecular dynamics simulations. (a and b) Show the distributions of χ torsions in B-DNA and Z-DNA, respectively. Evolution of the χ torsions along the MD trajectory for B-DNA is shown in (c). The red and magenta lines correspond to the C1 and C7 nucleobases, respectively, while the green lines correspond to the G12 and G6 nucleobases. The estimated B factors for B-DNA (blue) and Z-DNA (red) are shown in (d). (e, f and g) Show the distributions of helical twist, slide and twist, respectively. The colouring scheme is the same as in (d). | ||
The distribution of χ torsions in Fig. 1(a) indicates that the guanine nucleobases in B-DNA exclusively sample anti orientations along the trajectory. In contrast, a minor peak appears in the syn region for cytosines owing to the occasional anti → syn flips of the terminal bases (C1 and C7). Unlike B-DNA, the χ torsions in Z-DNA exhibit an alternating pattern, with the guanines adopting syn orientations and cytosines adopting anti orientations along the length of the DNA chain.43,46,47 This structural feature is correctly reproduced in our simulations, and is reflected in the distribution shown in Fig. 1(b).
The higher B factors indicate that B-DNA is intrinsically more flexible than Z-DNA, in agreement with previous studies.166–168 The enhanced mobility of terminal base-pairs in B-DNA results in prominent peaks in the B factor plot. The global structural parameters that are useful in distinguishing the prominent DNA conformations are well documented in the literature.169,170 For brevity, we will only discuss the observed trends for a few key parameters, namely helical twist (Ω), slide (Dy) and twist (ω). Among the base-pair step parameters, slide describes the translational motion of a base-pair relative to its neighbour along the direction of the DNA strand, while twist describes the rotation of base-pairs relative to one another.127,169 As expected, B-DNA is associated with a positive helical twist, and along the trajectory the corresponding values range from 27° to 43°. The average helical twist (35°) is in good agreement with values previously reported by the Ascona B-DNA Consortium.171,172 For Z-DNA, the helical twist is estimated to be −36°, and the corresponding distribution spans the range from −45° to −26°. The distributions of slide and twist are unimodal for B-DNA. In contrast, due to the zigzag nature of the Z-DNA backbone, the CG and GC base-pair steps exhibit different values of slide and twist respectively, resulting in bimodal distributions.
To generate initial samples of minima from the B-DNA and Z-DNA ensembles, configurations from the MD trajectories were saved every 10 ps and subsequently locally minimised using an implicit solvent model, after removing the ions and the water molecules. A 10 ps interval seems to be a reasonable choice: shorter values (∼1 ps) result in many snapshots that quench to the same minimum, and if the window is too long (∼100 ps) then some of the low-lying minima are skipped.
For B-DNA, the lowest potential energy minimum exhibits tWS base-pairing interactions at both the helix terminals. Several low-lying conformations were also located in which the terminal base-pairs adopt the canonical WC orientation. The lowest energy structure from this ensemble is destabilised by approximately 6 kcal mol−1 with respect to the putative B-DNA global minimum. In contrast to the B-DNA ensemble, the lowest potential energy minimum for Z-DNA exhibits WC base-pairing throughout the length of the helix.
Construction of stationary point databases (kinetic transition networks) using the discrete path sampling framework requires an appropriate choice of endpoints, which are assigned as reactant and product states. The lowest energy minimum identified for Z-DNA was selected as the sole initial representative of the product state. For the initial reactant state, we included the lowest energy B-DNA structure as well as the lowest energy duplex having all the base-pairs in the WC orientation.
After initial discrete paths were characterised between the different endpoints, the rest of the minima from the B-DNA and Z-DNA ensembles identified from the MD simulations were added to the kinetic transition network. This process involved connection making attempts between the lowest energy B-DNA/Z-DNA minimum and the rest of the minima in the corresponding ensembles in a pairwise fashion. The network was further expanded using the schemes outlined in the Computational methodology section. The refinement process was continued until the ‘fastest paths’ between the different endpoints and the corresponding phenomenological rate constants converged with respect to the addition of new stationary points. At this point the transition network contained 43![[thin space (1/6-em)]](https://www.rsc.org/images/entities/char_2009.gif) 934 minima and 48309 transition states.
934 minima and 48309 transition states.
In subsequent sections, we discuss the organisation of the underlying free energy landscape and provide mechanistic insight into the pathways between the various DNA conformations.
Free energy landscape
The free energy landscape computed at 298 K is depicted in the form of a disconnectivity graph in Fig. 2. The graph was generated by recursively regrouping minima separated by free energy barriers less than 5 kcal mol−1 in a self-consistent fashion.129,153 This regrouping threshold seems appropriate as qualitatively similar graphs were produced for a range of values around this selection, and from the ungrouped stationary point databases. | ||
| Fig. 2 Free energy landscape computed at 298 K using a regrouping threshold129,153 of 5 kcal mol−1. The branches are coloured according to the handedness (H) of the DNA structure, with positive values representing right-handed conformations and negative values representing left-handed conformations. Some representative structures from the different conformational ensembles are also shown. | ||
The B-DNA and Z-DNA conformations are separated by high free energy barriers, and are located at the bottom of the two principal funnels. In addition, a diverse range of DNA conformations appear in different regions of the landscape. Some representative snapshots from the key structural ensembles are shown superimposed on the disconnectivity graph (Fig. 2). The branches of the graph are coloured according to a geometrical order parameter recently introduced by Sagui and coworkers to describe the ‘handedness’ (H) of DNA helices114 and polyproline peptides.173 For right-handed helical turns H > 0, whereas H < 0 for left-handed turns. The overall helix handedness is expressed as a sum over all the helical turns along the DNA sequence.114,173 This particular order parameter leads to a segregation of the different regions of the free energy landscape, especially the two major funnels leading to the B-DNA and Z-DNA conformations. However, some minor intermixing of colours is observed in the higher energy regions of the graph, indicating that geometrically defined parameters alone are not sufficient to capture the full complexity of the underlying landscape.174
The free energy global minimum corresponds to an ensemble of B-DNA conformations. The constituent duplexes are similar in terms of helicity, but exhibit a diverse range of orientations for the terminal base-pairs (Fig. S1, ESI†). Structures having either one or both the terminal base-pairs hydrogen-bonded in a tWS fashion are the most prominent members of the ensemble. In addition, we also identified structures in which one of the terminal bases (primarily the cytosines) were frayed out, or stacked on top of the base-pairing partner. The emergence of these non-canonical configurations for the current force field is consistent with our initial MD simulations and previous work.158,159 In some of the structures one of the terminal base-pairs adopted a WC orientation, but there were no duplexes in the ensemble that retained WC interactions at both the termini. Canonical B-DNA structures in which all the base-pairs have WC hydrogen-bonds constitute the second-lowest free energy group. Only one structure from this group has the C1 nucleobase frayed out of the helix. Interestingly, at a regrouping threshold of 6 kcal mol−1 the two conformational ensembles described above merge into a single free energy minimum, implying that the different B-DNA structures would interconvert on a time scale153 of about 3.8 × 10⁻⁹ s.
In contrast to B-DNA, the lowest free energy Z-DNA ensemble is structurally homogeneous and exhibits only minor variations in some of the internal degrees of freedom. To quantify the contrasting flexibilities of the B-DNA and Z-DNA conformations, the log product of the normal-mode frequencies (Λ) for minima comprising the corresponding free energy ensembles was computed. Flexible structures would be associated with lower Λ values, as vibrational entropy is proportional to −Λ within the harmonic approximation. As shown in Fig. 3, the Λ values corresponding to Z-DNA conformations are distributed over a narrow range and are higher than most B-DNA structures, suggesting that B-DNA is indeed more flexible than Z-DNA. The harmonic approximation does not account for well anharmonicity.6,150 Nonetheless, the trend in flexibilities is correctly captured, in line with the B factors estimated from the MD simulations.
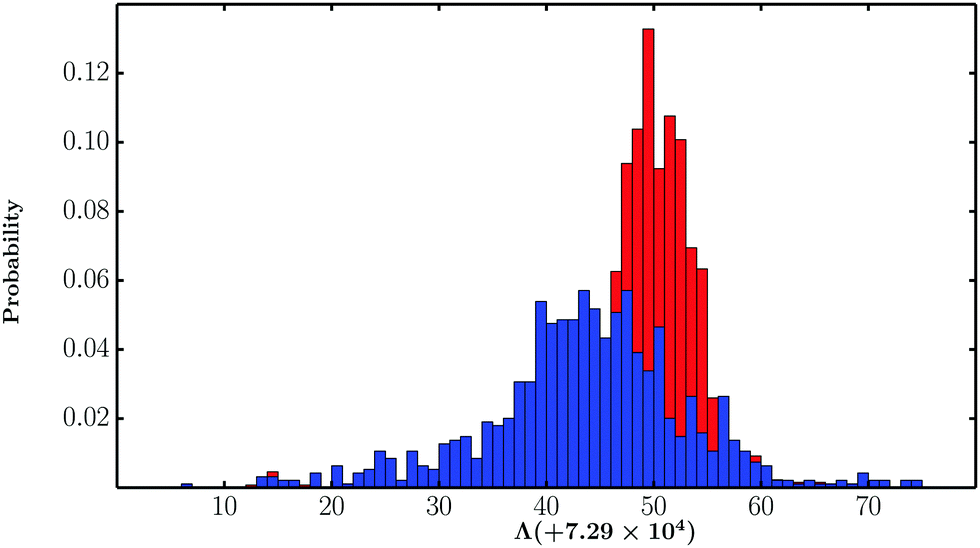 | ||
| Fig. 3 Distribution of Λ values for minima constituting the free energy groups corresponding to the B-DNA (blue) and Z-DNA (red) conformations. | ||
We were also able to identify A-DNA type structures in the low-lying regions of the disconnectivity graph, close to the B-DNA funnel, and separated by relatively low energy barriers. Although these two duplex conformations have similar values of handedness (H), it was possible to distinguish them in terms of the base-pair step parameters, slide and Zp (Fig. S2, ESI†).175–177 As noted in earlier work,176,177 A-DNA conformations typically have slide less than −0.8 Å and Zp greater than 1.5. The ribose sugars in A-DNA adopt a C3′-endo conformation, in contrast to B-DNA, where the sugars typically adopt a C2′-endo conformation.169,176 Interestingly, there are no deep subfunnels corresponding to A-DNA conformations. The organisation of the landscape further suggests that the A → B transformation is likely to be a downhill process. Our observation is consistent with previous simulations and experiments,177–182 which predict that isolated A-DNA structures are relatively destabilised under physiological conditions, and undergo spontaneous conversion to the B-DNA form. In fact, experiments show that A-DNA is likely to be favoured over B-DNA in solutions having high salt concentration or low water content,183–185 upon incorporation of specific nucleotides into the DNA sequence,186,187 or binding to specific proteins.188,189
In the intermediate energy section of the disconnectivity graph, there is a prominent subfunnel corresponding to ensembles of B–Z junctions. In these structures, the first two base-pairs adopt a Z-DNA like conformation, and the last three base-pairs adopt a B-DNA like conformation, resulting in a net handedness (H) of around 0.35. The G3 and C10 nucleobases, positioned at the boundary between the B and Z regions, are flipped out of the helix, while the rest of the nucleobases engage in WC base-pairing interactions. These structural features are consistent with the X-ray structure of a B–Z junction reported by Ha et al.98 Interestingly, recent work190 suggests that base extrusion may not be limited to B–Z junctions alone, but may be a generic feature of any junction involving Z-DNA. Several studies98,113,114 postulate that B–Z junctions are likely to be key intermediates along the B → Z transformation pathway.
Ensembles corresponding to stretched DNA structures are located in the high energy regions of the landscape, and have relatively low equilibrium occupation probabilities at 298 K. In these structures, the DNA helix strands are unwound significantly, resulting in large end-to-end distances between the strand terminals and a handedness (H) value close to zero. It is worth noting that despite some similarities, the stretched DNA structures that we observe are different from the putative S-DNA state that forms during overstretching. The general consensus is that S-DNA exhibits a ladder-like structure, and has WC base-pairs throughout the length of the duplex.191,192 In contrast, the nucleobases in the stretched DNA structures do not retain any of the canonical base-pairs, although a variable number of stacking interactions are present. This structural feature is clearly evident when the disconnectivity graph is coloured according to the number of native contacts (Fig. S3, ESI†). Several existing models94,95 suggest that the emergence of such stretched DNA structures is a natural requirement for resolving the ‘chain sense’ paradox associated with the B → Z transition.44
Within the Z-DNA funnel, there are ensembles of left-handed structures that do not exhibit the characteristic zig-zag pattern in the phosphate backbone. The chain topology resembles that of a canonical B-DNA duplex, with a narrower minor groove and a wider major groove. Unlike Z-DNA, both the guanine and cytosine nucleobases adopt anti orientations about the χ torsion angle. In addition, the GC and CG steps in these left-handed structures are associated with similar values of helical twist, in contrast to Z-DNA, where the corresponding distribution is bimodal. Although the possibility of left-handed B-DNA structures was discussed in the context of the RL model by Sasisekharan and coworkers in the late 1970s,193–195 to the best of our knowledge, no computational study has investigated their structural and dynamical properties at the all-atom level.
Mechanisms for conformational transformations
Mechanistic insight into the conformational transformations between various DNA structures is obtained in terms of the pathways that make the largest contributions to the phenomenological rate constant. As outlined in the Methods section, these pathways were extracted from the stationary point databases (kinetic transition network) using Dijkstra's shortest path algorithm128,142 and recursive enumeration,148,149 with appropriate edge weights.40,41Transformation from B-DNA to Z-DNA
There are two distinct mechanisms for the B → Z conformational transformation (Fig. 4), involving either the formation of stretched DNA structures (pathway P1) or a BZ-junction (pathway P2). The mechanisms are easily distinguished in terms of key structural order parameters (Fig. 5). The evolution of the radius of gyration (Rg) indicates that the helix unwinds significantly along pathway P1, with concomitant loss of nearly all the WC base-pairing interactions. The helix strands subsequently rewind to form the Z-DNA structure. The change in Rg is smaller for pathway P2, with most of the intermediates being relatively compact, compared to the structures observed along pathway P1, and retaining some of the WC base-pairing interactions. The order in which the different guanine bases undergo anti → syn flips about the χ torsion angle also reveals some contrasting features. Along pathway P1, the central guanines flip from the anti to the syn conformation before the guanines near the helix termini. In contrast, for pathway P2, the flipping of the terminal guanines precedes that of the central guanines. The cytosines largely maintain their anti conformation along pathway P2, but often undergo anti → syn transitions along pathway P1. | ||
| Fig. 4 Total potential energy (V) as a function of the integrated path length (s) for the B → Z pathways that make the largest contributions to the rate constant. Some representative structures encountered at different stages of the transformation are also shown. Top panel: Pathway P1, via stretched DNA structures. Bottom panel: Pathway P2, involving a B–Z junction intermediate. | ||
 | ||
| Fig. 5 (a) Evolution of the radius of gyration (Rg) along the different pathways (P1 and P2) for the B → Z transformation. (b) Evolution of the number of native contacts NHB. (c and e) Variation of the χ torsion angles for the different nucleobases along pathway P2. (d and f) Variation of the χ torsion angles along pathway P1. | ||
Some of the generic features associated with pathways P1 and P2 are similar to the stretch-collapse and zipper mechanisms, respectively, recently predicted by Sagui and coworkers.114 However, there are key differences. The stretched DNA structures observed along pathway P1 are structurally distinct from the S-DNA type intermediates (discussed in the preceding section) predicted for the stretch–collapse mechanism. In this respect, the mechanism corresponding to pathway P1 seems to be in better agreement with some of the earlier models for B → Z transition.94,95 Moreover, the order in which the guanines undergo anti → syn torsional flips along pathway P2 is more complex than the trend predicted for the zipper mechanism. The observed discrepancy may be attributed to the inherent differences in the interpretation of the free energy surface and the pathways. In our framework, the transformation mechanisms are defined geometrically in terms of interconnected steepest-descent paths in the kinetic transition network. In contrast, Sagui and coworkers114 employ adaptively biased sampling to construct a two-dimensional free energy surface. It is possible that some of the additional complexities associated with the B → Z pathways are not fully retained in the low-dimensional representation.
Although pathways P1 and P2 have nearly identical path lengths, P2 is associated with a lower enthalpic cost. Hence, at low temperatures, pathway P2 is likely to be the favoured route for the B → Z transformation. However, at high temperatures, stretched DNA structures would also have substantial thermal population, and therefore, pathway P1 is likely to compete with P2.
The organisation of the different conformational ensembles on the underlying landscape suggests that the B → Z transformation may also take place via the left-handed B-DNA state. However, in our network, these pathways do not make significant contributions to the global kinetics.
Transformation from A-DNA to B-DNA
As shown in Fig. 6, the transformation from A-DNA to B-DNA proceeds in a downhill fashion, in agreement with previous studies of the A → B conformational change using unrestrained molecular dynamics simulations.178,182 Along the pathway, there is a gradual change in the minor groove width (mGW) and the Zp parameter (Fig. 7). These global changes in the DNA helix are coupled to the repuckering of the ribose sugars, which correspond to the small barriers encountered along the pathway. The mechanistic features seem compatible with the Calladine–Drew model for the A → B transition.196 | ||
| Fig. 6 Total potential energy (V) as a function of the integrated path length (s) for the A → B pathway. Some representative structures encountered at different stages of the transformation are also shown. | ||
 | ||
| Fig. 7 (a and b) Denote the evolution of the Zp parameter, and minor groove width (mGW), respectively, along the A → B pathway. (c) Profile of pseudorotation angles (P) along the pathway denoting the repuckering of the ribose sugars. The four different stages of repuckering are also marked. Stage I: G4, C5 and G6; stage II: C1, G2 and C3; stage III: C7, G8, C9, and G10; stage IV: C11 and G12. | ||
The different puckering states can be distinguished in terms of the pseudorotation angle (P) and amplitude. For the C3′-endo conformation, the pseudorotation angle falls in the range 0°–36°, whereas it is around 144°–180° for the C2′-endo conformation.127,197,198 As evident from Fig. 7(c), not all the ribose sugars undergo the complete transition from C3′-endo to the C2′-endo puckering state. At the end of the structural transformation, the ribose sugars in the terminal guanines adopt a C1′-exo conformation, whereas in the terminal cytosines the sugars adopt the O4′-endo puckering state. Although previous work177,179 indicates that the sugars in purines and pyrimidines repucker in a specific order, we do not find any clear pattern along the pathway. Instead, we identify four different stages during which several purine and pyrimidine sugars repucker at the same time (Fig. 7(c)). Interestingly, all the nucleobases (except those at the termini) in a particular strand undergo the C3′-endo → C2′-endo transition before the repuckering process starts in the complementary strand. After each stage, approximately half of the nucleotides in a strand switch to the C2′-endo puckering state. The emergence of such composite structures during the A → B transformation is consistent with a crystallographic map predicted by Ho and coworkers.199
Transformation from left-handed B-DNA to Z-DNA
The transition from left-handed B-DNA to Z-DNA involves a switch in the chain topology of the duplex (Fig. 8). The conformational change is essentially driven by synchronised local motions in the DNA duplex, and does not require large global deformations. During the transformation, the guanine nucleobases undergo anti → syn flips about the χ torsion angle in a precise order (Fig. 9). The base-flipping transition is initiated at the G12 nucleobase, and propagates through the rest of the helix in a zig-zag fashion. These anti → syn flips are associated with barriers in the range of 6–7 kcal mol−1, and introduce kinetic bottlenecks in an otherwise downhill pathway. The magnitude of the average helical twist for the CG base-pair steps decreases gradually (Fig. 9), and by the end of the transition it fluctuates around values typical of the Z-DNA conformation. Although the variations are less perceptible in the case of GC steps, there is a net increase in the magnitude of the helical twist during the conformational transition. Besides changes in helical twist and χ torsional flips, there is also a concurrent increase in the minor groove width of the duplex. | ||
| Fig. 8 Total potential energy (V) as a function of the integrated path length (s) for the transformation from left-handed B-DNA to Z-DNA. Some representative structures encountered at different stages of the transformation are also shown. | ||
 | ||
| Fig. 9 (a and b) Illustrate the evolution of helical twists (Ω) for the GC and CG steps, and the minor groove width (mGW) respectively, for the pathway from left-handed B-DNA to Z-DNA. (c) Shows the variations in the χ torsions of the different guanine nucleobases. | ||
Conclusion
In the present work, we have provided atomistic insight into the inversion of helix-handedness in transitions from B-DNA to Z-DNA conformations. This particular conformational switch is a particularly large-scale transformation,42–44 and has been a difficult target for conventional simulation techniques. In contrast to previous efforts, we probe the B → Z transition from an energy landscape perspective, without using predefined reaction coordinates. The free energy landscape exhibits two distinct funnels leading to the B-DNA and Z-DNA conformations. In addition, we have identified A-DNA structures close to the B-DNA funnel, and left-handed B-DNA structures within the Z-DNA funnel.The inversion of handedness can occur via two competing pathways, involving either stretched DNA structures, or a B–Z junction. The generic features of the competing mechanisms are in good agreement with previous models of the B → Z transition. The topography of the landscape also indicates a clear separation of time scales. The B → Z transition is rather slow under physiological conditions. In contrast, the relaxation within the two major funnels is predicted to be orders of magnitude faster. As a result, the A-DNA and left-handed B-DNA conformations spontaneously convert to the B-DNA and Z-DNA forms, respectively, in a largely downhill and cooperative fashion. This emergent property of the landscape is consistent with previous experiments and computational studies.
We have mapped out the free energy landscape at a modest salt concentration, where B-DNA is still the dominant conformation at equilibrium. We anticipate that the landscape will be substantially different at high salt concentrations, or in the presence of multivalent ions, although the key mechanistic features of the transition pathways are likely to be preserved. Recent work200 suggests that the Hofmeister effect is likely to play an important role in stabilising the Z-DNA form under such in vitro conditions.
Besides ionic strength, an external force or torque could provide the means to exercise dynamic control over helix handedness.91,201–204 In the future, it would be interesting to investigate these intriguing aspects of the B → Z transition in terms of how the energy landscapes evolve as a function of tunable parameters.174
Acknowledgements
We are grateful to Dr Rosana Collepardo-Guevara and Dr Tristan Cragnolini for helpful discussions. The work was financially supported by the ERC. D. C. gratefully acknowledges the Cambridge Commonwealth, European and International Trust for a PhD fellowship.References
- R. L. Jaffe, J. M. Henry and J. B. Anderson, J. Am. Chem. Soc., 1976, 98, 1140–1155 CrossRef CAS.
- C. Dellago and P. G. Bolhuis, Advanced Computer Simulation Approaches for Soft Matter Sci. III, Springer, Berlin, Heidelberg, 2009, pp. 167–233 Search PubMed.
- D. Frenkel and B. Smit, Understanding Molecular Simulations, Academic Press, 2002 Search PubMed.
- J. B. Anderson, Advances in Chemical Physics, John Wiley and Sons, New York, 1995, vol. 91, pp. 381–431 Search PubMed.
- E. Vanden-Eijnden, Annu. Rev. Phys. Chem., 2010, 61, 391–420 CrossRef PubMed.
- D. J. Wales, Energy Landscapes, Cambridge University Press, U.K., 2003 Search PubMed.
- R. H. Swendsen and J.-S. Wang, Phys. Rev. Lett., 1986, 57, 2607–2609 CrossRef PubMed.
- D. J. Earl and M. W. Deem, Phys. Chem. Chem. Phys., 2005, 7, 3910–3916 RSC.
- Y. Sugita and Y. Okamoto, Chem. Phys. Lett., 1999, 314, 141–151 CrossRef CAS.
- U. H. E. Hansmann and Y. Okamoto, Curr. Opin. Struct. Biol., 1999, 9, 177–183 CrossRef CAS PubMed.
- F. Wang and D. P. Landau, Phys. Rev. Lett., 2001, 86, 2050–2053 CrossRef CAS PubMed.
- G. M. Torrie and J. P. Valleau, J. Comput. Phys., 1977, 23, 187–199 CrossRef.
- J. Kästner, Wiley Interdiscip. Rev.: Comput. Mol. Sci., 2011, 1, 932–942 CrossRef.
- A. Barducci, M. Bonomi and M. Parrinello, Wiley Interdiscip. Rev.: Comput. Mol. Sci., 2011, 1, 826–843 CrossRef CAS.
- A. Laio and F. L. Gervasio, Rep. Prog. Phys., 2008, 71, 126601 CrossRef.
- J. R. Gullingsrud, R. Braun and K. Schulten, J. Comput. Phys., 1999, 151, 190–211 CrossRef CAS.
- P. Ferrara, J. Apostolakis and A. Caflisch, J. Phys. Chem. B, 2000, 104, 4511–4518 CrossRef CAS.
- H. Grubmüller, Phys. Rev. E: Stat. Phys., Plasmas, Fluids, Relat. Interdiscip. Top., 1995, 52, 2893–2906 CrossRef.
- E. A. Carter, G. Ciccotti, J. T. Hynes and R. Kapral, Chem. Phys. Lett., 1989, 156, 472–477 CrossRef CAS.
- M. Sprik and G. Ciccotti, J. Chem. Phys., 1998, 109, 7737–7744 CrossRef CAS.
- A. F. Voter, Phys. Rev. Lett., 1997, 78, 3908–3911 CrossRef CAS.
- A. F. Voter, J. Chem. Phys., 1997, 106, 4665–4677 CrossRef CAS.
- D. Hamelberg, J. Mongan and J. A. McCammon, J. Chem. Phys., 2004, 120, 11919–11929 CrossRef CAS PubMed.
- Y. Miao, F. Feixas, C. Eun and J. A. McCammon, J. Comput. Chem., 2015, 36, 1536–1549 CrossRef CAS PubMed.
- S. V. Krivov and M. Karplus, Proc. Natl. Acad. Sci. U. S. A., 2004, 101, 14766–14770 CrossRef CAS PubMed.
- D. J. Wales, J. Chem. Phys., 2015, 142, 130901 CrossRef CAS PubMed.
- P. G. Bolhuis, D. Chandler, C. Dellago and P. L. Geissler, Annu. Rev. Phys. Chem., 2002, 53, 291–318 CrossRef CAS PubMed.
- C. Dellago, P. G. Bolhuis and D. Chandler, J. Chem. Phys., 1998, 108, 9236–9245 CrossRef CAS.
- T. S. van Erp, D. Moroni and P. G. Bolhuis, J. Chem. Phys., 2003, 118, 7762–7774 CrossRef CAS.
- T. S. van Erp and P. G. Bolhuis, J. Comput. Phys., 2005, 205, 157–181 CrossRef.
- A. K. Faradjian and R. Elber, J. Chem. Phys., 2004, 120, 10880–10889 CrossRef CAS PubMed.
- P. Májek and R. Elber, J. Chem. Theory Comput., 2010, 6, 1805–1817 CrossRef PubMed.
- E. Vanden-Eijnden, M. Venturoli, G. Ciccotti and R. Elber, J. Chem. Phys., 2008, 129, 174102 CrossRef PubMed.
- R. J. Allen, C. Valeriani and P. R. ten Wolde, J. Phys.: Condens. Matter, 2009, 21, 463102 CrossRef PubMed.
- R. J. Allen, P. B. Warren and P. R. ten Wolde, Phys. Rev. Lett., 2005, 94, 018104 CrossRef PubMed.
- D. J. Wales, Curr. Opin. Struct. Biol., 2010, 20, 3–10 CrossRef CAS PubMed.
- F. Noe and S. Fischer, Curr. Opin. Struct. Biol., 2008, 18, 154–162 CrossRef CAS PubMed.
- V. S. Pande, K. Beauchamp and G. R. Bowman, Methods, 2010, 52, 99–105 CrossRef CAS PubMed.
- J. D. Chodera and F. Noe, Curr. Opin. Struct. Biol., 2014, 25, 135–144 CrossRef CAS PubMed.
- D. J. Wales, Mol. Phys., 2002, 100, 3285–3305 CrossRef CAS.
- D. J. Wales, Mol. Phys., 2004, 102, 891–908 CrossRef CAS.
- T. M. Jovin, D. M. Soumpasis and L. P. McIntosh, Annu. Rev. Phys. Chem., 1987, 38, 521–558 CrossRef CAS.
- A. Rich, A. Nordheim and A. H. J. Wang, Annu. Rev. Biochem., 1984, 53, 791–846 CrossRef CAS PubMed.
- M. A. Fuertes, V. Cepeda, C. Alonso and J. M. Pérez, Chem. Rev., 2006, 106, 2045–2064 CrossRef CAS PubMed.
- F. M. Pohl and T. M. Jovin, J. Mol. Biol., 1972, 67, 375–396 CrossRef CAS PubMed.
- A. H.-J. Wang, G. J. Quigley, F. J. Kolpak, J. L. Crawford, J. H. van Boom, G. van der Marel and A. Rich, Nature, 1979, 282, 680–686 CrossRef CAS PubMed.
- T. J. Thamann, R. C. Lord, A. H. Wang and A. Rich, Nucleic Acids Res., 1981, 9, 5443–5457 CrossRef CAS PubMed.
- A. Nordheim and A. Rich, Proc. Natl. Acad. Sci. U. S. A., 1983, 80, 1821–1825 CrossRef CAS.
- H. Hamada and T. Kakunaga, Nature, 1982, 298, 396–398 CrossRef CAS PubMed.
- M. J. McLean, J. W. Lee and R. D. Wells, J. Biol. Chem., 1988, 263, 7378–7385 CAS.
- A. H. J. Wang, R. V. Gessner, G. A. van der Marel, J. H. van Boom and A. Rich, Proc. Natl. Acad. Sci. U. S. A., 1985, 82, 3611–3615 CrossRef CAS.
- J. Feigon, A. H. J. Wang, G. A. van der Marel, J. H. van Boom and A. Rich, Science, 1985, 230, 82–84 CAS.
- A. Herbert and A. Rich, in Left-Handed Z-DNA: Structure and Function, ed. E. M. Bradbury and S. Pongor, Springer, Netherlands, Dordrecht, 1999, pp. 53–72 Search PubMed.
- A. Rich and S. Zhang, Nat. Rev. Genet., 2003, 4, 566–572 CrossRef CAS PubMed.
- A. Jaworski, W. Zacharias, W.-T. Hsieh, J. A. Blaho, J. E. Larson and R. D. Wells, Gene, 1988, 74, 215–220 CrossRef CAS PubMed.
- A. Jaworski, W. T. Hsieh, J. A. Blaho, J. E. Larson and R. D. Wells, Science, 1987, 238, 773–777 CAS.
- G. Kolata, Science, 1983, 222, 495–496 CAS.
- R. Liu, H. Liu, X. Chen, M. Kirby, P. O. Brown and K. Zhao, Cell, 2001, 106, 309–318 CrossRef CAS PubMed.
- G. Wang, L. A. Christensen and K. M. Vasquez, Proc. Natl. Acad. Sci. U. S. A., 2006, 103, 2677–2682 CrossRef CAS PubMed.
- A. Suram, J. K. S. Rao, K. S. Latha and M. A. Viswamitra, NeuroMol. Med., 2002, 2, 289–297 CrossRef CAS.
- J. Geng, C. Zhao, J. Ren and X. Qu, Chem. Commun., 2010, 46, 7187–7189 RSC.
- P. Vasudevaraju, Bharathi, R. M. Garruto, K. Sambamurti and K. S. J. Rao, Brain Res. Rev., 2008, 58, 136–148 CrossRef CAS PubMed.
- M. Guéron, J. Demaret and M. Filoche, Biophys. J., 2000, 78, 1070–1083 CrossRef.
- M. Behe and G. Felsenfeld, Proc. Natl. Acad. Sci. U. S. A., 1981, 78, 1619–1623 CrossRef CAS.
- W. Zacharias, A. Jaworski and R. D. Wells, J. Bacteriol., 1990, 172, 3278–3283 CrossRef CAS PubMed.
- Y. Xu, R. Ikeda and H. Sugiyama, J. Am. Chem. Soc., 2003, 125, 13519–13524 CrossRef CAS PubMed.
- F. Azorin, A. Nordheim and A. Rich, EMBO J., 1983, 2, 649–655 CAS.
- A. Nordheim and A. Rich, Proc. Natl. Acad. Sci. U. S. A., 1983, 80, 1821–1825 CrossRef CAS.
- A. Nordheim, E. M. Lafer, L. J. Peck, J. C. Wang, B. David Stollar and A. Rich, Cell, 1982, 31, 309–318 CrossRef CAS PubMed.
- H. Takeuchi, N. Hanamura and I. Harada, J. Mol. Biol., 1994, 236, 610–617 CrossRef CAS PubMed.
- T. Schwartz, J. Behlke, K. Lowenhaupt, U. Heinemann and A. Rich, Nat. Struct. Mol. Biol., 2001, 8, 761–765 CAS.
- T. J. Thomas and T. Thomas, Biochem. J., 1994, 298, 485–491 CrossRef CAS PubMed.
- B. Hiraks, P. Malgorzata, G. Burt and J. Laurence, Anticancer Res., 1996, 16, 39–48 Search PubMed.
- H. Ohishi, M. Odoko, K. Grzeskowiak, Y. Hiyama, K. Tsukamoto, N. Maezaki, T. Ishida, T. Tanaka, N. Okabe, K. Fukuyama, D.-Y. Zhou and K. Nakatani, Biochem. Biophys. Res. Commun., 2008, 366, 275–280 CrossRef CAS PubMed.
- M. L. Howell, G. P. Schroth and P. S. Ho, Biochemistry, 1996, 35, 15373–15382 CrossRef CAS PubMed.
- T. Schwartz, J. Behlke, K. Lowenhaupt, U. Heinemann and A. Rich, Nat. Struct. Mol. Biol., 2001, 8, 761–765 CAS.
- D. Bancroft, L. D. Williams, A. Rich and M. Egli, Biochemistry, 1994, 33, 1073–1086 CrossRef CAS PubMed.
- B. Spingler, Inorg. Chem., 2005, 44, 831–833 CrossRef CAS PubMed.
- B. Spingler and C. D. Pieve, Dalton Trans., 2005, 1637–1643 RSC.
- R. D. Sheardy, N. Levine, S. Marotta, D. Suh and J. B. Chaires, Biochemistry, 1994, 33, 1385–1391 CrossRef CAS PubMed.
- J. Kypr, I. Kejnovská, D. Renčiuk and M. Vorlíčková, Nucleic Acids Res., 2009, 37, 1713–1725 CrossRef CAS PubMed.
- V. González, M. A. Fuertes and J. M. Pérez, Eur. Biophys. J., 1998, 27, 417–423 CrossRef.
- D. E. Callahan and T. M. Hooker, Biopolymers, 1987, 26, 457–461 CrossRef CAS PubMed.
- J. Feigon, A. H. Wang, G. A. van der Marel, J. H. van Boom and A. Rich, Nucleic Acids Res., 1984, 12, 1243–1263 CrossRef CAS PubMed.
- D. J. Patel, S. A. Kozlowski, A. Nordheim and A. Rich, Proc. Natl. Acad. Sci. U. S. A., 1982, 79, 1413–1417 CrossRef CAS.
- C. Giessner-Prettre, B. Pullman, S. Tran-Dinh, J. M. Neumann, T. Huynh-Dinh and J. Igolen, Nucleic Acids Res., 1984, 12, 3272–3281 CrossRef.
- Y.-M. Kang, J. Bang, E.-H. Lee, H.-C. Ahn, Y.-J. Seo, K. K. Kim, Y.-G. Kim, B.-S. Choi and J.-H. Lee, J. Am. Chem. Soc., 2009, 131, 11485–11491 CrossRef CAS PubMed.
- T. A. Holak, P. N. Borer, G. C. Levy, J. H. van Boom and A. H. J. Wang, Nucleic Acids Res., 1984, 12, 4625–4635 CrossRef CAS PubMed.
- E. A. Jares-Erijman and T. M. Jovin, J. Mol. Biol., 1996, 257, 597–617 CrossRef CAS PubMed.
- B. Dumat, A. F. Larsen and L. M. Wihelmsson, Nucleic Acids Res., 2016, 44, e101 CrossRef PubMed.
- M. Lee, S. H. Kim and S.-C. Hong, Proc. Natl. Acad. Sci. U. S. A., 2010, 107, 4985–4990 CrossRef CAS PubMed.
- S. Harvey, Nucleic Acids Res., 1983, 11, 4867–4878 CrossRef CAS PubMed.
- W. Saenger and U. Heinemann, FEBS Lett., 1989, 257, 223–227 CrossRef CAS PubMed.
- W. Lim and Y. P. Feng, Biopolymers, 2005, 78, 107–120 CrossRef CAS PubMed.
- W. Lim and Y. P. Feng, Biophys. J., 2005, 88, 1593–1607 CrossRef CAS PubMed.
- P. S. Ho, Proc. Natl. Acad. Sci. U. S. A., 1994, 91, 9549–9553 CrossRef CAS.
- L. J. Peck and J. Wang, Proc. Natl. Acad. Sci. U. S. A., 1983, 80, 6206–6210 CrossRef CAS.
- S. C. Ha, K. Lowenhaupt, A. Rich, Y.-G. Kim and K. K. Kim, Nature, 2005, 437, 1183–1186 CrossRef CAS PubMed.
- P. Kollman, P. Weiner, G. Quigley and A. Wang, Biopolymers, 1982, 21, 1945–1969 CrossRef CAS PubMed.
- V. K. Misra and B. Honig, Biochemistry, 1996, 35, 1115–1124 CrossRef CAS PubMed.
- M. Guéron, J. Demaret and M. Filoche, Biophys. J., 2000, 78, 1070–1083 CrossRef.
- F. Hirata and R. Levy, J. Phys. Chem., 1989, 93, 479–484 CrossRef CAS.
- J. C. G. Montoro and J. L. F. Abascal, J. Chem. Phys., 1997, 106, 8239–8253 CrossRef CAS.
- J. C. G. Montoro and J. L. F. Abascal, Europhys. Lett., 1996, 34, 471–476 CrossRef CAS.
- J. C. G. Montoro and J. L. F. Abascal, Mol. Phys., 2004, 102, 2141–2148 CrossRef.
- J. T. Berryman and T. Schilling, J. Chem. Theory Comput., 2013, 9, 679–686 CrossRef CAS PubMed.
- T. Miyahara, H. Nakatsuji and H. Sugiyama, J. Phys. Chem. A, 2013, 117, 42–55 CrossRef CAS PubMed.
- T. Miyahara and H. Nakatsuji, J. Phys. Chem. A, 2015, 119, 8269–8278 CrossRef CAS PubMed.
- W. Lim, Phys. Rev. E: Stat., Nonlinear, Soft Matter Phys., 2007, 75, 031918 CrossRef PubMed.
- J. Maji and S. M. Bhattacharjee, Europhys. Lett., 2010, 92, 58004 CrossRef.
- R. Elber, A. Ghosh and A. Cárdenas, in The Stochastic Difference Equation as a Tool to Compute Long Time Dynamics, ed. P. Nielaba, M. Mareschal and G. Ciccotti, Springer, Berlin, Heidelberg, 2002, pp. 335-365 Search PubMed.
- M. A. Kastenholz, T. U. Schwartz and P. H. Hünenberger, Biophys. J., 2006, 91, 2976–2990 CrossRef CAS PubMed.
- J. Lee, Y.-G. Kim, K. K. Kim and C. Seok, J. Phys. Chem. B, 2010, 114, 9872–9881 CrossRef CAS PubMed.
- M. Moradi, V. Babin, C. Roland and C. Sagui, Nucleic Acids Res., 2013, 41, 33–43 CrossRef CAS PubMed.
- K. Brzezinski, A. Brzuszkiewicz, M. Dauter, M. Kubicki, M. Jaskolski and Z. Dauter, Nucleic Acids Res., 2011, 39, 6238–6248 CrossRef CAS PubMed.
- D. A. Case, T. A. Darden, T. Cheatham, C. L. Simmerling, J. Wang, R. E. Duke, R. Luo, R. C. Walker, W. Zhang, K. M. Merz, B. Roberts, S. Hayik, A. Roitberg, G. Seabra, J. Swails, A. W. Goetz and I. Kolossváry, AMBER 12, 2012, http://ambermd.org/.
- A. Pérez, I. Marchán, D. Svozil, J. Šponer, T. E. Cheatham, C. A. Laughton and M. Orozco, Biophys. J., 2007, 92, 3817–3829 CrossRef PubMed.
- M. Zgarbová, F. J. Luque, J. Šponer, T. E. Cheatham III, M. Otyepka and P. Jurečka, J. Chem. Theory Comput., 2013, 9, 2339–2354 CrossRef PubMed.
- E. Malolepsza, B. Strodel, M. Khalili, S. Trygubenko, S. N. Fejer and D. J. Wales, J. Comput. Chem., 2010, 31, 1402–1409 CAS.
- A. Onufriev, D. Bashford and D. A. Case, Proteins, 2004, 55, 383–394 CrossRef CAS PubMed.
- A. Onufriev, D. Bashford and D. A. Case, J. Phys. Chem. B, 2000, 104, 3712–3720 CrossRef CAS.
- J. Srinivasan, M. W. Trevathan, P. Beroza and D. A. Case, Theor. Chem. Acc., 1999, 101, 426–434 CrossRef CAS.
- S. Joung and T. E. Cheatham, J. Phys. Chem. B, 2008, 112, 9020–9041 CrossRef PubMed.
- U. Essmann, L. Perera, M. L. Berkowitz, T. Darden, H. Lee and L. G. Pedersen, J. Chem. Phys., 1995, 103, 8577–8593 CrossRef CAS.
- J. P. Ryckaert, G. Ciccotti and H. J. C. Berendsen, J. Comput. Phys., 1977, 23, 327–341 CrossRef CAS.
- R. J. Loncharich, B. R. Brooks and R. W. Pastor, Biopolymers, 1992, 32, 523–535 CrossRef CAS PubMed.
- X. J. Lu and W. K. Olson, Nucleic Acids Res., 2003, 17, 5108–5121 CrossRef.
- D. E. Evans and D. J. Wales, J. Chem. Phys., 2004, 121, 1080–1090 CrossRef CAS PubMed.
- J. M. Carr and D. J. Wales, J. Phys. Chem. B, 2008, 112, 8760–8769 CrossRef CAS PubMed.
- J. D. Farrell, C. Lines, J. J. Shepherd, D. Chakrabarti, M. A. Miller and D. J. Wales, Soft Matter, 2013, 9, 5407–5416 RSC.
- D. Chakraborty, N. Sengupta and D. J. Wales, J. Phys. Chem. B, 2016, 120, 4331–4340 CrossRef CAS PubMed.
- S. Somani and D. J. Wales, J. Chem. Phys., 2013, 139, 121909 CrossRef PubMed.
- J. N. Murrell and K. J. Laidler, Trans. Faraday Soc., 1968, 64, 371–377 RSC.
- D. J. Wales, OPTIM: A program for optimising geometries and calculating pathways, http://www-wales.ch.cam.ac.uk/software.html.
- D. A. Case, T. A. Darden, T. Cheatham, C. L. Simmerling, J. Wang, R. E. Duke, R. Luo, R. C. Walker, W. Zhang, K. M. Merz, B. Roberts, S. Hayik, A. Roitberg, G. Seabra, J. Swails, A. W. Goetz and I. Kolossváry, AMBER 9, 2006, http://ambermd.org/.
- D. Liu and J. Nocedal, Math. Program., 1989, 45, 503–528 CrossRef.
- S. A. Trygubenko and D. J. Wales, J. Chem. Phys., 2004, 120, 2082–2094 CrossRef CAS PubMed.
- G. Henkelman and H. Jònsson, J. Chem. Phys., 1999, 111, 7010–7022 CrossRef CAS.
- G. Henkelman, B. P. Uberuaga and H. Jònsson, J. Chem. Phys., 2000, 113, 9901–9904 CrossRef CAS.
- Y. Zheng, P. Xiao and G. Henkelman, J. Chem. Phys., 2014, 140, 044115 CrossRef PubMed.
- L. J. Munro and D. J. Wales, Phys. Rev. B: Condens. Matter Mater. Phys., 1999, 59, 3969–3980 CrossRef CAS.
- E. W. Dijkstra, Numer. Math., 1959, 1, 269–271 CrossRef.
- J. M. Carr, S. Trygubenko and D. J. Wales, J. Chem. Phys., 2005, 122, 234903 CrossRef PubMed.
- D. J. Wales, PATHSAMPLE: A program for generating connected stationary point databases and extracting global kinetics, http://www-wales.ch.cam.ac.uk/software.html.
- B. Strodel, C. W. Whittleston and D. J. Wales, J. Am. Chem. Soc., 2007, 129, 16005–16014 CrossRef CAS PubMed.
- M. S. Bauer, B. Strodel, S. N. Fejer, E. Koslover and D. J. Wales, J. Chem. Phys., 2010, 132, 054101 CrossRef PubMed.
- D. J. Wales and J. M. Carr, J. Chem. Theory Comput., 2012, 8, 5020–5034 CrossRef CAS PubMed.
- J. M. Carr and D. J. Wales, in The Energy Landscape as a Computational Tool, ed. J. P. Connerade and A. Solov'yov, Imperial College Press, London, 2008, pp. 321-330 Search PubMed.
- J. Jimènez and A. Marzal, in Algorithm Engineering: 3rd International Workshop, WAE'99, London, UK, July 1999, Springer, Berlin, 1999, pp. 15–29.
- B. Strodel and D. J. Wales, Chem. Phys. Lett., 2008, 466, 105–115 CrossRef CAS.
- M. R. Hoare and J. J. McInnes, Faraday Discuss. Chem. Soc., 1976, 61, 12–24 RSC.
- M. R. Hoare, Advances in Chemical Physics, John Wiley and Sons, USA, 1979, vol. 40, pp. 49-129 Search PubMed.
- D. J. Wales and P. Salamon, Proc. Natl. Acad. Sci. U. S. A., 2014, 111, 617–622 CrossRef CAS PubMed.
- O. M. Becker and M. Karplus, J. Chem. Phys., 1997, 106, 1495–1517 CrossRef CAS.
- S. V. Krivov and M. Karplus, J. Chem. Phys., 2002, 117, 10894–10903 CrossRef CAS.
- D. A. Evans and D. J. Wales, J. Chem. Phys., 2003, 118, 3891–3897 CrossRef CAS.
- D. J. Wales, M. A. Miller and T. R. Walsh, Nature, 1998, 394, 758–760 CrossRef CAS.
- M. Zgarbová, M. Otyepka, J. Šponer, F. Lankaš and P. Jurečka, J. Chem. Theory Comput., 2014, 10, 3177–3189 CrossRef PubMed.
- T. Dršata, A. Pérez, M. Orozco, A. V. Morozov, J. Šponer and F. Lankaš, J. Chem. Theory Comput., 2013, 9, 707–721 CrossRef PubMed.
- A. Pérez, F. J. Luque and M. Orozco, J. Am. Chem. Soc., 2007, 129, 14739–14745 CrossRef PubMed.
- P. D. Dans, L. Danilane, I. Ivani, T. Dršata, F. Lankaš, A. Hospital, J. Walther, R. I. Pujagut, F. Battistini, J. L. Gelpí, R. Lavery and M. Orozco, Nucleic Acids Res., 2016, 44, 4052–4066 CrossRef CAS PubMed.
- J. L. Leroy, M. Kochoyan, T. Huynh-Dinh and M. Guéron, J. Mol. Biol., 1988, 200, 223–238 CrossRef CAS PubMed.
- D. Andreatta, S. Sen, J. L. P. Lustres, S. A. Kovalenko, N. P. Ernsting, C. J. Murphy, R. S. Coleman and M. A. Berg, J. Am. Chem. Soc., 2006, 128, 6885–6892 CrossRef CAS PubMed.
- N. B. Leontis, J. Stombaugh and E. Westhof, Nucleic Acids Res., 2002, 30, 3497–3531 CrossRef CAS PubMed.
- I. Ivani, P. D. Dans, A. Noy, A. Perez, I. Faustino, A. Hospital, J. Walther, P. Andrio, R. Goni, A. Balaceanu, G. Portella, F. Battistini, J. L. Gelpi, C. Gonzalez, M. Vendruscolo, C. A. Laughton, S. A. Harris, D. A. Case and M. Orozco, Nat. Methods, 2016, 13, 55–58 CAS.
- K. K. Irikura, B. Tidor, B. R. Brooks and M. Karplus, Science, 1985, 229, 571–572 CAS.
- R. Malathi and N. Yathindra, J. Biosci., 1985, 8, 615–625 CrossRef CAS.
- N. A. Temiz, D. E. Donohue, A. Bacolla, B. T. Luke and J. R. Collins, PLoS One, 2012, 7, 1–9 Search PubMed.
- W. Saenger, Principles of Nucleic Acid Structure, Springer-Verlag, 1984 Search PubMed.
- R. E. Dickerson, H. R. Drew, B. N. Conner, R. M. Wing, A. V. Fratini and M. L. Kopka, Science, 1982, 216, 475–485 CAS.
- R. Lavery, K. Zakrzewska, D. Beveridge, T. C. Bishop, D. A. Case, T. Cheatham, S. Dixit, B. Jayaram, F. Lankas, C. Laughton, J. H. Maddocks, A. Michon, R. Osman, M. Orozco, A. Perez, T. Singh, N. Spackova and J. Sponer, Nucleic Acids Res., 2010, 38, 299–313 CrossRef CAS PubMed.
- M. Pasi, J. H. Maddocks, D. Beveridge, T. C. Bishop, D. A. Case, T. Cheatham, P. D. Dans, B. Jayaram, F. Lankas, C. Laughton, J. Mitchell, R. Osman, M. Orozco, A. Perez, D. Petkeviciute, N. Spackova, J. Sponer, K. Zakrzewska and R. Lavery, Nucleic Acids Res., 2014, 42, 12272–12283 CrossRef CAS PubMed.
- M. Moradi, V. Babin, C. Roland, T. Darden and C. Sagui, Proc. Natl. Acad. Sci. U. S. A., 2009, 106, 20746–20751 CrossRef CAS PubMed.
- D. J. Wales and T. Head-Gordon, J. Phys. Chem. B, 2012, 116, 8394–8411 CrossRef CAS PubMed.
- M. A. E. Hassan and C. R. Calladine, J. Mol. Biol., 1998, 282, 331–343 CrossRef PubMed.
- X. J. Lu, Z. Shakked and W. K. Olson, J. Mol. Biol., 2000, 300, 819–840 CrossRef CAS PubMed.
- N. K. Banavali and B. Roux, J. Am. Chem. Soc., 2005, 127, 6866–6876 CrossRef CAS PubMed.
- T. E. Cheatham and P. Kollman, J. Mol. Biol., 1996, 259, 434–444 CrossRef CAS PubMed.
- A. Noy, A. Pérez, C. A. Laughton and M. Orozco, Nucleic Acids Res., 2007, 35, 3330–3338 CrossRef CAS PubMed.
- D. Sprous, M. A. Young and D. L. Beveridge, J. Phys. Chem. B, 1998, 102, 4658–4667 CrossRef CAS.
- K. M. Knee, S. B. Dixit, C. E. Aitken, S. Ponomarev, D. L. Beveridge and I. Mukerji, Biophys. J., 2008, 95, 257–272 CrossRef CAS PubMed.
- L. Yang and B. M. Pettitt, J. Phys. Chem., 1996, 100, 2564–2566 CrossRef CAS.
- R. E. Franklin and R. G. Grosling, Acta Crystallogr., 1953, 6, 673–677 CrossRef CAS.
- I. V. Ivanov and D. Y. Krylov, Methods Enzymol., 1992, 211, 111–127 Search PubMed.
- S. B. Zimmerman and B. H. Pheiffer, J. Mol. Biol., 1979, 135, 1023–1027 CrossRef CAS PubMed.
- D. Ding, S. Grayaznov, D. H. Lloyd, S. Chandrasekaran, S. Yao, L. Ratmeyer, Y. Pan and W. D. Wilson, Nucleic Acids Res., 1996, 24, 354–360 CrossRef CAS PubMed.
- V. Tereshko, S. Gryaznov and M. Egli, J. Am. Chem. Soc., 1998, 120, 269–283 CrossRef CAS.
- W. A. Wlassoff, G. M. Dymshits and I. O. Lavrik, FEBS Lett., 1996, 390, 6–9 CrossRef CAS PubMed.
- J. Kiefer, C. Mao, J. C. Braman and L. S. Beese, Nature, 1998, 391, 304–307 CrossRef CAS PubMed.
- D. Kim, S. Reddy, D. Y. Kim, A. Rich, S. Lee, K. K. Kim and Y.-G. Kim, Nucleic Acids Res., 2009, 37, 4353–4359 CrossRef CAS PubMed.
- P. Cluzel, A. Lebrun, C. Heller, J. L. Vivoy and F. Caron, Science, 1996, 271, 792–794 CAS.
- N. Bosaeus, A. H. El-Sagheer, T. Brown, S. B. Smith, B. Åkerman, C. Bustamante and B. Nordén, Proc. Natl. Acad. Sci. U. S. A., 2012, 109, 15179–15184 CrossRef CAS PubMed.
- V. Sasisekharan and N. Pattabiraman, Curr. Sci., 1976, 45, 779–783 CAS.
- G. Gupta, M. Bansal and V. Sasisekharan, Proc. Natl. Acad. Sci. U. S. A., 1980, 77, 6486–6490 CrossRef CAS.
- N. Ramaswamy, M. Bansal, G. Gupta and V. Sasisekharan, Proc. Natl. Acad. Sci. U. S. A., 1982, 79, 6109–6113 CrossRef CAS.
- C. R. Calladine and H. R. Drew, J. Mol. Biol., 1984, 178, 773–782 CrossRef CAS PubMed.
- C. Altona and M. Sundaralingam, J. Am. Chem. Soc., 1972, 94, 8205–8212 CrossRef CAS PubMed.
- D. Cremer and J. A. Pople, J. Am. Chem. Soc., 1975, 97, 1354–1358 CrossRef CAS.
- J. M. Vargason, K. Henderson and P. S. Ho, Proc. Natl. Acad. Sci. U. S. A., 2001, 98, 7265–7270 CrossRef CAS PubMed.
- S. Bae, H. Son, Y.-G. Kim and S. Hohng, Phys. Chem. Chem. Phys., 2013, 15, 15829–15832 RSC.
- A. Y. Kwon, G. M. Nam, A. Johner, S. Kim, S. C. Hong and N. K. Lee, Phys. Rev. E: Stat., Nonlinear, Soft Matter Phys., 2016, 93, 022411 CrossRef PubMed.
- T. Okushima and H. Kuratsuji, Phys. Rev. E: Stat., Nonlinear, Soft Matter Phys., 2011, 84, 021926 CrossRef PubMed.
- T. Okushima and H. Kuratsuji, Phys. Rev. E: Stat., Nonlinear, Soft Matter Phys., 2012, 86, 041905 CrossRef PubMed.
- A.-Y. Kwon, N.-K. Lee, S.-C. Hong, J. Fierling and A. Johner, Biophys. J., 2015, 108, 2562–2572 CrossRef CAS PubMed.
Footnote |
| † Electronic supplementary information (ESI) available: Figure showing the diverse range of base-pairing interactions at the helix termini for the B-DNA ensemble, free energy disconnectivity graph coloured according to the number of native contacts, plot of slide vs. Zp for distinguishing between the B-DNA and A-DNA structures. See DOI: 10.1039/c6cp06309h |
| This journal is © the Owner Societies 2017 |