 Open Access Article
Creative Commons Attribution 3.0 Unported Licence
Principal molecular axis and transition dipole moment orientations in liquid crystal systems: an assessment based on studies of guest anthraquinone dyes in a nematic host†
Mark T.
Sims
,
Laurence C.
Abbott
,
Stephen J.
Cowling
,
John W.
Goodby
and
John N.
Moore
*
Department of Chemistry, University of York, Heslington, York YO10 5DD, UK. E-mail: john.moore@york.ac.uk
First published on 8th December 2016
Abstract
An assessment of five different definitions of the principal molecular axis along which molecules align in a nematic liquid crystal system has been made by analysing fully atomistic molecular dynamics (MD) simulations of a set of anthraquinone dyes in the cyanobiphenyl-based nematic host mixture E7. Principal molecular axes of the dyes defined by minimum moment of inertia, minimum circumference, minimum area, maximum aspect ratio, and surface tensor models were tested, and the surface tensor model was found to give the best description. Analyses of MD simulations of E7 alone showed that the surface tensor model also gave a good description of the principal molecular axes of the host molecules, suggesting that this model may be applicable more generally. Calculated dichroic order parameters of the guest–host systems were obtained by combining the surface tensor analysis with fixed transition dipole moment (TDM) orientations from time-dependent density functional theory (TD-DFT) calculations on optimised structures of the dyes, and the trend between the dyes generally matched the trend in the experimental values. Additional analyses of the guest–host simulations identified the range of conformers explored by the flexible chromophores within the dyes, and TD-DFT calculations on corresponding model structures showed that this flexibility has a significant effect on the TDM orientations within the molecular frames. Calculated dichroic order parameters that included the effects of this flexibility gave a significantly improved match with the experimental values for the more flexible dyes. Overall, the surface tensor model has been shown to provide a rationale for the experimental alignment trends that is based on molecular shape, and molecular flexibility within the chromophores has been shown to be significant for the guest–host systems: the computational approaches reported here may be used as a general aid in the predictive design of dyes with appropriate molecular shapes and flexibilities for guest–host applications.
Introduction
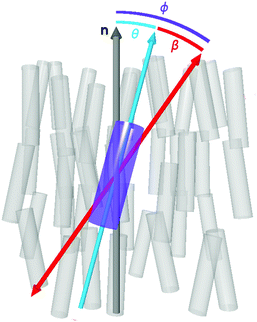
Molecular alignment and its characterisation is a key aspect in the study of liquid-crystalline phases, not only to understand the nature of molecular ordering but also because this alignment typically underlies the many applications of liquid-crystalline materials. In guest–host systems, the ordered nature of a liquid crystal host is used to induce the bulk alignment of anisotropic guest molecules, which may not themselves exhibit ordered mesophases. Dyes are often used as the guest molecules in such systems to provide optically anisotropic mixtures, for which a wide variety of applications have been proposed.1,2 Most prominently, guest–host systems have been investigated for applications in display devices that can provide higher optical and energy efficiency than conventional LCD devices, along with the ability to operate in light-scattering modes in sheltered environments or outdoors.3 In addition, guest–host systems have been suggested for a diverse range of other applications that include precursors for high performance thin-film polarizers,4 optical storage devices utilising photochemical dye isomerisation,5 optically controlled diffraction gratings,6 security devices,7 switchable windows using fluorescent guest molecules to collect solar energy,8 and 3D imaging of micellar systems also using fluorescent dyes.9 Typically, each of these applications requires a high degree of alignment of the guest dye molecules within the ordered host. In the context of ordered materials in nature, the alignment of dye molecules within anisotropic hosts is also an important aspect of biological studies, due to the widespread use of fluorescent probes for the investigation of alignment in biological membranes.10,11 Given the wide range of potential applications of these systems, it is important that the factors which influence the alignment of dyes within anisotropic hosts are well understood, in order to aid the design of guest–host systems with high optical anisotropy and devices with good performance.The molecular alignment of both guest and host molecules in a bulk-aligned guest–host system may be characterised by the ensemble average transformation of molecular frames into a laboratory frame,12 and thus any quantitative description of molecular alignment, such as an order parameter, relies on the definition of both of these frames. In the case of a uniaxial liquid crystal phase, the laboratory frame may be defined conveniently by the average orientation of the principal axes of the molecules in the sample, i.e. the director, n, along with two equivalent, arbitrary, orthogonal axes. If the phase is assumed to comprise uniaxial constituent molecules, then the molecular frame may be defined by the principal symmetry axis of the molecule, again with two equivalent, arbitrary, orthogonal axes. Such definitions enable the ensemble average transformation of molecular frames into a laboratory frame to be defined, giving rise to the uniaxial molecular order parameter, Sθ, as given by
 | (1) |
In the context of dyes in guest–host systems, the alignment of the guest dye molecules is generally quantified by a dichroic order parameter, Sϕ, as given for a uniaxial system by
 | (2) |
In a more general context, small, highly symmetric guest molecules have been used as probes to study the alignment of liquid crystals themselves because these guest molecules can yield simpler data than that obtained from studying a host directly, and which can be analysed without the need to make assumptions about the symmetry of the host molecules.14 Arising from this work, the calculation of the molecular alignment of guests within liquid crystal hosts has been the subject of a significant number of studies. Although the assumption of molecular uniaxiality is commonly applied in the analysis of nematic liquid crystal and guest–host systems, molecular shapes are typically of much lower symmetry. Thus, the definition of a principal molecular axis to describe the axis along which a molecule aligns in a nematic system and, in the case of a dye molecule, to describe the axis of the molecular frame against which the orientation of a TDM is defined, may not be intuitive and may be ambiguous.
An early approach to calculating the molecular alignment of solute molecules suggested that the minimum moment of inertia (MOI) axis gave a good description of the principal molecular axis for a range of substituted benzenes, including some of low symmetry, in a nematic host.15 Subsequent NMR studies have applied this approach to analyse a range of different solutes with varying degrees of success: some reports have noted slight deviations of the principal molecular axis from the minimum MOI axis that were attributable to steric effects,16,17 whereas others have suggested that the approach does not apply to some systems,18 and that shape-based approaches are more appropriate to cover a wide range of solute molecules.19,20 However, in the limiting case of a rod-like molecule of high symmetry, the minimum MOI axis will match the principal symmetry axis, and hence its principal molecular axis.
One of the earliest approaches to defining the principal molecular axis based only on the shape of a solute molecule was to consider a nematic host environment to be that of an “elastic tube”, i.e. a solute molecule dissolved in a liquid crystal is considered to be contained within an elastic tube of variable circumference, with the open ends of the tube aligned along the host director.21 The basis for this approach was that energy is required for a solute molecule to displace the liquid crystal host molecules, and that this displacement energy along the director is negligible in comparison with that required perpendicular to the director. The model could be used to give a quantitative prediction of the order parameter from the solute geometry by using Hooke's law to describe the restoring force that arises from stretching the elastic tube, such that the orientational potential energy U(Ω) relates to the circumference of the tube, C, according to
 | (3) |
An extension to this model incorporated both the circumference and the length of the solute molecule projected along the director, ZP(Ω),22 according to
 | (4) |
In order to incorporate greater sensitivity to specific molecular shapes, a further refinement to the model was proposed, as defined by
 | (5) |
 | (6) |
![[n with combining circumflex]](https://www.rsc.org/images/entities/i_char_006e_0302.gif) indicates a unit vector normal to a surface element, dS
indicates a unit vector normal to a surface element, dS![[n with combining circumflex]](https://www.rsc.org/images/entities/i_char_006e_0302.gif) , and θ
, and θ![[n with combining circumflex]](https://www.rsc.org/images/entities/i_char_006e_0302.gif) is the angle between this vector and the host director.14 The principal molecular axis defined by this model is therefore that which maximises the projected surface area parallel with the host director.
is the angle between this vector and the host director.14 The principal molecular axis defined by this model is therefore that which maximises the projected surface area parallel with the host director.
A further model using shape and an anisotropic surface interaction was proposed by Ferrarini et al,24 as expressed by
 | (7) |
![[thin space (1/6-em)]](https://www.rsc.org/images/entities/char_2009.gif) ψ), where P2 is the second Legendre polynomial, ψ is the angle between the host director and a unit vector normal to the molecular surface at a single point, the integral is over the entire surface, S, and the parameter ε gives the orienting strength of the host. This model was derived by analogy with the anchoring free energy at the surface of a particle in a nematic phase.25 Using this model, the orientational potential energy may also be expressed as
ψ), where P2 is the second Legendre polynomial, ψ is the angle between the host director and a unit vector normal to the molecular surface at a single point, the integral is over the entire surface, S, and the parameter ε gives the orienting strength of the host. This model was derived by analogy with the anchoring free energy at the surface of a particle in a nematic phase.25 Using this model, the orientational potential energy may also be expressed as | (8) |
 | (9) |
Mean-field models such as those outlined above provide a way to predict order parameters of guests within liquid crystal systems by using an appropriate value for the orienting strength of the host, and their applicability also provides information about the underlying mechanisms that are responsible for the molecular organisation. Although these models are based on shape and do not include specific intermolecular interactions, such as electrostatic interactions or hydrogen bonding, their general value and success has been established by their application to predict and interpret the experimental results for a wide variety of guest–host systems.14,24,28–30
The definition of the molecular frame is also crucial to computational studies of ordered systems because a principal molecular axis needs to be defined to calculate a molecular order parameter. Early molecular dynamics (MD) simulations of liquid crystal systems typically employed coarse-grain approaches in which molecules were described by single geometric entities, for which a principal molecular axis is readily defined as the principal symmetry axis. With significant advances in computational power, united-atom and fully atomistic MD simulations have now become relatively widespread, and the inherently low symmetries of molecules described by these approaches require the principal molecular axes to be defined from atomic coordinates. A convenient solution to this problem is to define a principal molecular axis as the vector between two atoms that intuitively approximates the long axis of a molecule, such as the vector between the CN atoms in the cyano group or between two atoms along the central aromatic core of cyanobiphenyls.31–33 However, the choice of atoms may be subjective, and can therefore complicate attempts to make quantitative comparisons between order parameters calculated in different ways for different systems. Comparisons of order parameters obtained by defining molecular axes either between two atoms or as minimum MOI axes have generally shown that the minimum MOI axes give higher order parameters,31–33 suggesting that axes defined by all of the atoms in a molecule provide a better description of the principal molecular axes, even for highly symmetric molecules. As a result, the ease of calculating minimum MOI axes, along with their unambiguous definition, has led to their relatively widespread use to analyse molecular alignment in MD simulations of ordered systems, despite the potential limitations of the approach outlined above.
MD simulations of guest–host systems add further levels of complexity to the analysis of alignment. Firstly, the principal molecular axis of the host is required to define the host director and calculate the molecular order parameter of the host, as discussed above, and as expressed by eqn (1). Secondly, the principal molecular axis of the guest is required to calculate the molecular order parameter of the guest. And, thirdly, because the experimental order parameter of a guest is generally obtained from a spectroscopic observable, the orientation of the corresponding spectroscopic transition within the guest molecule is required to obtain a calculated spectroscopic order parameter for comparison with experiment.
United-atom and fully atomistic MD simulations of guest–host systems, which have been less reported than those of liquid crystals alone, have included studies of guest spin probes and relatively small organic solutes in nematic hosts.34–40 These guest–host simulations have generally been analysed by defining the principal molecular axis of the host as the minimum MOI axis, as discussed above. In some circumstances, the nature of the experimental data with which the computational data are to be compared may provide a well-defined approach to analysing the alignment properties of the guests in MD simulations; for example, some reported NMR and EPR studies have given experimental order parameters derived from the orientations of specific bonds or orbitals that could be calculated unambiguously from atomic coordinates within the MD simulations. In one study of the molecular alignment of small (≤12 atom), highly symmetric guest molecules in MD simulations, the high symmetry of the molecules enabled the principal axes to be defined unambiguously, from which a comparison of the simulated alignment with that predicted by mean field approaches could be made.37
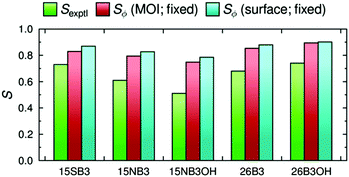
We recently reported experimental UV-visible studies of a series of five anthraquinone dyes in the nematic host mixture E7, from which we obtained a set of experimental dichroic order parameters, Sexptl, that showed significant differences between the dyes, as given in Fig. 2.41,42 In parallel, we demonstrated that a combination of fully atomistic MD simulations of the guest–host systems and time-dependent density functional theory (TD-DFT) calculations on optimised structures of the dye molecules could be used to obtain calculated dichroic order parameters, Sϕ, that are directly comparable with the experimental values, and which we used to rationalise the trend observed experimentally between the dyes. In these studies, the principal molecular axes were defined as the minimum MOI axes, providing consistency with other reported MD studies, and the molecular order parameters, Sθ (MOI), were calculated from the MD simulations according to eqn (1) for the host and according to the first term in eqn (2) for the guest dyes. The TDM orientations of the dyes were defined relative to these minimum MOI axes and calculated from the DFT-optimised structures as fixed angles, β,43 as is generally assumed in the literature; their contributions, Sβ (MOI; fixed), to the calculated order parameters, Sϕ (MOI; fixed), were obtained in accordance with eqn (2).
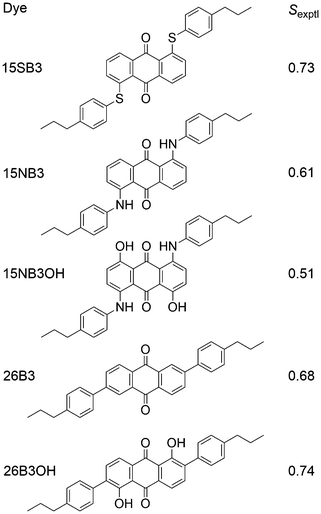 | ||
| Fig. 2 Structures and abbreviations of the five anthraquinone dyes studied in this work, along with the respective Sexptl values we reported previously.41,42 | ||
Although we obtained a good match between the calculated and experimental trends in the dichroic order parameters in this previous work, the use of the minimum MOI axes to define the principal molecular axes is an assumption in the method that was used. In general, the minimum MOI axes do not readily provide an understanding of the basis for the subtle variations calculated between the molecular alignments of the dyes studied, and, in particular, we noted that this approach appeared to give a significant underestimation of the molecular alignment of the phenyl-sulfide dye, 15SB3, relative to that of the other four dyes. In addition, the treatment of β as a fixed angle within the dyes is another assumption in the method that may not be justified because studies in other fields have shown that TDM orientations may vary significantly with molecular conformation,44–47 suggesting that the effect may also be significant for the TDM orientations of flexible guest dyes in liquid crystal hosts.
Fully atomistic MD simulations provide a data set from which any molecular axis may be defined via the calculated atomic coordinates at each trajectory step, enabling the validity of using various definitions of molecular axes to quantify molecular alignments and TDM orientations to be assessed. The choice of appropriate axes may be particularly important for molecules of low symmetry, or for symmetric molecules that explore conformations of low symmetry, such that the molecular axes may not be defined readily by symmetry. The work reported here extends our studies of the set of five anthraquinone dyes in the nematic host E7, which provide a useful data set to assess some general assumptions that are often made about molecular axis systems, and for which the results may be expected to have wider relevance than these particular systems. The work reported here had two main aims: to assess the validity of using the minimum MOI axis as the principal molecular axis, and to assess the validity of assuming that the TDM orientation has a fixed angle in the molecular frame. Hence, we present a further and more detailed analysis of the fully atomistic guest–host MD simulations of the dyes in E7 that we reported previously, we present additional MD simulations and analyses of E7 alone, and we include direct comparisons with our reported experimental data.41,42
The results are structured into two main sections. First, the guest–host simulations are analysed using several different definitions of the principal molecular axes of the dyes, including those defined by the minimum circumference and surface tensor approaches outlined above, as well as other definitions based on minimum area and maximum aspect ratio approaches. The results using the different axis definitions are compared, and the best type of axis to describe the principal molecular axes of the dyes is identified. Simulations of the host alone are then analysed to assess whether the best description of the principal molecular axis of the dyes is also applicable to the component molecules of E7. The best definition of the principal molecular axes of the dyes is then used to obtain new calculated dichroic order parameters for the guest–host systems, which are assessed versus experimental data and the values we calculated previously.
Second, the influence of molecular flexibility on the calculated transition dipole moment orientations is assessed, and a method is presented for analysing this effect without the need to calculate TDM orientations for each trajectory step in an MD simulation. The TDMs for a range of dye conformers are used to obtain new calculated dichroic order parameters of the guest–host systems, and the effects of including dye flexibility are considered.
Experimental
The guest–host MD simulations analysed here were carried out on 5 dye molecules and 400 constituent host molecules of E7 at 300 K, starting from a pseudo-nematic geometry, and using 2 fs time steps and total simulation times of 500 ns, with the trajectory steps recorded every 10 ps. The procedures and our earlier analyses of these guest–host simulations using the minimum MOI approach have been described previously.41,42 The new analyses reported here were carried out on all the trajectory steps between 30 and 500 ns, consistent with the range we established previously.A new MD simulation of the E7 host alone was carried out on 400 constituent molecules and starting from a pseudo-nematic geometry, to match the guest–host simulations analysed here. In addition, an MD simulation of the E7 host alone that used 256 constituent molecules and an isotropic starting geometry, which we had run previously to 200 ns,42 was extended here to 500 ns to match the run times of the other simulations, and it was analysed on all the trajectory steps between 120 ns (i.e., after the nematic phase had evolved) and 500 ns. The general conditions and procedures for both of these simulations of the host alone were equivalent to those of the guest–host systems.
In the analysis of the MD simulations, the principal MOI axes were determined as the eigenvectors obtained from diagonalising the inertia tensor for each molecular geometry at each trajectory step. As a starting point for the other definitions of the principal molecular axes, each molecular geometry at each trajectory step was defined by centring van der Waals radii48 on the atomic positions. The axes of minimum circumference were determined by calculating the projection of each molecular geometry onto a plane orthogonal to an initial guess of the principal axis (chosen as the minimum MOI axis), calculating the circumference of this projection, and applying a simplex algorithm to determine the axis associated with the minimum circumference. The axes of minimum cross-sectional area were calculated in an analogous way. The aspect ratio of each molecular geometry was determined as the ratio of the length of the projection of the van der Waals surface onto an initial guess of the principal axis (the minimum MOI axis) to the width, which was calculated as twice the largest orthogonal distance between the principal axis and the van der Waals surface; again, a simplex algorithm was used to determine the axis of maximum aspect ratio. The molecular surfaces used for the surface tensor calculations were constructed using the MSMS algorithm49 to define a solvent-excluded surface for each molecular geometry, using a probe radius of 3 Å and tessellating it into discrete surface elements at a density of 5 vertices per Å2 consistent with reported studies.28,50 The surface tensor axis used to define the principal molecular axis, which we refer to here as the surface tensor z-axis, was defined as the eigenvector associated with the eigenvalue with the smallest magnitude in the diagonalised Cartesian tensor, t, which was constructed from the Cartesian components (sx, sy, sz) of the unit vector, s, normal to the molecular surface at a single point,51 according to52
 | (10) |
DFT optimisations and TD-DFT calculations were carried out on isolated molecules using the Gaussian 09 package53 at the B3LYP/6-31g(d) level.54,55 The TDM vector orientation for each of the different model structure conformations was calculated from the optimised geometry of the model structure with the exception of the dihedral angles specified in the text, which were set to their respective values.
Results and discussion
The MD simulations had no reference axes to define either the laboratory frame, because the molecules were allowed to move freely, or the molecular frame, because the molecular geometries varied throughout the simulations. Consequently, the z-axis of the laboratory frame was defined by the host director, generally using the minimum MOI axes of the host molecules, and the axes of the molecular frames were defined by several different approaches, as discussed in detail below.Comparison of different definitions of the principal molecular axes
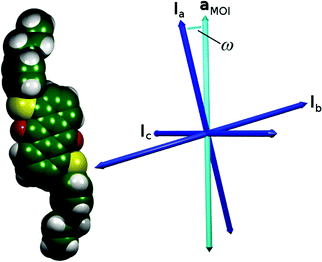
| aMOI = caIa + cbIb + ccIc | (11) |
| Dye | ω/° | S θ (MOI) | S θ (aMOI) | Δ |
|---|---|---|---|---|
| 15SB3 | 14.4 | 0.836 | 0.921 | +0.085 |
| 15NB3 | 8.4 | 0.869 | 0.898 | +0.029 |
| 15NB3OH | 4.9 | 0.843 | 0.853 | +0.010 |
| 26B3 | 7.1 | 0.880 | 0.900 | +0.020 |
| 26B3OH | 3.8 | 0.896 | 0.902 | +0.006 |
The values of Sθ (MOI) and Sθ (aMOI) given in Table 1 demonstrate that the aMOI axes are better aligned with the host director than the respective minimum MOI axes, and the differences between these values reflect the different angles, ω, between the axes for the different dyes. It is not surprising that the aMOI axes give the higher order parameters because these axes were defined from the host director, but the variation of the Δ values listed in Table 1 suggests that the minimum MOI axis is a poorer description of the principal molecular axis for some of the dyes than the others. Most notably, the largest difference is given by the sulfide-substituted dye, 15SB3, for which the minimum MOI axis gives the lowest molecular order parameter of all the dyes, whereas the aMOI axis gives the highest molecular order parameter. This result is particularly notable because our earlier comparison with experimental values showed that the calculated dichroic order parameter of 15SB3 is underestimated relative to those of the other dyes when using the minimum MOI axes.41
The definition of a set of axes that are consistently better aligned than the minimum MOI axes indicates that the principal inertia axes do not correspond to the principal molecular axes along which the dyes align within these simulations. However, the analysis does not suggest that the aMOI axes are necessarily the most aligned molecular axes, because the choice of the MOI molecular frame against which the axes are defined may limit the description of these axes.
The aMOI axis is defined from the host director, but a principal axis defined by first principles from a molecular structure is desirable. Two of the models discussed in the introduction were used here to define and assess different principal molecular axes of the dyes: the elastic tube model was used to define the axis with the minimum orthogonal circumference, and the surface tensor model was used to define the axis that gives the maximum projected surface area parallel with the director. In addition, two further axes were defined and tested. Molecular anisotropy is often quantified using a molecular aspect ratio (length/width),43 and therefore the axis giving the maximum aspect ratio corresponds to an intuitive principal molecular axis. Another intuitive approach may be to consider the axis corresponding to the minimum projected area of a molecule, which may be justified in the context of molecular diffusion, which is typically much greater along the director than perpendicular to the director56 (cf. the force on a moving body in a fluid57). Representations of these different definitions of a principal molecular axis, along with that using the minimum MOI axis, are shown in Fig. 4.
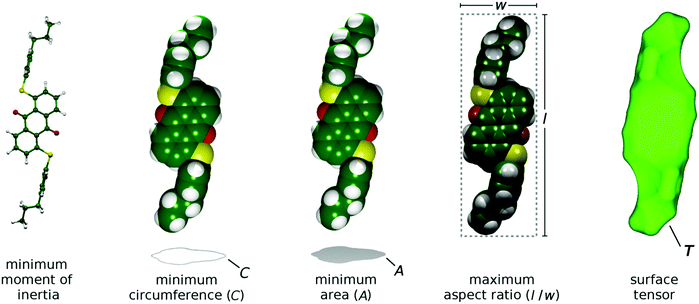 | ||
| Fig. 4 Representations of the different models used to define the principal molecular axes of the dyes, shown here with the DFT optimised structure of 15SB3. | ||
The molecular order parameters, Sθ, of the dyes in the guest–host simulations calculated according to the first term in eqn (2) for each of these different axis definitions are listed in Table 2, and the values are shown graphically in Fig. 5. The aMOI axes generally give the highest order parameters, indicating that they are the best overall description of the principal molecular axes in this analysis, as expected because they were defined from the director. Hence, the Sθ (aMOI) values may be used as a reference set to consider the order parameters obtained from the other axes, which were defined only by internal molecular parameters, and the respective differences, Δ = Sθ (aMOI) − Sθ, are also listed in Table 2. A comparison with this reference set shows that the relative order parameters obtained from the different axes are not consistent between the dyes. Most notably, the aspect ratio axes give the best aligned axes for 15SB3 and 15NB3, and the worst aligned axes for 15NB3OH, 26B3 and 26B3OH. An overall comparison of the data can be considered in terms of the average Δ values also listed in Table 2, from which it is evident that the minimum MOI and maximum aspect ratio axes are generally the worst and the surface tensor z-axis is generally the best of these descriptions from first principles of the molecular axes along which the dyes align within the simulations. Average Δ values are listed in Table 2 rather than root-mean-square (RMS) Δ values because, although these two measures show essentially the same trends, the use of RMS values would imply that that the aMOI axes are the most aligned molecular axes, whereas they are simply reference axes for comparison; other models may give axes that are more aligned than the aMOI axes because of the limitations of using a MOI-based reference frame, and the results suggest that the surface tensor z-axes are more aligned than the aMOI axes for the two dyes that give negative Δ values in Table 2. The respective values of Sθ obtained from the minimum area and minimum circumference axes are similar to each other, and this similarity may be attributed to the close relationship between a cross-sectional area and circumference, which would give identical values of Sθ in the limiting case of a circular cross-section.
| a MOI | Minimum MOI | Minimum circumference | Minimum area | Maximum aspect ratio | Surface tensor z | ||||||
|---|---|---|---|---|---|---|---|---|---|---|---|
| Dye | S θ | S θ | Δ | S θ | Δ | S θ | Δ | S θ | Δ | S θ | Δ |
| 15SB3 | 0.921 | 0.836 | 0.085 | 0.868 | 0.053 | 0.853 | 0.068 | 0.906 | 0.015 | 0.894 | 0.027 |
| 15NB3 | 0.898 | 0.869 | 0.029 | 0.888 | 0.010 | 0.874 | 0.024 | 0.891 | 0.007 | 0.874 | 0.024 |
| 15NB3OH | 0.853 | 0.843 | 0.010 | 0.836 | 0.017 | 0.845 | 0.008 | 0.814 | 0.039 | 0.860 | −0.007 |
| 26B3 | 0.900 | 0.880 | 0.020 | 0.877 | 0.023 | 0.883 | 0.017 | 0.842 | 0.058 | 0.899 | 0.001 |
| 26B3OH | 0.902 | 0.896 | 0.006 | 0.893 | 0.009 | 0.895 | 0.007 | 0.873 | 0.029 | 0.904 | −0.002 |
| Average | 0.030 | 0.022 | 0.025 | 0.030 | 0.009 | ||||||
The result of the surface tensor z-axes providing the best description of the principal molecular axes of the dyes can be used to reassess the alignment behaviour within this set of dyes. We had noted previously that a comparison with experimental dichroic ratios suggested that the calculated molecular order parameter of 15SB3 was significantly underestimated, relative to those of the other dyes, when using the minimum MOI axes.41 It is notable that this relative underestimation of the molecular order parameter of 15SB3 is corrected appreciably here by using the surface tensor z-axes. In terms of design, this result indicates that dyes with appropriate molecular shapes, rather than moment of inertia axes, will generally be required to give the highly aligned systems that are required for guest–host applications.
It is also of interest to assess how applicable the surface tensor approach may be in a more general context. Consequently, we tested its applicability for describing the alignment of the constituent molecules of the host, E7, as we report in the next section.
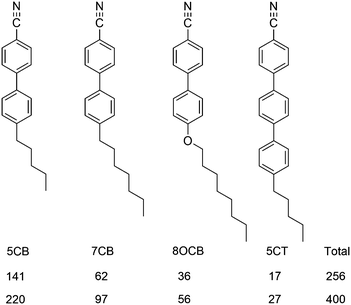 | ||
| Fig. 6 Molecular structures and abbreviations of the component molecules of E7, and the numbers of molecules used in the two simulations. | ||
The surface tensor z-axes and the minimum MOI axes were determined for each component molecule of E7 at each trajectory step, and used to calculate the respective molecular order parameters, Sθ (surface) and Sθ (MOI), against their respective directors. Plots of the order parameters during each simulation are shown in the ESI† (Fig. S1 and S2), and the values obtained by averaging across the runs are given in Table 3 for each component and for E7 as a whole, along with the respective differences, Δ = Sθ (surface) − Sθ (MOI). A comparison of these values shows that the surface tensor z-axes give slightly higher order parameters than the minimum MOI axes, indicating that the surface tensor z-axis is a good description of the principal molecular axis for the molecules of E7, and suggesting that it may be a slightly better definition. The small differences in the order parameters obtained by using these two axis definitions indicate that they provide comparable descriptions of the principal molecular axes of the host molecules, which may be attributed to their relatively rod-like shapes (Fig. 6), and it contrasts the larger differences obtained from the two axis definitions for the dye molecules (Table 2), which may be attributed to their more complex shapes. Considering the different components of E7, both axis definitions give order parameters that increase with the molecular length, which is consistent with other reports.33 Overall, these results from the host alone suggest that the surface tensor approach may be applicable more generally, and that it may be used to describe the principal molecular axes of host as well as guest molecules.
| Host component | Pseudo-nematic start | Isotropic start | ||||
|---|---|---|---|---|---|---|
| S θ (MOI) | S θ (surface) | Δ | S θ (MOI) | S θ (surface) | Δ | |
| 5CB | 0.876 | 0.877 | 0.001 | 0.879 | 0.885 | 0.006 |
| 7CB | 0.883 | 0.886 | 0.003 | 0.883 | 0.893 | 0.010 |
| 8OCB | 0.901 | 0.903 | 0.002 | 0.897 | 0.903 | 0.006 |
| 5CT | 0.915 | 0.913 | −0.002 | 0.910 | 0.912 | 0.002 |
| E7 (all components) | 0.884 | 0.885 | 0.001 | 0.884 | 0.891 | 0.007 |
The computational expense of carrying out a surface tensor analysis on these simulations of the host was significantly greater than that of a minimum MOI analysis, and the relatively small difference in the results obtained from the two approaches suggests that a surface tensor analysis might not be considered to be essential in this case, due to the relatively rod-like nature of the host molecules. On this basis, all the other analyses reported here used the minimum MOI axes to define the molecular frames of the host molecules, and hence the host director, and a surface tensor analysis of the host molecules was used only for the relevant results reported in this section.
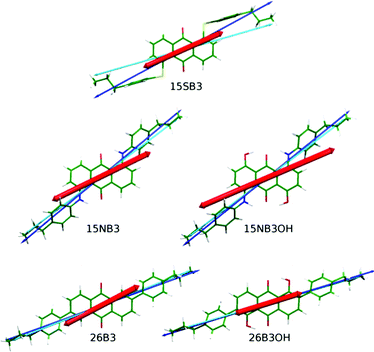 | ||
| Fig. 7 DFT optimised structures of the dyes with minimum MOI axes (blue), surface tensor z-axes (cyan) and TDM vectors (red) overlaid. | ||
The angles, β, between the surface tensor z-axes and the TDM vectors associated with the visible transitions of the dyes, their associated order parameters, Sβ (surface; fixed), and the calculated dichroic order parameters, Sϕ (surface; fixed), obtained in accordance with eqn (2) are listed in Table 4, along with the equivalent values we reported previously using the minimum MOI axes. The values obtained by using these two definitions of the principal molecular axis show subtle differences that result from how the axes relate to the TDM orientation, which is assumed here to be fixed within the molecular frame. The largest effect is shown by 15SB3, which has the largest difference between these two axes: the surface tensor z-axis is far more parallel with the planes of the phenyl substituents than the minimum MOI axis (Fig. 7), such that the TDM orientation lies between the two axes and is less aligned with the surface tensor z-axis than the minimum MOI axis, resulting in a larger angle, β, and a lower associated order parameter, Sβ (Table 4). This lower value of Sβ contrasts the significantly higher value of Sθ obtained on going from minimum MOI to surface tensor z axes for 15SB3, and it results in a calculated dichroic ratio, Sϕ (surface; fixed), that increases less than would be anticipated on the basis of the molecular alignment alone. The differences between the axes are much smaller for the other dyes but, nevertheless, the effect of the axis definition is significant and it differs in magnitude and direction among them. For example, the surface tensor z-axes of 15NB3 and 15NB3OH are closer to the TDM orientation than the minimum MOI axes, resulting in smaller angles, β, and higher associated order parameters. These subtle effects reveal that an understanding of the appropriate molecular axis against which to define the TDM orientation may be a crucial aspect in using computational approaches to aid in the molecular design of dyes because optimising the associated order parameter, Sβ, is a key aspect for the production of practical guest–host devices.
| Dye | MOI; fixed41,43 | surface; fixed | ||||
|---|---|---|---|---|---|---|
| β/° | S β | S ϕ | β/° | S β | S ϕ | |
| 15SB3 | 4.4 | 0.991 | 0.829 | 7.9 | 0.972 | 0.869 |
| 15NB3 | 13.8 | 0.914 | 0.794 | 10.9 | 0.946 | 0.827 |
| 15NB3OH | 15.9 | 0.887 | 0.748 | 13.9 | 0.913 | 0.785 |
| 26B3 | 8.4 | 0.968 | 0.853 | 7.0 | 0.978 | 0.879 |
| 26B3OH | 1.7 | 0.999 | 0.894 | 2.8 | 0.997 | 0.901 |
The dichroic order parameters calculated using the surface tensor z-axes and the minimum MOI axes are also shown graphically in Fig. 8, alongside the experimental values,41 and a comparison shows that the experimental trend is generally replicated using either axis definition. However, we have shown here that the surface tensor z-axis is the best definition of the principal molecular axis among those we have tested, and as such it may be considered to give a better justified axis to use for calculating dichroic order parameters. As reported and discussed in detail previously,41,42 the general OPLS force field used in these MD simulations is known to overestimate the non-bonded interactions between the molecules, giving rise to molecular order parameters, Sθ, of the host and guest molecules that are higher than those reported experimentally, and resulting in the calculated dichroic order parameters being overestimated using either axis definition. Nevertheless, the use of default or literature force constants, without the need to parameterise the force field, clearly enables a meaningful comparison of the trends arising from changes in dye structure in a nematic environment.
Influence of flexibility on TDM orientations
The alignment of dyes in guest–host systems is generally quantified by a dichroic order parameter in which the orientation of the TDM is considered to be fixed within the molecular frame of the dye, as discussed in the Introduction and as given by eqn (2). This assumption may be valid for many dyes, and particularly for those with rigid chromophores, but its validity may need to be assessed for more flexible systems. In the case of the dyes studied here, we have shown previously that the phenyl substituent groups form part of the chromophores,42,43 and that the dyes exhibit different degrees of flexibility that vary with these substituents.41 Hence, we explored the effect of dye flexibility on the TDM orientations using | (12) |
An obvious method of rigorously assessing the assumption of treating β as a fixed angle for the dyes studied here would be to carry out TD-DFT calculations to determine the TDM orientation for each dye structure in each trajectory step from the MD simulations. However, the computational expense of carrying out this very large number of calculations at an appropriate level of theory is currently prohibitive. Consequently, the influence of molecular flexibility on β was assessed by carrying out TD-DFT calculations on a range of geometries that were representative of those explored during the MD simulations.
The molecular conformations explored by the dyes during the MD simulations were first analysed to determine the most flexible structural units, enabling those responsible for the most significant variation in molecular conformations to be identified. Histograms of all of the dihedral angles within the dye molecules were analysed over the course of the MD trajectories, excluding those involving hydrogen atoms and the alkyl chains, which were shown not to have a significant influence on the TDM orientations (see ESI†). Of these dihedral angles, those arising from torsions around the substituent linking groups within the dyes were found to be the most flexible and gave population distributions with full width at half maximum (FWHM) values greater than 20°. These angles are labelled on the structures of the dyes shown in Fig. 9, and histograms of the population distributions around these dihedral angles are shown in Fig. 10. The most populated angles are listed in Table 5 along with their FWHM values and the ranges containing 95% of the populations, with the relative widths of these distributions reflecting the relative flexibilities of the different groups.41 Further details on the calculation of these distributions are given in the ESI.†
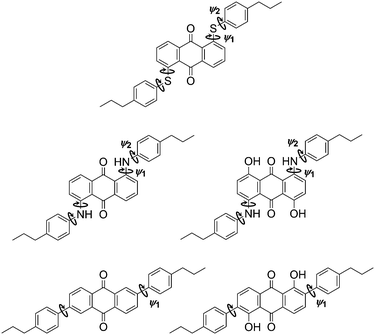 | ||
| Fig. 9 Structures of the dyes with labels indicating bonds about which the dihedral angle distributions were calculated to have a FWHM > 20° during the guest–host MD simulations. | ||
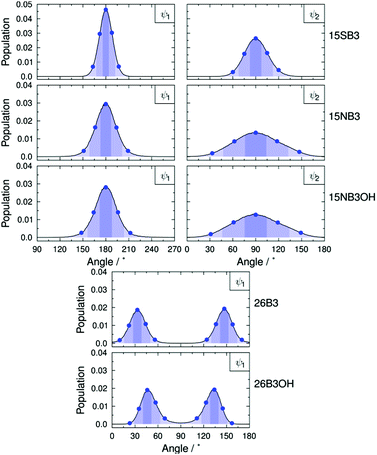 | ||
| Fig. 10 Dihedral angle population distributions of the dyes from the MD simulations using 1° histogram bin-widths; the details are described in the ESI.† Blue dots indicate the angles used in the geometries for the TD-DFT calculations of the TDM orientations. Shaded regions indicate the “bins” used to assign geometries from the MD trajectories to those for which the TDM orientations were calculated; the bin ranges are given in the ESI.† | ||
| Dye | ψ 1/° | ψ 2/° | ||||
|---|---|---|---|---|---|---|
| Angle | FWHM | 95% | Angle | FWHM | 95% | |
| 15SB3 | 180 | 22 | 163–197 | 90 | 35 | 60–120 |
| 15NB3 | 180 | 30 | 151–209 | 90 | 70 | 33–147 |
| 15NB3OH | 180 | 31 | 148–212 | 90 | 74 | 31–149 |
| 26B3 | 33, 147 | 23 | 10–56, 124–170 | — | — | — |
| 26B3OH | 46, 134 | 22 | 23–69, 111–157 | — | — | — |
The most populated dihedral angles in the MD simulations were identical to those of the DFT optimised structure for 15SB3 (ψ1 = 180°, ψ2 = 90°), and the ψ1 values were within 3° and 5° of the DFT optimised structures for 26B3 and 26B3OH, respectively;43 all of these angles had relatively narrow distributions that indicate moderate flexibility within these linking groups. The most populated angles for 15NB3 and 15NB3OH were the same as those for 15SB3, but the values of ψ2 were significantly (45°) different from those of the DFT optimised structures,43 and both ψ1 and ψ2 had wide population distributions of ca. 60° and 120° (95% ranges), respectively, which indicated that the phenyl-amine dyes have significant flexibility, reflecting the very shallow potential energy surfaces we reported previously.41
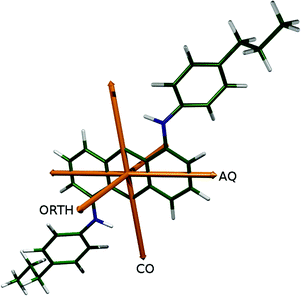
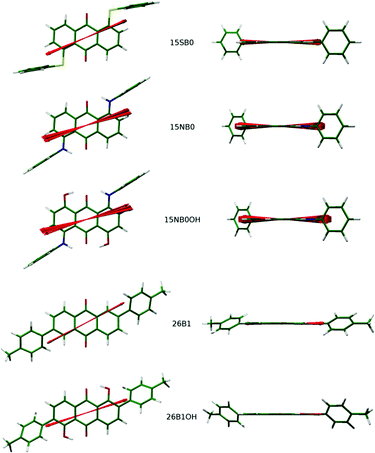
For each of the torsions of 15SB3, 15NB3 and 15NB3OH identified in Fig. 9, a set of five dihedral angles was defined, corresponding to the angle with the maximum population, the angles with half this maximum population (the angles at the FWHM values), and the angles bounding 95% of the population distributions around this maximum; these angles correspond to the values listed in Table 5, and they are indicated by the blue dots in Fig. 10. An equivalent approach for 26B3 and 26B3OH gave a set of ten dihedral angles, arising from the two population maxima within each angle range of 180° shown in Fig. 10, and again they are indicated by blue dots. For each dye, TD-DFT calculations were carried out for geometries corresponding to all combinations of the these sets of dihedral angles, using model structures in which the propyl substituents of the dyes were substituted with either hydrogen atoms to give models 15SB0, 15NB0 and 15NB0OH or methyl groups to give models 26B1 and 26B1OH; hence, calculations were carried out for 54 = 625 conformers of each of 15SB0, 15NB0 and 15NB0OH, and 102 = 100 conformers of each of 26B1 and 26B1OH. These models were chosen because their calculated visible transitions were found to arise from the same orbital contributions and with TDM orientations that were almost identical to those of the propyl-substituted dyes, as described in the ESI,† thereby enabling the large number of calculations to be carried out more efficiently. The TDM orientation for each of these model conformers was defined relative to the atoms in the anthraquinone core by using a scaled sum of axes corresponding to the minimum MOI axis of the 4 atoms in the CO groups, the minimum MOI axis of the 14 carbon atoms in the central anthraquinone group, and a third axis orthogonal axis, as shown in Fig. 11. This approach provided a consistent definition of the relatively fixed anthraquinone core against which to define the TDM axes of the different conformers, while also accounting for the non-equilibrium anthraquinone core geometries that were explored during the MD simulations.
For each trajectory step from the MD simulations, each dye structure was matched to that of a model conformer for which a TD-DFT calculation had been performed, by using the “bins” shown in Fig. 10 to identify the model conformer with the closest combination of dihedral angles to those of the dye in the simulation. The TDM orientation of each dye structure in the MD simulation was then defined, relative to the atoms in the anthraquinone core, as that calculated for the closest model conformer, and the angle β was determined between this TDM orientation and the surface tensor z-axis of the dye in the simulation.
Fig. 12 shows the model structures with the dihedral angles that were varied to obtain the different conformers fixed at their most populated values from the MD simulations, and with the orientations of the calculated TDMs obtained from the 95% most populated model conformers overlaid as unit vectors on these fixed structures. A simple inspection shows that the 2,6-disubstituted dyes, which have direct phenyl substituents, give little variation in the calculated TDM orientation between the conformers, whereas the 1,5-disubstituted dyes, in which the phenyl substituents are connected via linking groups, exhibit more variation. This variation is greater for the amine linkages, which give the greater flexibility (as shown by the population distributions in Fig. 10, and as reported previously41), and it includes both in-plane and out-of-plane displacements with respect to the anthraquinone core.
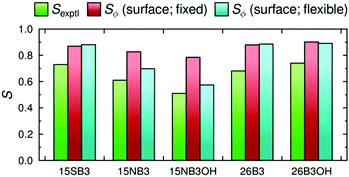
The average angles calculated between the TDM vectors and the surface tensor z-axes, βav, are listed in Table 6, which also gives the associated ensemble average contributions, Sβ (surface; flexible), and dichroic order parameters, Sϕ (surface; flexible), calculated in accordance with eqn (12). The values listed in Table 6 show that 15SB3, 26B3 and 26B3OH exhibit remarkably similar βav values that all lie within 3° of the respective β values determined by assuming fixed TDM orientations, given in Table 4. However, there is an interesting contrast between these dyes. 26B3OH gives the smallest value of β and the highest associated alignment assuming a fixed TDM, and including flexibility for this dye results in a larger average angle and consequently lower associated alignment. By contrast, the inclusion of flexibility for both 15SB3 and 26B3 results in an average angle that is smaller and an associated order parameter that is higher than that obtained by assuming a fixed TDM. This effect suggests that the flexibility of 15SB3 and 26B3 populates conformers that have better TDM alignments within the molecular frame than the lowest energy conformer, whereas the opposite occurs for 26B3OH. The values of βav for 15NB3 and 15NB3OH are 10° and 13.8° larger than the respective values of β determined by assuming fixed TDM orientations, resulting in significantly lower associated order parameters Sβ, and calculated dichroic order parameters, Sϕ, for these dyes.
| Dye | surface; flexible | ||
|---|---|---|---|
| β av/° | S β | S ϕ | |
| 15SB3 | 5.3 ± 2.8 | 0.984 | 0.880 |
| 15NB3 | 20.9 ± 5.5 | 0.799 | 0.698 |
| 15NB3OH | 27.7 ± 6.1 | 0.667 | 0.574 |
| 26B3 | 5.3 ± 2.7 | 0.984 | 0.885 |
| 26B3OH | 5.3 ± 2.9 | 0.984 | 0.890 |
A graphical comparison of the calculated dichroic order parameters with fixed and flexible TDM orientations is shown in Fig. 13, along with the experimental dichroic order parameters. Again, these calculated values overestimate the experimental order parameters, consistent with the overestimate of the molecular order parameters in the MD simulations discussed previously.41,42 However, it is notable that the inclusion of flexibility in the calculated TDM orientations significantly reduces the overestimation of the dichroic order parameters for the more flexible dyes, 15NB3 and 15NB3OH, whereas it has a relatively small effect on the values calculated for the other, less flexible, dyes.
Overall, the results show that molecular flexibility within the chromophore has a significant effect on the orientation of the TDM within the molecular frame of the dyes studied here, and on their calculated dichroic order parameters. Both the magnitude and the nature of the effect varies significantly between these dyes, with flexibility resulting in lower calculated order parameters for three of the dyes, as might be expected intuitively, but in higher calculated order parameters for two of the dyes due to the population of conformers with TDMs that are better aligned than those of the lowest energy conformers. Hence, it would seem that the general assumption of a fixed TDM orientation in guest–host systems may need to be considered carefully, particularly for dyes containing flexible groups within the chromophore.
Conclusions
Analyses of fully atomistic MD simulations of a set of guest anthraquinone dyes in the host E7 have been used to assess five different definitions of the principal molecular axis along which the dye molecules align in a nematic host. The results have shown that the surface tensor z-axis is the best of those assessed, whereas the minimum moment of inertia and maximum aspect ratio axes are the worst, although all of the axes tested here provide a fair description of the principal molecular axes of the dyes. Analyses of MD simulations of the host alone showed that the surface tensor z-axes give slightly higher molecular order parameters than the minimum moment of inertia axes, suggesting that the surface tensor approach may also be suitable for defining principal molecular axes in liquid crystal systems more generally, including hosts as well as guests. The calculated dichroic order parameters of the guest–host systems obtained by using the surface tensor z-axes of the dyes and fixed TDM orientations were generally comparable to those calculated previously using the minimum MOI axes. However, the results revealed subtle differences that arise from a combination of the different positions of the axes obtained from the two definitions and the orientations of the fixed TDMs relative to those axes.A general method for assessing the influence of molecular flexibility on TDM orientations has been presented, and the analysis of the dyes studied here has shown that the effect is strongest for the phenyl-amine dyes, which have the most flexible linking groups. Notably, the calculated order parameters that included flexibility were not always lower than those calculated using fixed TDMs, with some giving higher values attributable to flexibility populating conformers with better TDM orientations than those of the lowest energy conformers, suggesting that chromophore flexibility is not necessarily detrimental to the optical anisotropy of dyes within ordered systems. The calculated dichroic order parameters that included flexible rather than fixed TDMs reduced the overestimation of the experimental values for the dyes with more flexible chromophores. The results suggest that molecular flexibility is an important property to consider in assessing the suitability of dye molecules for use within guest–host systems for practical applications; it is also relevant in the context of using polarised UV-visible absorption spectra of guest dyes to assess the molecular alignment properties of liquid crystal hosts. In the context of molecular design for guest–host applications, some molecular flexibility is generally required for dyes to have sufficient solubility in a host, and it is typically achieved by substituents with terminal alkyl chains that are not part of the chromophore, such as the propyl substituents in the dyes studied here. The results suggest that chromophores in which flexibility enhances or maintains the TDM orientation with respect to the principal molecular axis might be used, in some cases, as an additional design feature to aid the compatibility of guest dyes with hosts.
The phenyl-sulfide dye studied here has provided notably interesting results that can be summarised to illustrate the general points that arise from this work, and which can also explain some of the apparent discrepancies in the calculated values for this dye that we noted in previous reports. Importantly, the interpretation reported here can be used to rationalise the relatively high dichroic order parameters that have been reported generally, over many years, for various phenyl-sulfide anthraquinone dyes.60–63 The minimum MOI axis was shown to give a relatively poor description of the principal molecular axis of the phenyl-sulfide dye, which had the largest discrepancy with the reference axis, aMOI, for any of the dyes studies here. The surface tensor z-axis was shown to give a much better description of the principal molecular axis for this dye, as for the set of dyes as a whole, resulting in a high calculated molecular order parameter. The calculated dichroic order parameter for this dye was higher using the surface tensor z-axis than the minimum MOI axis, but slightly less than would be expected on the basis of the molecular alignment alone due to the slightly worse fixed TDM orientation versus the surface tensor z-axis. Including the effect of flexibility gave better TDM orientations within this dye and a relatively high calculated dichroic order parameter that was comparable to those of the two 2,6-disubstitued dyes, much higher than those of the 1,5-diaminophenyl-substituted dyes, and which gave a significantly better match with the overall trend in the experimental values. The subtleties of these various effects are not intuitive, and the surface tensor approach provides a coherent rationale based on molecular shape: the sulfide linkage preferentially orients the planes of the phenyl substituents perpendicular to the plane of the anthraquinone core, giving good molecular alignment of the dyes within the host; it is a moderately flexible linkage that results in the dynamic population of a relatively narrow range of conformers that give good TDM orientations within the dye; and these effects combine to give good alignment of the dye TDMs within the host.
In a wider context, the application of the surface tensor model to assess the alignment of dyes within ordered systems may be expected to provide a way to understand how different structural motifs influence the molecular shapes and the axes along which dyes align, as well as their TDM orientations, potentially enabling the molecular design of dyes with improved properties for guest–host applications. Overall, the ability to use the computational approaches presented here to consider how the various aspects of molecular design influence the properties would seem to provide a valuable tool with which to explore the basis of both molecular and TDM alignments in ordered systems generally. Moreover, the methods presented here may be able to provide a generic approach to predicting how different chromophores and functional groups influence dichroic order parameters in a wide range of systems, potentially enabling the screening of hypothetical structures at an early stage in the future design of new guest–host devices.
Acknowledgements
This work was supported by an EPSRC DTA studentship (EP/J500598/1), EPSRC grant EP/M020584/1 for the development of dyes for liquid crystal applications, and EPSRC Platform Grant EP/D055261/1 and EPSRC grant EP/J007714/1 for the development of liquid crystals for displays. Additionally, we thank The Technology Partnership (UK) and Halation (China) for support on the development of the synthesis of dyes. Data from this article are available by request from the University of York Data Catalogue at http://dx.doi.org/10.15124/63f43299-ec63-4573-a26a-6f481a735cda.References
- B. Bahadur, in Handbook of Liquid Crystals, ed. D. Demus, J. W. Goodby, G. W. Gray, H. W. Spiess and V. Vill, Wiley-VCH, Weinheim, 1998, vol. 2A, pp. 257–302 Search PubMed.
- M. T. Sims, Liq. Cryst., 2016 DOI:10.1080/02678292.2016.1189613.
- Y.-H. Lin, H. Ren and S.-T. Wu, Appl. Phys. Lett., 2004, 84, 4083–4085 CrossRef CAS.
- E. Peeters, J. Lub, J. A. M. Steenbakkers and D. J. Broer, Adv. Mater., 2006, 18, 2412–2417 CrossRef CAS.
- M. R. Lutfor, G. Hegde, S. Kumar, C. Tschierske and V. G. Chigrinov, Opt. Mater., 2009, 32, 176–183 CrossRef CAS.
- L. De Sio, L. Ricciardi, S. Serak, M. La Deda, N. Tabiryan and C. Umeton, J. Mater. Chem., 2012, 22, 6669–6673 RSC.
- C. Carrasco-Vela, X. Quintana, E. Oton, M. A. Geday and J. M. Oton, Opto–Electron. Rev., 2011, 19, 496–500 Search PubMed.
- M. G. Debije, Adv. Funct. Mater., 2010, 20, 1498–1502 CrossRef CAS.
- Q. K. Liu, C. Beier, J. Evans, T. Lee, S. L. He and I. I. Smalyukh, Langmuir, 2011, 27, 7446–7452 CrossRef CAS PubMed.
- J. E. Reeve, A. D. Corbett, I. Boczarow, T. Wilson, H. Bayley and H. L. Anderson, Biophys. J., 2012, 103, 907–917 CrossRef CAS PubMed.
- Š. Timr, A. Bondar, L. Cwiklik, M. Štefl, M. Hof, M. Vazdar, J. Lazar and P. Jungwirth, J. Phys. Chem. B, 2013, 118, 855–863 CrossRef PubMed.
- M. van Gurp, Colloid Polym. Sci., 1995, 273, 607–625 CAS.
- B. Nordén, A. Rodger and T. Daffron, Linear Dichroism and Circular Dichroism, The Royal Society of Chemistry, Cambridge, UK, 2010 Search PubMed.
- E. E. Burnell and C. A. de Lange, Chem. Rev., 1998, 98, 2359–2387 CrossRef CAS PubMed.
- J. M. Anderson, J. Magn. Reson., 1971, 4, 231–235 CAS.
- H. Fujiwara, N. Shimizu, T. Takagi and Y. Sasaki, Bull. Chem. Soc. Jpn., 1985, 58, 2285–2288 CrossRef CAS.
- H. Fujiwara, M. Watanabe and Y. Sasaki, Bull. Chem. Soc. Jpn., 1988, 61, 1091–1094 CrossRef CAS.
- Y. P. Lee and D. F. R. Gilson, J. Chem. Phys., 1979, 70, 2042–2044 CrossRef CAS.
- A. L. Segre and S. Castellano, J. Magn. Reson., 1972, 7, 5–17 CAS.
- J. C. T. Rendell, D. S. Zimmerman, A. J. van der Est and E. E. Burnell, Can. J. Chem., 1997, 75, 1156–1161 CrossRef CAS.
- A. J. van der Est, M. Y. Kok and E. E. Burnell, Mol. Phys., 1987, 60, 397–413 CrossRef CAS.
- D. S. Zimmerman and E. E. Burnell, Mol. Phys., 1990, 69, 1059–1071 CrossRef.
- D. S. Zimmerman and E. E. Burnell, Mol. Phys., 1993, 78, 687–702 CrossRef.
- A. Ferrarini, G. J. Moro, P. L. Nordio and G. R. Luckhurst, Mol. Phys., 1992, 77, 1–15 CrossRef.
- S. V. Burylov and Y. L. Raikher, Phys. Lett. A, 1990, 149, 279–283 CrossRef CAS.
- A. Ferrarini and G. J. Moro, in NMR of Ordered Liquids, ed. E. E. Burnell and C. A. de Lange, Springer, New York, 1997, pp. 241–258 Search PubMed.
- H. Kamberaj, R. J. Low and M. P. Neal, Mol. Phys., 2006, 104, 335–357 CrossRef CAS.
- A. Ferrarini, F. Janssen, G. J. Moro and P. L. Nordio, Liq. Cryst., 1999, 26, 201–210 CrossRef CAS.
- A. Ferrarini, G. J. Moro and P. L. Nordio, in Physical Properties of Liquid Crystals: Naematics, ed. D. A. Dunmur, A. Fukuda and G. R. Luckhurst, INSPEC, London, U.K., 2001, pp. 103–112 Search PubMed.
- Z. Danilović and E. E. Burnell, J. Chem. Phys., 2009, 130, 154506 CrossRef PubMed.
- G. Tiberio, L. Muccioli, R. Berardi and C. Zannoni, ChemPhysChem, 2009, 10, 125–136 CrossRef CAS PubMed.
- M. R. Wilson, J. Mol. Liq., 1996, 68, 23–31 CrossRef CAS.
- J. Peláez and M. Wilson, Phys. Chem. Chem. Phys., 2007, 9, 2968–2975 RSC.
- F. Chami, M. R. Wilson and V. S. Oganesyan, Soft Matter, 2012, 8, 6823–6833 RSC.
- E. Kuprusevicius, R. Edge, H. Gopee, A. N. Cammidge, E. J. L. McInnes, M. R. Wilson and V. S. Oganesyan, Chem. – Eur. J., 2010, 16, 11558–11562 CrossRef CAS PubMed.
- V. S. Oganesyan, E. Kuprusevicius, H. Gopee, A. N. Cammidge and M. R. Wilson, Phys. Rev. Lett., 2009, 102, 013005 CrossRef CAS PubMed.
- A. Pizzirusso, M. B. Di Cicco, G. Tiberio, L. Muccioli, R. Berardi and C. Zannoni, J. Phys. Chem. B, 2012, 116, 3760–3771 CrossRef CAS PubMed.
- A. Pizzirusso, M. E. Di Pietro, G. De Luca, G. Celebre, M. Longeri, L. Muccioli and C. Zannoni, ChemPhysChem, 2014, 15, 1356–1367 CrossRef CAS PubMed.
- A. C. J. Weber, A. Pizzirusso, L. Muccioli, C. Zannoni, W. L. Meerts, C. A. de Lange and E. E. Burnell, J. Chem. Phys., 2012, 136, 174506 CrossRef PubMed.
- A. C. J. Weber, E. E. Burnell, W. L. Meerts, C. A. de Lange, R. Y. Dong, L. Muccioli, A. Pizzirusso and C. Zannoni, J. Chem. Phys., 2015, 143, 011103 CrossRef PubMed.
- M. T. Sims, L. C. Abbott, S. J. Cowling, J. W. Goodby and J. N. Moore, Phys. Chem. Chem. Phys., 2016, 18, 20651–20663 RSC.
- M. T. Sims, L. C. Abbott, S. J. Cowling, J. W. Goodby and J. N. Moore, Chem. – Eur. J., 2015, 21, 10123–10130 CrossRef CAS PubMed.
- M. T. Sims, L. C. Abbott, S. J. Cowling, J. W. Goodby and J. N. Moore, J. Phys. Chem. C, 2016, 120, 11151–11162 CAS.
- J. A. Dickinson, P. W. Joireman, R. T. Kroemer, E. G. Robertson and J. P. Simons, J. Chem. Soc., Faraday Trans., 1997, 93, 1467–1472 RSC.
- P. W. Joireman, R. T. Kroemer, D. W. Pratt and J. P. Simons, J. Chem. Phys., 1996, 105, 6075–6077 CrossRef CAS.
- J. A. Dickinson, M. R. Hockridge, R. T. Kroemer, E. G. Robertson, J. P. Simons, J. McCombie and M. Walker, J. Am. Chem. Soc., 1998, 120, 2622–2632 CrossRef CAS.
- C. Brand, W. L. Meerts and M. Schmitt, J. Phys. Chem. A, 2011, 115, 9612–9619 CrossRef CAS PubMed.
- A. Bondi, J. Phys. Chem., 1964, 68, 441–451 CrossRef CAS.
- M. F. Sanner, A. J. Olson and J. C. Spehner, Biopolymers, 1996, 38, 305–320 CrossRef CAS PubMed.
- A. di Matteo, A. Ferrarini and G. J. Moro, J. Phys. Chem. B, 2000, 104, 7764–7773 CrossRef CAS.
- A. Ferrarini and P. L. Nordio, J. Chem. Soc., Perkin Trans. 2, 1998, 455–460 RSC.
- L. Feltre, A. Ferrarini, F. Pacchiele and P. L. Nordio, Mol. Cryst. Liq. Cryst. Sci. Technol., Sect. A, 1996, 290, 109–118 CrossRef CAS.
- M. J. Frisch, G. W. Trucks, H. B. Schlegel, G. E. Scuseria, M. A. Robb, J. R. Cheeseman, G. Scalmani, V. Barone, B. Mennucci, G. A. Petersson, H. Nakatsuji, M. Caricato, X. Li, H. P. Hratchian, A. F. Izmaylov, J. Bloino, G. Zheng, J. L. Sonnenberg, M. Hada, M. Ehara, K. Toyota, R. Fukuda, J. Hasegawa, M. Ishida, T. Nakajima, Y. Honda, O. Kitao, H. Nakai, T. Vreven, J. J. A. Montgomery, J. E. Peralta, F. Ogliaro, M. Bearpark, J. J. Heyd, E. Brothers, K. N. Kudin, V. N. Staroverov, R. Kobayashi, J. Normand, K. Raghavachari, A. Rendell, J. C. Burant, S. S. Iyengar, J. Tomasi, M. Cossi, N. Rega, J. M. Millam, M. Klene, J. E. Knox, J. B. Cross, V. Bakken, C. Adamo, J. Jaramillo, R. Gomperts, R. E. Stratmann, O. Yazyev, A. J. Austin, R. Cammi, C. Pomelli, J. W. Ochterski, R. L. Martin, K. Morokuma, V. G. Zakrzewski, G. A. Voth, P. Salvador, J. J. Dannenberg, S. Dapprich, A. D. Daniels, Ö. Farkas, J. B. Foresman, J. V. Ortiz, J. Cioslowski and D. J. Fox, Gaussian 09, Revision B.01, Gaussian Inc., Wallingford CT, 2009 Search PubMed.
- C. T. Lee, W. T. Yang and R. G. Parr, Phys. Rev. B: Condens. Matter Mater. Phys., 1988, 37, 785–789 CrossRef CAS.
- A. D. Becke, J. Chem. Phys., 1993, 98, 5648–5652 CrossRef CAS.
- G. J. Kruger, Phys. Rep., 1982, 82, 229–269 CrossRef.
- G. K. Batchelor, An Introduction to Fluid Dynamics, Cambridge University Press, Cambridge, 2002 Search PubMed.
- K. J. Rothschild and N. A. Clark, Biophys. J., 1979, 25, 473–487 CrossRef CAS PubMed.
- J. I. Cail, D. J. R. Taylor, R. F. T. Stepto, M. G. Brereton, R. A. Jones, M. E. Ries and I. M. Ward, Macromolecules, 2000, 33, 4966–4971 CrossRef CAS.
- F. C. Saunders, K. J. Harrison, E. P. Raynes and D. J. Thompson, IEEE Trans. Electron Devices, 1983, 30, 499–503 CrossRef.
- H. Iwanaga, K. Naito and Y. Nakai, Mol. Cryst. Liq. Cryst., 2001, 364, 211–218 CrossRef CAS.
- H. Iwanaga, Materials, 2009, 2, 1636–1661 CrossRef CAS.
- H. Iwanaga, K. Naito and F. Aiga, J. Mol. Struct., 2010, 975, 110–114 CrossRef CAS.
Footnote |
| † Electronic supplementary information (ESI) available. See DOI: 10.1039/c6cp05979a |
| This journal is © the Owner Societies 2017 |

