 Open Access Article
Polaronic transport in iron phosphate glasses containing HfO2 and CeO2
Ana
Šantić
*a,
Radha D.
Banhatti
 a,
Luka
Pavić
a,
Hüseyin
Ertap
b,
Mustafa
Yüksek
b,
Mevlüt
Karabulut
c and
Andrea
Moguš-Milanković
a
a,
Luka
Pavić
a,
Hüseyin
Ertap
b,
Mustafa
Yüksek
b,
Mevlüt
Karabulut
c and
Andrea
Moguš-Milanković
a
aDivision of Materials Chemistry, Ruđer Bošković Institute, 10000 Zagreb, Croatia. E-mail: asantic@irb.hr
bDepartment of Physics, Kafkas University, 36100 Kars, Turkey
cPhysics Department, Faculty of Science, Gebze Technical University, 41400 Gebze, Turkey
First published on 9th December 2016
Abstract
The electrical and dielectric properties of three series of glasses, xHfO2–(40 − x)Fe2O3–60P2O5, 0 ≤ x ≤ 8 mol%, xCeO2–(40 − x)Fe2O3–60P2O5, 0 ≤ x ≤ 8 mol%, and xHfO2–(38 − x)Fe2O3–2B2O3–60P2O5 2 ≤ x ≤ 6 mol%, have been investigated by impedance spectroscopy over a wide frequency and temperature range. As expected, these glasses exhibit polaronic conductivity which strongly depends on the fraction of ferrous ions, Fe2+/Fetot. Following a detailed discussion on the DC conductivity, we use the MIGRATION concept to model their conductivity spectra. It is found that in each series of glasses, the shape of the conductivity isotherms remains the same indicating that the time-temperature superposition principle is satisfied and that the mechanism of conductivity is the same. Returning to a model-free scaling procedure, namely Summerfield scaling, it is found that while conductivity isotherms for each composition yield a master curve, we need to suitably shift individual master curves on the frequency axis to generate a super-master curve. We examine the dependence of the DC conductivity and the shift factors on the number density of charge carriers. Next, using the fact that the dielectric strength of relaxation for each isotherm is well-defined in these systems, we scale the conductivity isotherms using the Sidebottom scaling procedure. This procedure yields a super-master curve, implying that length scales for polaronic transport also change with composition. Further, using the scaling features of permittivity spectra, we extract in a straightforward way the characteristic spatial extent of localized hopping of polarons and find that it decreases with increasing number density of charge carriers. The magnitude of these values obtained from permittivity spectra lies in the same range as those for the polaron radius calculated using the equation proposed by Bogomolov and Mirilin.
Introduction
For more than three decades, iron phosphate glasses have been attracting considerable scientific and technological attention due to their excellent physical and chemical properties such as low melting and glass transition temperatures, high thermal expansion coefficient, good chemical durability, low rate of corrosion and high electrical conductivity.1–5 These properties make them useful for a wide range of applications such as laser hosts, solid electrolytes and materials for immobilization and disposal of nuclear wastes.Binary iron phosphate glasses exhibit electronic conduction via a polaronic conduction mechanism.5–10 Their electronic conductivity is a result of the iron ions being in two valence states and the conduction takes place by thermally activated small polaron hopping from Fe2+ to Fe3+ sites. Therefore, polaron transport strongly depends on the overall iron oxide content and fraction of iron ions in different valence states, i.e. the Fe2+/Fetot ratio. Indeed, it is found that by changing the iron oxide content and Fe2+/Fetot ratio, electrical conductivity of iron phosphate glasses varies by several orders of magnitude.11,12
Since a significant amount of Fe2O3 can be vitrified in phosphates, glasses with up to 40 mol% of Fe2O3 in the Fe2O3–P2O5 system can be readily prepared by the conventional melt quenching technique ensuring a well-tuneable iron oxide content.13,14 On the other hand, the fraction of ferrous ions (Fe2+/Fetot ratio) depends on the iron redox equilibrium of the reaction 4Fe3+ (melt) + 2O2− (melt) ↔ 4Fe2+ (melt) + O2 (gas) that occurs during melting. Critical factors that influence this reaction are: melting temperature, time, atmosphere, types of raw materials and the presence of other substances in the batch.11,13,15 Generally, in conventional Fe2O3–P2O5 glasses, the fraction of Fe2+ ions can increase up to 50%, whereas melts with higher Fe2+/Fetot ratios tend to crystallize upon cooling.11,13
Also, addition of other oxides influences the electrical properties of Fe2O3–P2O5 glasses in many ways. For example, iron phosphate glasses containing an alkali oxide show mixed polaronic–ionic conductivity,16 whereas addition of a second transition-metal oxide (such as MoO3, V2O5, WO3) can cause a mixed transition-metal ion effect.17 Further, it is expected that addition of other oxides can affect electrical conductivity indirectly due to their specific influence on the glass structure (as a network former or modifier) and/or simply by influencing iron redox equilibrium during melting.
In line with this, recent studies on iron (boro)phosphate glasses containing hafnium oxide18 and cerium oxide19 show that Hf and Ce tend to increase the Fe2+ fraction in these glasses even up to 60%. In this contribution, we make use of such a wide variation of Fe2+ contents in these materials and analyse in detail various scaling features of the conductivity and permittivity spectra in three series of glasses (see below) so as to obtain insights into factors that influence polaron transport.
Experimental
Glasses with nominal compositions xHfO2–(40 − x)Fe2O3–60P2O5, 0 ≤ x ≤ 8 mol% (Hf series), xCeO2–(40 − x)Fe2O3–60P2O5, 0 ≤ x ≤ 8 mol% (Ce Series) and xHfO2–(38 − x)Fe2O3–2B2O3–60P2O5 2 ≤ x ≤ 6 mol% (HfB series) were prepared by the melt quenching technique. The experimental details related to the glass preparation as well as structural characterization of these glasses are given in ref. 18 and 19, respectively. The number of iron ions per volume, N, calculated from the glass composition and density, and the fraction of ferrous ions, C![[double bond, length as m-dash]](https://www.rsc.org/images/entities/char_e001.gif) Fe2+/Fetot ratio, determined by Mössbauer spectroscopy,18,19 for all these glasses are given in Table 1.
Fe2+/Fetot ratio, determined by Mössbauer spectroscopy,18,19 for all these glasses are given in Table 1.
| Glass | Composition (mol%) | N (cm−3) Fe ions/cm3 | C | R (Å) = N−1/3 |
|---|---|---|---|---|
| a Values for C (Fe2+/Fetot) are taken from ref. 18 and 19. | ||||
| F40 | 40Fe2O3–60P2O5 | 9.63 × 10²¹ | 0.23 | 4.69 |
| Hf-1 | 2HfO2–38Fe2O3–60P2O5 | 9.30 × 10²¹ | 0.25 | 4.75 |
| Hf-2 | 4HfO2–36Fe2O3–60P2O5 | 9.07 × 10²¹ | 0.43 | 4.79 |
| Hf-3 | 6HfO2–34Fe2O3–60P2O5 | — | 0.44 | — |
| Hf-4 | 8HfO2–32Fe2O3–60P2O5 | 8.08 × 10²¹ | 0.40 | 4.98 |
| Ce-1 | 2CeO2–38Fe2O3–60P2O5 | 9.63 × 10²¹ | 0.49 | 4.70 |
| Ce-2 | 4CeO2–36Fe2O3–60P2O5 | 9.28 × 10²¹ | 0.49 | 4.76 |
| Ce-3 | 8CeO2–32Fe2O3–60P2O5 | 8.27 × 10²¹ | 0.43 | 4.94 |
| HfB-1 | 2HfO2–36Fe2O3–2B2O3–60P2O5 | 8.89 × 10²¹ | 0.58 | 4.83 |
| HfB-2 | 4HfO2–34Fe2O3–2B2O3–60P2O5 | 8.64 × 10²¹ | 0.42 | 4.87 |
| HfB-3 | 6HfO2–32Fe2O3–2B2O3–60P2O5 | 7.82 × 10²¹ | 0.47 | 5.04 |
Samples for electrical/dielectric measurements were cut from annealed bars and polished with 600-grit polishing paper. Gold electrodes, 6 mm in diameter, were deposited onto both sides of the samples (∼1 mm thick disks) using a Sputter Coater SC7620. Electrical conductivity and dielectric properties were determined by measuring complex impedance using an impedance analyser (Novocontrol Alpha-AN Dielectric Spectrometer, Novocontrol Technologies GmbH & Co. KG, Hundsangen, Germany) over the frequency range from 0.01 Hz to 1 MHz and temperature range from 303 K to 513 K. The temperature was controlled to an accuracy of ±0.2 K.
Results and discussion
Conductivity spectra
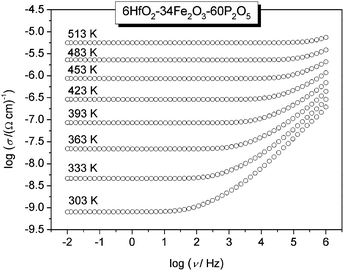
The conductivity isotherms of the 6HfO2–34Fe2O3–60P2O5 (mol%) glass, as the typical conductivity spectra of all glasses in the study, are shown in Fig. 1. Typically, each isotherm exhibits two features; a plateau (DC conductivity) at lower frequencies and dispersion at higher frequencies. The DC conductivity exhibits Arrhenius dependence and hence a characteristic activation energy. The dispersive behaviour, on the other hand, is more visible at lower frequencies at lower temperatures, and shifts to higher frequencies at higher temperatures. In Fig. 1, in our frequency window this is visible at temperatures up to 453 K.In general, conductivity dispersion is characteristic of polaronic as well as of ionic glasses.20–22 This similarity seems to indicate that the dispersion seen in the conductivity spectra is not related to the type of charge carriers but instead it is closely related to the property which all glasses have in common – structural disorder.23,24
A simple description of such conductivity dispersion was given by Jonscher,25,26 and is labelled as the “universal dynamic response”. In this description, DC and AC conductivities are treated as additive terms, with a power law description for the AC part. This description was and is being widely used. However, over time, it was not only found to be an approximate description as the experimental spectra show a continuous increase of the exponent with frequency,20–24 but also found to be somewhat inaccurate.27
A more important line of investigation was devoted to examining the scaling features of the spectra. As a result of decades of research into this question, Isard arrived at a general scaling scheme for the conductivity spectra:28,29
 | (1) |
 where ωO(T) is the angular frequency at the onset of conductivity dispersion for a given temperature, T. Both f and ωO(T) are differently defined by different scaling procedures, and contains important information on factors that govern charge transport in a given system.
In the following section, we first analyse the information obtained from the DC conductivity of our series of glasses, and then address the scaling features of the conductivity and permittivity spectra of the glasses represented in Table 1.
DC conductivity
It is well known that above room temperature, conduction in iron phosphate based glasses is due to phonon assisted hopping of polarons between nearest neighbouring sites,6,7 and the DC conductivity shows an Arrhenius temperature dependence, Fig. 2.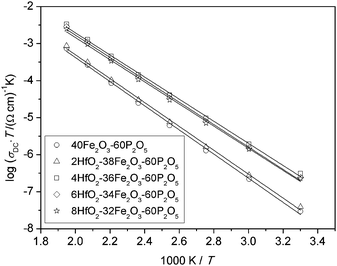 | ||
| Fig. 2 Arrhenius plot for xHfO2–(40 − x)Fe2O3–60P2O5, (0 ≤ x ≤ 8 mol%) glasses. Solid lines represent the least-square linear fits to experimental data. | ||
It is evident from this plot and Table 1 that glasses with a low C value (∼0.25) have lower DC conductivities as well as higher activation energies compared to the other three glasses (C ∼ 0.40). Below, we analyse the temperature dependence of DC conductivity as usually interpreted by Mott's equation:6,8
 | (2) |
All glasses in our study show an Arrhenius temperature dependence, as shown in Fig. 2 for glasses from the Hf-series. The values of the activation energy for all glasses are between 56 and 62 kJ mol−1, see Table 2. These values are typical for iron phosphate based glasses.10,31
| Glass | W (kJ mol−1) | exp(−2αR) | α (Å−1) |
|---|---|---|---|
| F40 | 62.40 | 1.98 × 10⁻² | 0.42 |
| Hf-1 | 61.75 | 1.92 × 10⁻² | 0.42 |
| Hf-2 | 57.13 | 1.90 × 10⁻² | 0.41 |
| Hf-3 | 57.85 | — | — |
| Hf-4 | 57.25 | 1.55 × 10⁻² | 0.42 |
| Ce-1 | 56.23 | 2.76 × 10⁻² | 0.38 |
| Ce-2 | 56.20 | 3.21 × 10⁻² | 0.36 |
| Ce-3 | 58.18 | 1.53 × 10⁻² | 0.42 |
| HfB-1 | 62.23 | 1.27 × 10⁻² | 0.45 |
| HfB-2 | 57.08 | 1.73 × 10⁻² | 0.42 |
| HfB-3 | 57.57 | 1.63 × 10⁻² | 0.41 |
In the theory of small-polaron transport, a distinction is made between adiabatic hopping, in which the electron is at all times relaxed in the potential well of its lattice distortion and hence can respond rapidly to the displacement of the lattice due to the polarization field, and non-adiabatic hopping, in which the chance of the electron tunnelling is rather small.8 In adiabatic hopping conduction, the tunnelling term exp(−2αR) in eqn (2) is approximately 1, thus αR is usually negligible. Although in the literature there has been much discussion whether an adiabatic or non-adiabatic hopping picture is valid at high temperatures5,6 it was shown recently in a straightforward manner from DC conductivity data that the non-adiabatic hopping model is more suitable to describe polaron transport in iron phosphate based glasses.32
Accordingly, we have calculated the tunnelling factor (see Table 2) from the pre-exponential term which can be read off from Fig. 2, assuming that the phonon frequency is 1013 Hz.6,32 For all glasses, it is then found that the term exp(−2αR) is much smaller than 1, confirming non-adiabatic hopping. Also, the calculated values for α are between 0.36 Å−1 and 0.45 Å−1 which is consistent with those for similar glass systems.8,32,33
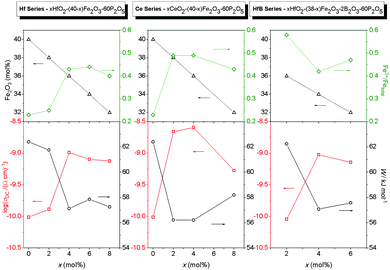
We now wish to consider in some detail the relation between the DC conductivity and the absolute iron oxide content and the relative fraction of Fe2+ ions. In Fig. 3 we show three sets of plots for each series of glasses that we have studied. In each set, in the bottom panel DC conductivities at 303 K (squares) and the corresponding activation energies (circles) for the various glass compositions are presented. In the top panel of each set of plots, the total Fe2O3 content (triangles) and Fe2+/Fetot ratio (diamond) are plotted. For glasses in the xHfO2–(40 − x)Fe2O3–60P2O5 and xCeO2–(40 − x)Fe2O3–60P2O5 series, DC conductivity shows an identical trend as changes in the Fe2+/Fetot ratio indicating that polaronic transport strongly depends on the concentration of Fe2+ ions. Although the Fe2O3 content within these series slightly decreases, from 40 to 32 mol%, a significant increase in the fraction of Fe2+ ions from 23% to 44% is observed. On the other hand, the changes for xHfO2–(38 − x)Fe2O3–2B2O3–60P2O5 glasses are different. The HfB-1 glass with 58% of Fe2+ ions shows conductivity as low as that of the binary F40 glass. If we take into account that polaron transfer occurs between Fe2+ and Fe3+ ions, and if the glass structure is homogeneous, implying that all iron ions contribute equally in the transport process, it is expected that the conductivity will go through a maximum when the ratio Fe2+/Fetot = 0.5, i.e. when there is an equal number of Fe2+ and Fe3+ ions. For the glasses in the HfB series, an increase in conductivity with decreasing fraction of Fe2+ from 58% to 42% is seen, while at about 48% the conductivity decreases slightly. From previous studies of binary iron glasses6,11,34 and Cr2O3–PbO–Fe2O3–P2O5 glasses35 it is known that the maximum of conductivity is found at approximately Fe2+/Fetot ≈ 0.5. In contrast, the observed trend in conductivity for the three compositions in the HfB glass series is not easy to explain, and can only be attributed to the structural features due to the presence of borate units.32
Frequency-dependent conductivity and scaling properties
 We present below a brief overview of scaling procedures which are model-free or based on models and have been applied in scaling the conductivity spectra of single alkali oxide glasses. One of the simplest scaling procedures was given by Summerfield36 for the case where σDC·T and onset frequency of conductivity dispersion, ν0 (defined as that frequency where σ′(ν0) = 2σDC) are proportional to each other. Connecting these onset frequencies in a log–log plot yields a straight line with a slope of one. Hence, one can scale the conductivity spectra by plotting them as:
  . Since both DC conductivity and diffusion in ion conducting glasses are thermally activated and are related to each other by the Nernst–Einstein relation, this is thus mobility scaling, and the only role of temperature is to speed up the ion dynamics (higher temperature) or slow it down (lower temperature) without changing the mechanism of conduction. Further, it is found that such scaled master curves of single alkali oxide glasses could be scaled on to a super-master curve using this procedure, using the formula:
  , where n is the alkali oxide content.37
The other procedure is Sidebottom scaling,38 where scaling is obtained by plotting  . Here, Δε = ε(0) − ε(∞) is called the dielectric strength and is given by the difference in low-frequency permittivity plateaux and the high-frequency permittivity caused by vibration and electronic polarization. Since Δε is a direct consequence of the relaxation of the hopping species, Sidebottom scaling takes into account both changes in the number density as well as changes in the typical hopping distance of the mobile species. While Summerfield scaling has found wide application due to the simplicity of the procedure and the information it yields, Sidebottom scaling has been called the general version of TTS30 and this scaling works for superposing master curves on to a super master-curve, if the shape of the spectra is the same.39
Recently, it was found in sodium borophosphate glasses,40 where the sodium content is high but constant and the relative content of the mixed glass formers is varied, that although the shape of the master curves is the same, a super-master curve is obtained only on shifting the master curves on to one another by a shift factor, fsh:  . This shift factor shows a variation similar to the variation of the hopping length as a function of composition.40 While Nv, the number density of sodium ions, increased almost linearly with the B2O3 content the variation of the hopping length could be correlated well to the increase in the number of four coordinated boron units,41 which provided the mobile alkali ion with a fairly shallow potential landscape to facilitate its hopping. This scaling feature reveals yet another close connection between structure and dynamics. Thus, it is evident that the scaling features of the conductivity spectra hold a wealth of information about how the structure and number density of charge carriers influence conductivity.
As explained earlier in the Experimental section, the number density of iron ions, N, and hence the mean separation between iron ions, R, depends on the glass composition and density. The fraction of ferrous ions, C, however, depends on various factors that influence the glass preparation procedure which are explicitly mentioned in the Introduction section. Here, in our systems all the three parameters change (cf.Table 1). It would be interesting to see which of these quantities emerge as relevant parameters in scaling the conductivity spectra of our polaronic glasses.
Information on the shape of the conductivity spectra
In order to ascertain which scaling scheme would work best for our systems, we examine the shape of the conductivity spectra. In contrast to polaronic glasses where conductivity dispersion has been mostly described by the power law, there are several models for ionic transport in oxide glasses. Principally, these models are based either on random barrier/random energy or on jump relaxation. The formulation, merits, applications and implications of these models are summarised in two recent reviews.23,24 To give their philosophies in brief: random barrier (RBM) and random energy models treat the ion hopping in a disordered but static energy landscape and explain conduction as a hopping over barriers until a critical “percolation” energy barrier is crossed for describing a successful hop. All interactions between ions are ignored, except for having influenced the distribution of energy sites. The RBM is able to generate the conductivity spectrum by using an equation which according to the authors captures the essential feature of ion dynamics.On the other hand, the MIGRATION concept,24,42,43 which is an acronym for mismatch generated relaxation for accommodation and transport of ions, belongs to the class of jump relaxation models44 and is able to model the experimental conductivity spectra more accurately. In this model, following an initial hop of the central ion at t = 0, relaxation of both the central ion and the neighbouring mobile ions occurs simultaneously. In order to describe the rate of these relaxations at t > 0, two functions of time are introduced: W(t) is used to describe the relaxation along the single-particle route; g(t) is the mismatch-function, which is a normalised dipole moment whose initial magnitude is given by where the central ion is after a hop to where its neighbours expect it to be, and whose decay describes the relaxations along the many-particle route. Accordingly, W(0) = 1, while W(∞) ≠ 0, signifying that a fraction of hops are successful. On the other hand, g(0) = 1, while g(∞) = 0, implying that at long times both its magnitude and the range of its field decays to zero. To describe this more exactly, a third function, N(t), is introduced, since the number of mobile ions in the neighbourhood that respond to the dipole-field becomes time-dependent. However, it is possible that the nearest neighbours to the central ion are never shielded from the shrinking dipole field, but are still responding to the initial hop of the central ion at long times. This is specified by a parameter, N(∞). From the above considerations, the authors formulate the equations of the model:
 | (3) |
![[thin space (1/6-em)]](https://www.rsc.org/images/entities/char_2009.gif) W(∞). The parameter, Γ0, is defined as the rate of elementary hops. The parameter K describes the nature of response to the hop of the “central” ion. For example, if the response of the neighbourhood is collective, such as in a melt or a liquid electrolytes, then N(t) is time-independent and is equal to N(∞). However, for K > 1, the decay of N(t) is proportional to or faster than g(t), and is exactly equal to g(t) for K = 2.
W(∞). The parameter, Γ0, is defined as the rate of elementary hops. The parameter K describes the nature of response to the hop of the “central” ion. For example, if the response of the neighbourhood is collective, such as in a melt or a liquid electrolytes, then N(t) is time-independent and is equal to N(∞). However, for K > 1, the decay of N(t) is proportional to or faster than g(t), and is exactly equal to g(t) for K = 2.
A numerical solution to the set of equations denoted as eqn (3) is then obtained for W(t). A scaled notation is used: Ws(ts) = W(ts)/W(∞), ts = t·ωO & ωs = ω/ωO, where ωO is defined by ωO = Γ0W(∞) = Γ0![[thin space (1/6-em)]](https://www.rsc.org/images/entities/char_2009.gif) exp(−B), and can be viewed as the “rate of successful hops” at a long time t. Thus, Ws(ts) is obtained by solving the equation:
exp(−B), and can be viewed as the “rate of successful hops” at a long time t. Thus, Ws(ts) is obtained by solving the equation:
 | (4) |
 | (5) |
Ascertaining this shape parameter of the conductivity spectrum serves two purposes: (i) it gives information about the ease of charge transport in glasses and (ii) depending on whether it is constant or not, as discussed earlier, it gives us a handle to examine what information we can expect from shift factors when super-master curves are constructed using the Summerfield scaling procedure.
Relevance of the MIGRATION concept to polaronic conduction
Although the MIGRATION concept was introduced for modelling ionic conductivity spectra, we note that it has relevance for modelling the conductivity of polaronic glasses. Firstly, in our polaronic glasses, the polarisation field caused by the hopping polaron is to first order a dipole field. Further, when the polaron hops, it changes the valence of the ferrous ion to a ferric ion. A further hop depends on the valence of the neighbouring ions. If iron ions with suitable valencies are unavailable then the neighbourhood relaxations do not provide suitable sites for electron transport, thereby significantly reducing the success of the individual attempts, and hence the magnitude of DC conductivity could fall drastically. This could be the origin of conductivity dispersion in polaronic glasses. The structure plays an indirect role, as also the dipole field around the polaronic cavity.Scaling features of the conductivity spectra of polaronic glasses
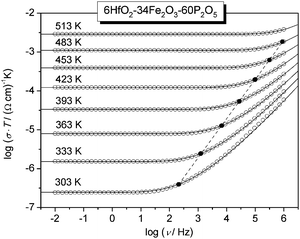
Fig. 4 shows the conductivity spectra displayed in Fig. 2 with additionally the model spectra modelled using the MIGRATION concept. For each isotherm, the logarithm of the frequency of onset of conductivity dispersion, log![[thin space (1/6-em)]](https://www.rsc.org/images/entities/char_2009.gif) νO, is determined directly by shifting the normalised experimental conductivity isotherms, log(σ(ν)/σDC) on to the model curve. By doing this, we are able to identify which shape parameter matches the shape of the experimental conductivity spectra around the onset of conductivity dispersion. As is seen from Fig. 4, the model curve corresponding to K = 1.9 reproduces the experimental conductivity isotherms very well. Further, the frequencies of onset of conductivity dispersion determined using the model curve lie on a straight line with a slope of 1 and hence a master curve can be constructed for this glass by superimposing isotherms along this line (cf. Scaling procedures section). This implies that for a given glass not only are DC and AC conductivity part of the same process, but also both hopping length and charge carrier concentration are not dependent on temperature (cf.eqn (1)). Moreover, we also find that for all glasses studied here, the isotherms can be successfully modelled with K = 1.9, see Table 3. Here, a remark is in order. Typically, the parameter K takes a value slightly larger than 1 in molten electrolytes, while K = 2 is typical for many single alkali-ion conducting systems.24 A value of K = 1.9 is found for ionic liquids.24 Since polaronic conductivity involves charge transport via electrons, albeit in a glassy matrix, it is interesting to note that the onset of DC conductivity from its dispersive feature indicating correlated forward–backward hopping sets in faster like in the case of ionic liquids.
νO, is determined directly by shifting the normalised experimental conductivity isotherms, log(σ(ν)/σDC) on to the model curve. By doing this, we are able to identify which shape parameter matches the shape of the experimental conductivity spectra around the onset of conductivity dispersion. As is seen from Fig. 4, the model curve corresponding to K = 1.9 reproduces the experimental conductivity isotherms very well. Further, the frequencies of onset of conductivity dispersion determined using the model curve lie on a straight line with a slope of 1 and hence a master curve can be constructed for this glass by superimposing isotherms along this line (cf. Scaling procedures section). This implies that for a given glass not only are DC and AC conductivity part of the same process, but also both hopping length and charge carrier concentration are not dependent on temperature (cf.eqn (1)). Moreover, we also find that for all glasses studied here, the isotherms can be successfully modelled with K = 1.9, see Table 3. Here, a remark is in order. Typically, the parameter K takes a value slightly larger than 1 in molten electrolytes, while K = 2 is typical for many single alkali-ion conducting systems.24 A value of K = 1.9 is found for ionic liquids.24 Since polaronic conductivity involves charge transport via electrons, albeit in a glassy matrix, it is interesting to note that the onset of DC conductivity from its dispersive feature indicating correlated forward–backward hopping sets in faster like in the case of ionic liquids.
| Glass | N v (cm−3) | K | log(fshift) | (Δε·T)a (K) | 〈rLOC2(∞)〉1/2 (Å) | r p (Å) |
|---|---|---|---|---|---|---|
| a The average error is about 4%. | ||||||
| F40 | 2.22 × 10²¹ | 1.9 | 0 | 4616 | 2.44 ± 0.04 | 1.89 |
| H-1 | 2.33 × 10²¹ | 1.9 | 0 | 4262 | 2.29 ± 0.04 | 1.92 |
| Hf-2 | 3.90 × 10²¹ | 1.9 | 0.20 | 6174 | 2.13 ± 0.07 | 1.93 |
| Hf-3 | — | 1.9 | 0.16 | 6141 | — | — |
| Hf-4 | 3.23 × 10²¹ | 1.9 | 0.16 | 5674 | 2.24 ± 0.05 | 2.01 |
| Ce-1 | 4.72 × 10²¹ | 1.9 | 0.16 | 5823 | 1.88 ± 0.03 | 1.89 |
| Ce-2 | 4.55 × 10²¹ | 1.9 | 0.21 | 6588 | 2.03 ± 0.02 | 1.92 |
| Ce-3 | 3.56 × 10²¹ | 1.9 | 0.13 | 5685 | 2.14 ± 0.03 | 1.99 |
| HfB-1 | 3.73 × 10²¹ | 1.9 | 0.06 | 5048 | 1.97 ± 0.01 | 1.94 |
| HfB-2 | 3.63 × 10²¹ | 1.9 | 0.20 | 7914 | 2.49 ± 0.06 | 1.96 |
| HfB-3 | 3.68 × 10²¹ | 1.9 | 0.13 | 5687 | 2.10 ± 0.03 | 2.03 |
Continuing with the examination of scaling features, it is clear that for all our glasses it should be possible to generate a super-master curve. On the other hand, we know that DC conductivity depends on the fraction of ferrous ions. To gain insight into how the change in number density of ferrous ions affects the measured conductivities of glasses for various compositions, we attempt at first the construction of a master curve in a model-free47 way by employing the Summerfield scaling procedure.36Fig. 5 shows such a master curve corresponding to the conductivity isotherms of the 6HfO2–34Fe2O3–60P2O5 (mol%) glass from Fig. 1.
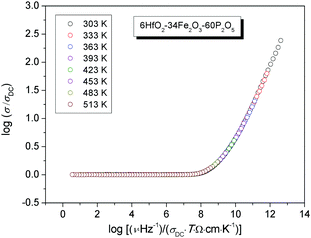 | ||
| Fig. 5 Conductivity spectra of the 6HfO2–34Fe2O3–60P2O5 (mol%) glass scaled according to the Summerfield scaling procedure. | ||
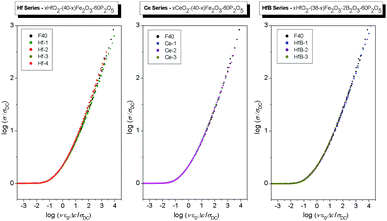
As a next step, we superimpose the conductivity master curves of all glasses within each series, see Fig. 6. It is clearly seen that while for a given composition the scaling works, the master curves of glasses within each series do not fall in the same curve. For the Hf series, the master curves of Hf-2, Hf-3 and Hf-4 glasses are shifted to lower values of ν/(T·σDC) relative to F40 and Hf-1 glasses. Similarly, both in Ce and HfB series the master curves of all glasses are shifted to lower values of ν/(T·σDC) relative to the F40 glass.
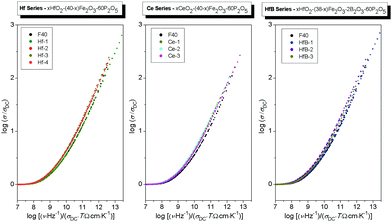
Since the shape parameter is the same (K = 1.9, see Table 3) the master curves can be superimposed to obtain a super-master curve when each individual master curve is suitably shifted along the x-axis, see Fig. 7. The shift factor in the logarithmic scale, log(fshift), for all these glasses, determined relative to the master curve of the F40 glass, is listed in Table 3. The F40 glass is chosen as the reference glass since it has the lowest fraction of Fe2+ ions, see Table 1.
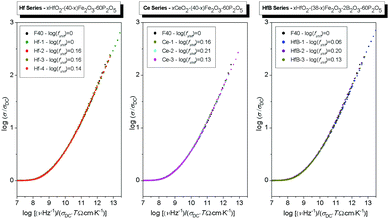 | ||
| Fig. 7 Conductivity master curves for the glass series: xHfO2–(40 − x)Fe2O3–60P2O5 (0 ≤ x ≤ 8 mol%), xCeO2–(40 − x)Fe2O3–60P2O5 (0 ≤ x ≤ 8 mol%) and xHfO2–(38 − x)Fe2O3–2B2O3–60P2O5 (2 ≤ x ≤ 6 mol%) suitably shifted along the x-axis. The shift factors in the logarithmic scale, log(fshift), for all glasses are indicated in the legends and also listed in Table 3. | ||
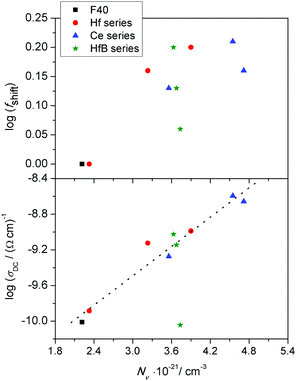
We now examine the correlation between log(fshift) and the changes in the number density of charge carriers, Nv. According to the literature on polaronic glasses,5,6 this carrier concentration is determined by the product of number density of iron ions and fraction of ferrous ions, (N·C). We also mentioned earlier that it is a well-known fact that in iron phosphate glasses, the conductivity maximum is observed at Fe2+/Fetot ≈ 0.5. In our systems, there is only one glass composition with a higher fraction of Fe2+ ions, namely HfB-1 with a value of 0.58 (see Table 1). We can safely assume that for this glass system, the relevant concentration to be considered is that of the ferric ions, N(1 − C). Accordingly, in Fig. 8, in two panels we show the variation of log(σDC) and log(fshift) as a function of the charge carrier number density, Nv.
From Fig. 8, we see that with increasing number density of charge carriers, the logarithm of DC conductivity increases almost linearly, except for the glass system HfB-1 with Fe2+/Fetot = 0.58 which shows a significantly lower value. It could be that in a ferrous-rich glass there is an inhomogeneous distribution of ferrous and ferric ions. This might then imply that a significant fraction of ferrous ions may not be able to contribute to the polaron transport. From the top panel of Fig. 8, we see that the logarithm of the shift factor for scaling the conductivity master curves, log(fshift), exhibits rather a scattered than a linear trend, which suggests that its origin cannot be related entirely to the changes in the charge carrier number density. This leads us to consider an alternative scaling procedure proposed by Sidebottom,38 see the description in the Scaling procedures section, which takes into account both changes in the number density as well as changes in the typical hopping distance of mobile species. In order to do this, we now turn to examine the information available from the permittivity spectra.
Frequency-dependent permittivity and scaling properties
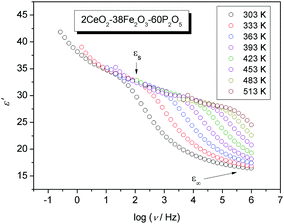
The frequency dependence of the real part of the permittivity for the 2CeO2–38Fe2O3–60P2O5 (mol%) glass at different temperatures is shown in Fig. 9, as is typical for the permittivity spectra of all glasses in the study.We see that at higher frequencies, the real part of the permittivity tends to a constant value, ε∞, which results from rapid polarization processes occurring in the glasses under an applied field. With decreasing frequency, however, the real part of the permittivity increases and approaches a limiting low-frequency plateau, εs, denoted as the low-frequency static value, associated with the polarization effects of the ions or polarons with respect to the immobile glass matrix. As defined in the previous section the magnitude of this polarization is the difference between the static and high-frequency permittivity, Δε = εs − ε∞, and is called dielectric strength. Fig. 9 shows that the spectra at higher temperatures have a lower plateau value for εs, which agrees well with data obtained for iron borophosphate glasses32 and various ionic glass systems.40 Also, in the case of polaronic glasses shown here the low-frequency plateau is well defined, which is often not the case for ionic glasses where a significant electrode polarization dominates at lower frequencies swamping the detection of εs. In comparison to εs, ε∞ is only weakly temperature-dependent. Therefore, the dielectric strength for polaronic glasses can be determined directly from the experimental spectra.
We now consider Sidebottom scaling,38 see the Scaling procedures section for details. Here, the parameters needed from experimental data for scaling the frequency axis are the DC conductivity and the dielectric strength, and the universal constant, the permittivity of free space. To the best of our knowledge, Sidebottom scaling is being applied for the first time for scaling the conductivity spectra of polaronic glasses, and remarkably, it yields a super-master curve for all systems considered in this study. For clarity, we plot this for each series separately as shown in Fig. 10. It is interesting to note that this scaling works for the HfB-1 glass composition despite its low DC conductivity. This clearly indicates that for all our systems not only the charge carrier concentration, but also the typical length of a polaron hop changes.
As noted earlier, Sidebottom employed this procedure for ionic conduction. One good reason why this scaling is relevant for polaronic transport might be the fact that the onset frequency of conductivity dispersion, ν0 = σDC/(ε0Δε), describes the characteristic rate of decay of thermally driven deviations from local charge neutrality due to displacement of mobile ions.38 Although in polaronic glasses the mobile species are electrons, effects that influence ν0 described above could also influence both the Wh and Wd, see eqn (2), and hence the activation energy, since in our glass systems we have non-adiabatic polaron hopping, see the DC conductivity section.
Relevant length scales for polaronic transport in glasses
In the theory of polaronic transport there are two relevant length scales. One is the average distance between iron ions, R, and the other is the polaron radius, rp, which is the radius of the polaron cavity, and indicates the localized extent of the polarization field experienced by the electron as it hops from Fe2+ to Fe3+ ion. The determination of the polaron radius in polaronic glasses is not an easy task and the usual approach is to adopt5,33 the equation proposed by Bogomolov and Mirilin for polarons in crystalline TiO2:48 | (6) |
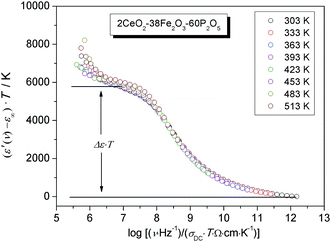
As expected, similarly to the scaled conductivity master curve, the permittivity isotherms also yield a master curve showing that for permittivity too, the time-temperature superposition principle is satisfied. The resulting value of Δε·T (albeit with a small dispersion) is a material specific property, from which the spatial extent of localized motion of charge carriers, 〈rLOC2(∞)〉1/2 is extracted using the following relation:53
 | (7) |
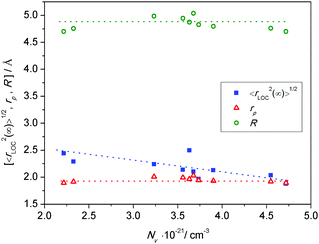
At this point, a couple of comments are in order. This equation, although it uses only experimental data, emerges from the use of the leitmotif of the MIGRATION concept which considers the hop of a central charge-carrier and relaxation along both many-particle and single-particle routes of the mobile species. Thus, the influence of all displacements is effectively built into the rate equations of the model from which both diffusive and localized diffusive behaviours can be ascertained. In a review paper, Dyre et al.23 have also suggested an expression for extracting a spatial extent of non-random diffusion, which at long times will yield a quantity similar to what is given by eqn (7). However, in their expression, the authors have used a Jonscher power-law exponent. In our procedure so far, we have not considered this exponent in modelling the conductivity spectra for reasons discussed elsewhere.27,54 The second comment pertains to the number density of charge carriers, Nv. As explained in an earlier section, cf. discussions in Fig. 8, the relevant charge carrier density is the number density of ferrous ions in all cases but for the HfB-1 glass system. The values of Δε·T and 〈rLOC2(∞)〉1/2 derived from eqn (7) are listed in Table 3. From this table, no clear correlation is seen for Δε·T versus Nv or the shift factor, log(fshift). In Fig. 12, we have plotted the two well-known length scales, namely R and rpversus the number density of charge carriers. The spatial extent of localized motion of polarons, 〈rLOC2(∞)〉1/2 is also plotted.
From Fig. 12 two things are evident. The values of 〈rLOC2(∞)〉1/2 are very close to the values of the polaron radius. Also, 〈rLOC2(∞)〉1/2 is much smaller than the average distance between iron ions, R. Further, both rp and R show a clear N−1/3 dependence (by virtue of their definitions); however when plotted as in Fig. 12versus the charge carrier number density, Nv, they show practically no dependence. In contrast, 〈rLOC2(∞)〉1/2 shows an evident decrease with the increase of Nv with a slope closer to 0.26 rather than one-third.
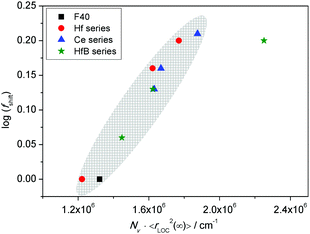
In sodium germanate glasses52 while 〈rLOC2(∞)〉1/2 decreased with increasing Nv, it also showed a clear Nv−1/3 dependence, indicating that the local dynamics was largely influenced by Coulomb interactions between the mobile ions. On the other hand, in sodium borophosphate glasses while Nv increased with composition, the dependence of both 〈rLOC2(∞)〉1/2 and DC conductivity as a function of composition could be correlated to the structural changes.53 In our glasses we find that the logarithm of DC conductivity increases linearly as a function of Nv, while 〈rLOC2(∞)〉1/2 decreases only slightly. The fact that Sidebottom scaling yields a super-master curve led us to examine the correlation between the log(fshift) obtained from the Summerfield scaling procedure and the product Nv〈rLOC2(∞)〉, see Fig. 13.
Indeed, we find that they are well correlated exhibiting a nearly linear increase. To recall a similar effect, in sodium borophosphate glasses, both log(fshift) and Nv〈Rp2〉, where Rp is a characteristic hopping length, showed a similar variation as a function of increasing borate content.40 This was also confirmed to be the case for the spatial extent of localized ionic motions 〈rLOC2(∞)〉1/2 in these glasses.53 The co-regression shown in Fig. 13 seems to indicate that in our glasses also the structure influences polaronic transport. It is comforting to find that the values of 〈rLOC2(∞)〉1/2 obtained from the permittivity spectra using eqn (7) give a realistic estimate of the extent of the polarisation cloud from the polaron dynamics, and mirrors the information obtained from the structure, namely rp, making it the relevant length scale in contrast to R.
Conclusions
In this article, we have considered in detail the electrical properties displayed by iron phosphate glasses containing hafnium and cerium oxides. Although their electrical properties were not the primary focus, the body of data has provided us with the possibility of a detailed analysis of polaronic conduction in these glasses, especially since the concentration of ferrous ions showed a wide variation. We believe that this is the first time polaron transport has been discussed at length using a terminology equivalent to that of ionic conduction in materials with structural disorder. Further, modelling the conductivity spectra using the MIGRATION concept we find that the shape parameter describing conductivity dispersion has a value less than two, implying that the long-range electrical transport in polaronic glasses sets in relatively faster compared to transport in ionic glasses and similar to what is observed in ionic liquids.A detailed consideration of the scaling features of frequency-dependent conductivity and permittivity in these systems showed that the Sidebottom scaling procedure yields a super-master curve, implying that while the time-temperature superposition principle is fulfilled, polaronic hopping lengths also change with changing number density of charge carriers. Further, the spatial extent of local excursions of the polaron calculated from the scaled permittivity spectra is much closer in value to the polaronic radius calculated as per the equation proposed by Bogomolov and Mirilin than to the mean separation between iron ions. Interestingly, the spatial extent for localized polaronic hopping shows a tendency to decrease with increasing charge carrier number density, while no such tendency is observed for the polaron radius calculated from the glass composition and density.
In order to gain deeper insights into polaron transport it would be interesting to model and analyse various features of the electrical properties in a similar way for binary iron phosphate glasses as well as for mixed ion-polaron conducting glasses with varying charge carrier concentrations over a wider range of temperatures and frequencies.
Acknowledgements
This work was supported by the Croatian Science Foundation (project no. IP-09-2014-5863 HRZZ) and the Scientific and Technological Research Council of Turkey (TUBiTAK) with project no. 111M768. RDB acknowledges gratefully the financial support of the NEWFELPRO project under grant agreement no. 80. We thank David Sidebottom for a close reading of our manuscript and for his favourable opinion of our results.References
- D. E. Day, Z. Wu, C. S. Ray and P. Hrma, J. Non-Cryst. Solids, 1998, 241, 1 CrossRef CAS.
- M. G. Mesko, D. E. Day and B. C. Bunker, Science and Technology for Disposal of Radioactive Tank Wastes, Plenium Press, New York, 1997, p. 379 Search PubMed.
- X. Yu, D. E. Day, G. J. Long and R. K. Brow, J. Non-Cryst. Solids, 1997, 215, 21 CrossRef CAS.
- G. N. Greaves, S. J. Gurman, L. F. Gladden, C. A. Spence, P. Cox, B. C. Sales, L. A. Boatner and R. N. Jenkins, Philos. Mag. B, 1988, 58, 271 CAS.
- M. Sayer and A. Mansingh, Phys. Rev. B: Solid State, 1972, 6, 4629 CrossRef CAS.
- L. Murawski, C. H. Chung and J. D. Mackenzie, J. Non-Cryst. Solids, 1979, 32, 91 CrossRef CAS.
- N. F. Mott, J. Non-Cryst. Solids, 1968, 1, 1 CrossRef CAS.
- A. I. G. Austin and N. F. Mott, Adv. Phys., 1969, 18, 41 CrossRef.
- A. Moguš-Milanković, D. E. Day and B. Šantić, Phys. Chem. Glasses, 1999, 40, 69 Search PubMed.
- A. Šantić and A. Moguš-Milanković, Croat. Chem. Acta, 2012, 85, 245 CrossRef.
- X. Fang, C. S. Ray, A. Moguš-Milanković and D. E. Day, J. Non-Cryst. Solids, 2001, 283(1), 162 CrossRef CAS.
- L. Murawski, J. Mater. Sci., 1982, 17, 2155 CrossRef CAS.
- G. K. Marasinghe, M. Karabulut, C. S. Ray, D. E. Day, M. G. Shumsky, W. B. Yelon, C. H. Booth, P. G. Allen and D. K. Shuh, J. Non-Cryst. Solids, 1997, 222, 144 CrossRef CAS.
- L. Zhang, R. K. Brow, M. E. Schlesinger, L. Ghussn and E. D. Zanotto, J. Non-Cryst. Solids, 2010, 356, 1252 CrossRef CAS.
- C. S. Ray, X. Fang, M. Karabulut, G. K. Marasinghe and D. E. Day, J. Non-Cryst. Solids, 1999, 249(1), 1 CrossRef CAS.
- A. Moguš-Milanković, A. Šantić, S. T. Reis, K. Furić and D. E. Day, J. Non-Cryst. Solids, 2004, 342(1–3), 97 CrossRef.
- B. Dutta, N. A. Fahmy and I. L. Pegg, J. Non-Cryst. Solids, 2005, 351, 1958 CrossRef CAS.
- M. Karabulut, C. Aydin, H. Ertap and M. Yüksek, J. Non-Cryst. Solids, 2015, 411, 19 CrossRef CAS.
- M. Karabulut, H. Ertap and M. Yüksek, J. Non-Cryst. Solids, 2015, 417–418, 39 CrossRef CAS.
- J. C. Dyre, J. Appl. Phys., 1988, 64, 2456 CrossRef.
- K. Funke, C. Cramer, B. Roling, T. Saatkamp, D. Wilmer and M. D. Ingram, Solid State Ionics, 1996, 85(1–4), 293 CrossRef CAS.
- C. Cramer, K. Funke, B. Roling, T. Saatkamp, D. Wilmer, M. D. Ingram, A. Pradel, M. Ribes and G. Taillades, Solid State Ionics, 1996, 86–88, 481 CrossRef CAS.
- J. C. Dyre, P. Maass, B. Roling and D. L. Sidebottom, Rep. Prog. Phys., 2009, 72, 046501 CrossRef.
- K. Funke, R. D. Banhatti, D. M. Laughman, L. G. Badr, M. Mutke, A. Šantić, W. Wrobel, E. M. Fellberg and C. Biermann, Z. Phys. Chem., 2010, 224, 1891 CrossRef CAS.
- A. K. Jonscher, Phys. Status Solidi A, 1975, 32, 665 CrossRef CAS.
- A. K. Jonscher, Nature, 1977, 267, 673 CrossRef CAS.
- K. Funke, P. Singh and R. D. Banhatti, Phys. Chem. Chem. Phys., 2007, 9, 5582 RSC.
- H. E. Taylor, Trans. Faraday Soc., 1956, 52, 873 RSC.
- J. O. Isard, J. Non-Cryst. Solids, 1970, 4, 357 CrossRef CAS.
- T. B. Schrøder and J. C. Dyre, Phys. Rev. Lett., 2000, 84, 310 CrossRef PubMed.
- L. Murawski and R. J. Barczyński, Solid State Ionics, 2005, 176, 2145 CrossRef CAS.
- A. Moguš-Milanković, L. Pavić, H. Ertap and M. Karabulut, J. Am. Ceram. Soc., 2012, 95(6), 2007 CrossRef.
- L. Murawski and O. Growski, Acta Phys. Pol., 1976, 50, 463 Search PubMed.
- K. W. Hansen, J. Electrochem. Soc., 1965, 112, 994 CrossRef CAS.
- A. Šantić, Ž. Skoko, A. Gajović, S. T. Reis, D. E. Day and A. Moguš-Milanković, J. Non-Cryst. Solids, 2011, 357, 3578 CrossRef.
- S. Summerfield, Philos. Mag. B, 1985, 52, 9 Search PubMed.
- B. Roling, A. Happe, K. Funke and M. D. Ingram, Phys. Rev. Lett., 1997, 78(11), 2160 CrossRef CAS.
- D. L. Sidebottom, Phys. Rev. Lett., 1999, 82(18), 3653 CrossRef CAS.
- B. Roling and C. Martiny, Phys. Rev. Lett., 1999, 249, 201 CAS.
- D. Zielniok, PhD thesis, University of Münster, 2006.
- D. Zielniok, H. Eckert and C. Cramer, Phys. Rev. Lett., 2008, 100, 03591 CrossRef PubMed.
- K. Funke and R. D. Banhatti, Solid State Ionics, 2004, 169, 1 CrossRef CAS.
- K. Funke and R. D. Banhatti, Solid State Ionics, 2006, 177, 1551 CrossRef CAS.
- K. Funke, Prog. Solid State Chem., 1993, 22, 111 CrossRef CAS.
- R. Kubo, J. Phys. Soc. Jpn., 1957, 12, 570 CrossRef.
- The parameter N(∞) can be safely ignored as it is important in an accurate modelling of the permittivity spectra.52eqn (4) can be solved in a fairly straightforward manner using standard methods for solving numerical differential equations. Similarly, by using a fine time mesh for Ws(ts), the Fourier transform over several decades can be replaced without a loss of accuracy by a numerical integration of the sine integral, since the other integrand, Ws(ts), varies monotonically and is constant between any two values in a large time mesh.
- The “model-free” scaling procedures refer to analyses performed using the experimental spectra, namely Summerfield and Sidebottom scaling of the conductivity/permittivity spectra.
- V. N. Bogomolov and D. N. Mirilin, Phys. Status Solidi B, 1968, 27, 443 CrossRef CAS.
- B. Roling, C. Martiny and K. Funke, J. Non-Cryst. Solids, 1999, 249, 201 CrossRef CAS.
- B. Roling, C. Martiny and S. Bruckner, Phys. Rev. B: Condens. Matter Mater. Phys., 2001, 63, 214203 CrossRef.
- S. Kabi and A. Ghosh, EPL, 2012, 100, 26007 CrossRef.
- R. D. Banhatti and K. Funke, Solid State Ionics, 2004, 175, 661 CrossRef CAS.
- R. D. Banhatti, C. Cramer, D. Zielniok, A. H. J. Robertson and M. D. Ingram, Z. Phys. Chem., 2009, 223, 1201 CrossRef CAS.
- K. Funke and R. D. Banhatti, Solid State Sci., 2008, 10, 790 CrossRef CAS.
| This journal is © the Owner Societies 2017 |

