Solid form and solubility
Christopher A.
Hunter
 *a and
Rafel
Prohens
b
aDepartment of Chemistry, University of Cambridge, Lensfield Road, Cambridge CB2 1EW, UK. E-mail: herchelsmith.orgchem@ch.cam.ac.uk
bUnitat de Polimorfisme i Calorimetria, Centres Científics i Tecnològics, Universitat de Barcelona, Baldiri Reixac 10, 08028 Barcelona, Spain
First published on 8th December 2016
Abstract
Factors that determine the solubility of polymorphs and cocrystals are analysed using experimental data to show that the change in the solubility of a compound produced by the formation of a multicomponent crystal can be estimated in a straightforward manner, if the solubilities of the pure compound and the coformer are known.
Bioavailability1 is one of the most important issues in the development of a new drug, and water solubility2 is one of the most important parameters that has an impact on the oral bioavailability. Since the fraction of new drug candidates with poor water solubility is very high (≈70%),3 different strategies are being pursued to develop more soluble drugs.4 One option is solid form modification. Amorphous materials and metastable polymorphs have relatively high solubilities, but these materials have associated risks, because they can transform into the most stable and less soluble polymorph during formulation or in storage.5 The use of multicomponent crystals is a promising approach to improving the solubility of an active pharmaceutical ingredient (API) as a stable solid form.6 However, the number of potential coformers available to modify solubility is very high, so there is a need for methods to predict which compounds are likely to form cocrystals and what the impact on solubility is likely to be.7 In this paper, we use experimental data to investigate the relationship between solubility and the free energy differences between different solid forms.
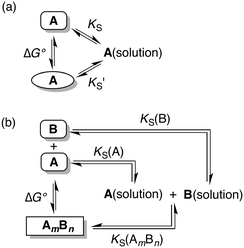
The free energy differences between different solid phases (polymorphs or cocrystals) can be related to solubility products in a specific solvent through the thermodynamic cycles depicted in Fig. 1.
Thus in a polymorphic system the free energy difference between two polymorphs can be directly related to the difference in their solubilities (Fig. 1a, eqn (1)).
 | (1) |
Similarly in a two component cocrystal the free energy difference between the cocrystal and the pure solid phases of the components can be related to the difference between the solubility of the cocrystal and the solubilities of the pure components (Fig. 1b, eqn (2)).
 | (2) |
For polymorphic systems, we have used experimental data on the solubility of 55 different compounds compiled by Pudipeddi et al.8 For cocrystals, we have used the equilibrium cocrystal solubility data for 25 cocrystals reported by Rodriguez-Hornedo et al.,9 because these measurements avoid the potential problems associated with kinetically controlled processes. Free energy differences for these systems were calculated using eqn (1) and (2).
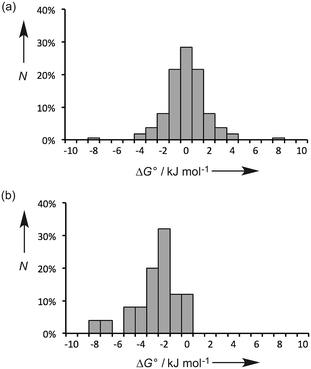
Fig. 2a shows the distribution values of ΔG° for the 55 polymorphic systems. The free energy difference between polymorphs is generally small (≤2 kJ mol−1), and the solubilities of two polymorphs of the same compound tend to be within a factor of 2. This result highlights the difficulty in reliably predicting crystal structures using energy-based approaches, because extremely high accuracy is required. However, the prediction of physical properties like solubility is more straightforward, because in most cases the precise three-dimensional arrangement of the molecules in the crystal structure does not have a major impact on the free energy of the solid (differences in solubility of a factor of 5 have been reported with significant impact on formulation of the API). The free energy of a crystalline solid depends largely on the energies of the functional group interactions that are made, and many different crystal structure arrangements (or polymorphs) can accommodate the same set of functional group interactions, or alternative combinations of equi-energetic functional group interactions.
Fig. 2b shows the distribution values of ΔG° for the 25 cocrystal systems. These data are clearly different from the polymorph systems. In all cases, ΔG° is negative, i.e. the cocrystals are more stable than the pure components, which presumably reflects attractive inter-component interactions that are not possible in the pure forms. The magnitudes of the free energy differences tend to be larger than found for polymorphs (≥2 kJ mol−1), and there is a broader distribution of values. Again this reflects the fact that the intermolecular interactions that are possible in the cocrystal are different from those found in the pure components, which is not the case for polymorphs.
The observations in Fig. 2 have important implications for energy-based approaches to cocrystal prediction. The differences between the energies of the functional group interactions in a cocrystal relative to the pure solid forms (Fig. 2b) tend to be significantly larger than the energetic differences due to the precise three-dimensional arrangement of molecules in crystal structures (Fig. 2a). In other words, accurate crystal structure prediction is not required for accurate prediction of the probability of cocrystal formation.
In addition to prediction of which systems are likely to form cocrystals, it would also be useful to be able to predict the effects of cocrystal formation on solubility. Cocrystal solubility depends on the physical properties of the coformer and cocrystal stoichiometry as well as the free energy difference between the solid forms discussed above. The cocrystal solubility product can be written in terms of the concentration of component A in equilibrium with the solid (eqn (3)).
 | (3) |
If we define this quantity as the cocrystal solubility of A, SCC, substitute into eqn (2) to give eqn (4), and rearrange, the change in the solubility of A associated with cocrystal formation can be written as eqn (5).
 | (4) |
 | (5) |
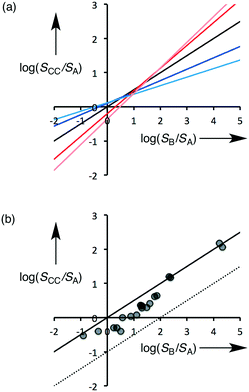
Eqn (5) describes how the change in the solubility of a compound upon cocrystal formation is related to the solubility of the coformer, the cocrystal stoichiometry and the free energy difference between the cocrystal and the pure components. The experimental cocrystal data shown in Fig. 2b suggest that ΔG° tends to be of the order of a few kJ mol−1, so it is possible to plot limiting theoretical relationships between cocrystal solubility (SCC) and coformer solubility (SB) for different cocrystal stoichiometries by assuming a value of zero for ΔG° (Fig. 3a). In general, the solubility of a compound is increased by formation of a cocrystal with a more soluble coformer (and vice versa). The effect can be amplified by forming a cocrystal with a higher stoichiometric ratio of coformer (and vice versa). The relationships in Fig. 3a provide an upper limit on the solubility of a cocrystal, and given the distribution of ΔG° values in Fig. 2b, these values are likely to be accurate to within an order of magnitude. Fig. 3b compares the limiting theoretical relationship for 1![[thin space (1/6-em)]](https://www.rsc.org/images/entities/char_2009.gif) :
:![[thin space (1/6-em)]](https://www.rsc.org/images/entities/char_2009.gif) 1 cocrystals with the experimental data. All of the experimental data fall within an order of magnitude of the theoretical upper limit for cocrystal solubility.
1 cocrystals with the experimental data. All of the experimental data fall within an order of magnitude of the theoretical upper limit for cocrystal solubility.
The good correlation between the theoretical line and the experimental data in Fig. 3b indicates that it should be possible to design cocrystals with a desired solubility properties, provided the solubilities of the potential coformers are known. If there is a large difference between the solubilities of the two components of a cocrystal, the impact of small differences between the free energies of the solid forms will be relatively unimportant. This is particularly significant in the pharmaceutical context, because the water solubility of most APIs is low, and the solubilities of coformers tend to be much higher. Eqn (5) suggests that in general we should expect the solubility of a compound in a 1![[thin space (1/6-em)]](https://www.rsc.org/images/entities/char_2009.gif) :
:![[thin space (1/6-em)]](https://www.rsc.org/images/entities/char_2009.gif) 1 cocrystal to increase in proportion to the square root of the solubility of the coformer, and this is confirmed by the data plotted in Fig. 2b.
1 cocrystal to increase in proportion to the square root of the solubility of the coformer, and this is confirmed by the data plotted in Fig. 2b.
Conclusions
The analysis presented here leads to some general conclusions, which may be useful in the design of new solid forms of compounds with the desired solubility properties:1. The free energy differences between polymorphs (i.e. different packing motifs) are generally small (≤2 kJ mol−1).
2. The free energy differences between cocrystals and the pure component solids (i.e. different functional group interactions) are larger (≥2 kJ mol−1).
3. The solubilities of compounds formulated as cocrystals increase in proportion to the solubility of the coformer.9
4. The effects of coformers on the solubilities of cocrystals increase in proportion to the stoichiometric ratio of coformer in the cocrystal.
5. The free energy differences between cocrystals and the pure component solids have a relatively small effect on cocrystal solubility (less than an order of magnitude).
Observations 1 and 2 suggest that approaches to coformer selection that rely on simple calculations of functional group interaction energies rather than the computationally intensive methods required for accurate crystal structure prediction are likely to be successful. Observations 3–5 suggest that provided the solubilities of the pure components are known, it will be straightforward to estimate the effect of formulation of a compound as a cocrystal on solubility (at least to within an order of magnitude).
Notes and references
- (a) S. R. K. Yellela, J. Bioequivalence Bioavailability, 2010, 2, 28 Search PubMed; (b) R. Censi and P. Di Martino, Molecules, 2015, 20, 18759 CrossRef CAS PubMed; (c) D. F. Veber, S. R. Johnson, H.-Y. Cheng, B. R. Smith, K. W. Ward and K. D. Kopple, J. Med. Chem., 2002, 45, 2615 CrossRef CAS PubMed.
- (a) J. Wang and T. Hou, Comb. Chem. High Throughput Screening, 2011, 14, 328 CrossRef CAS; (b) S. J. Nehm, B. Rodríguez-Spong and N. Rodríguez-Hornedo, Cryst. Growth Des., 2006, 6, 592 CrossRef CAS; (c) D. J. Good and N. Rodríguez-Hornedo, Cryst. Growth Des., 2010, 10, 1028 CrossRef CAS; (d) C. L. Cooke and R. J. Davey, Cryst. Growth Des., 2008, 8, 3483 CrossRef CAS; (e) J. Cassens, F. Ruether, K. Leonhard and G. Sadowski, Fluid Phase Equilib., 2010, 299, 161 CrossRef CAS; (f) G. L. Perlovich, RSC Adv., 2016, 6, 77870 RSC; (g) S. J. Bethune, N. Huang, A. Jayasankar and N. Rodríguez-Hornedo, Cryst. Growth Des., 2009, 9, 3976 CrossRef CAS.
- Y. Kawabata, K. Wada, M. Nakatani, S. Yamada and S. Onoue, Int. J. Pharm., 2011, 420, 1 CrossRef CAS PubMed.
- Drug delivery strategies for poorly water-soluble drugs, ed. D. Douroumis and A. Fahr, John Wiley & Sons Ltd, Oxford, UK, 2013 Search PubMed.
- N. J. Babu and A. Nangia, Cryst. Growth Des., 2011, 11, 2662 CAS.
- (a) C. B. Aakeröy, S. Forbes and J. Desper, J. Am. Chem. Soc., 2009, 131, 17048 CrossRef PubMed; (b) J. X. Song, Y. Yan, J. Yao, J. M. Chen and T. B. Lu, Cryst. Growth Des., 2014, 14, 3069 CrossRef CAS; (c) Y. Yan, J. M. Chen, N. Geng and T. B. Lu, Cryst. Growth Des., 2012, 12, 2226 CrossRef CAS; (d) N. R. Goud, R. A. Khan and A. Nangia, CrystEngComm, 2014, 16, 5859 RSC.
- D. Musumeci, C. A. Hunter, R. Prohens, S. Scuderi and J. F. McCabe, Chem. Sci., 2011, 2, 883 RSC.
- M. Pudipeddi and A. T. M. Serajuddin, J. Pharm. Sci., 2004, 94, 929 CrossRef PubMed.
- D. J. Good and N. Rodriguez-Hornedo, Cryst. Growth Des., 2009, 9, 2252 CAS.
| This journal is © The Royal Society of Chemistry 2017 |


