
 Open Access Article
 This Open Access Article is licensed under a
 Creative Commons Attribution 3.0 Unported Licence
Exploring biomolecular energy landscapes
Jerelle A.
Joseph
 a,
Konstantin
Röder
a,
Debayan
Chakraborty
ab,
Rosemary G.
Mantell
a and
David J.
Wales
*a
a,
Konstantin
Röder
a,
Debayan
Chakraborty
ab,
Rosemary G.
Mantell
a and
David J.
Wales
*a
aDepartment of Chemistry, University of Cambridge, Lensfield Road, Cambridge, CB2 1EW, UK. E-mail: dw34@cam.ac.uk
bDepartment of Chemistry, The University of Texas at Austin, 24th Street Stop A5300, Austin, TX 78712, USA
First published on 2nd May 2017
Abstract
The potential energy landscape perspective provides both a conceptual and a computational framework for predicting, understanding and designing molecular properties. In this Feature Article, we highlight some recent advances that greatly facilitate structure prediction and analysis of global thermodynamics and kinetics in proteins and nucleic acids. The geometry optimisation procedures, on which these calculations are based, can be accelerated significantly using local rigidification of selected degrees of freedom, and through implementations on graphics processing units. Results of progressive local rigidification are first summarised for trpzip1, including a systematic analysis of the heat capacity and rearrangement rates. Benchmarks for all the essential optimisation procedures are then provided for a variety of proteins. Applications are then illustrated from a study of how mutation affects the energy landscape for a coiled-coil protein, and for transitions in helix morphology for a DNA duplex. Both systems exhibit an intrinsically multifunnel landscape, with the potential to act as biomolecular switches.
 Jerelle A. Joseph | Jerelle A. Joseph was born on the Caribbean island of Dominica. She received her BSc and MPhil degrees from the University of the West Indies (Cave Hill Campus, Barbados) in 2012 and 2014 respectively. She is currently pursuing a PhD in Chemistry as a Gates Scholar at the University of Cambridge. Her research focuses on efficient sampling of biomolecules and large scale structural changes in proteins. |
 Konstantin Röder | Konstantin Röder was born in Jena, Germany. He received his MSci and BA degrees in 2015 from the University of Cambridge. He is currently pursuing a PhD at the same institution. His research focuses on multifunnel energy landscapes of biomolecular systems, and the effect of mutations on these landscapes. |
 Debayan Chakraborty | Debayan Chakraborty was born in Kolkata, India. He received his BSc degree from St. Stephens College, University of Delhi, in 2010, and MSc degree from the University of Oxford in 2011. He carried out his doctoral research in the area of Theoretical Chemistry from 2012 to 2016, under the supervision of Prof. David J. Wales at the University of Cambridge. Currently he is a postdoctoral research scholar at the University of Texas at Austin. His research interests include the study of protein and nucleic acid folding exploiting ideas rooted in energy landscape theory, and coarse-grained modelling of biomolecules. |
 Rosemary G. Mantell | Rosemary G. Mantell received her BSc in Chemistry in 2012 from the University of Bristol. She then went on to complete an MPhil in Scientific Computing at the University of Cambridge. She continued her graduate studies at the same institution under the direction of Professor David J. Wales. Her PhD has so far focused on the acceleration of computational energy landscape methods using Graphics Processing Units (GPUs). |
 David J. Wales | David J. Wales received his BA, PhD, and ScD degrees from Cambridge University in 1985, 1988 and 2004. He spent 1989 as a Lindemann Trust Fellow at the University of Chicago, working with Prof. R. S. Berry. He was a Research Fellow at Downing College Cambridge in 1990, a Lloyd's of London Tercentenary Fellow in 1991, and a Royal Society University Research Fellow from 1991 to 1998. He was awarded the Meldola Medal and Prize by the Royal Society of Chemistry in 1992, and the Tilden Prize in 2015. In 1998 he was appointed to a Lectureship in Cambridge and is now Professor of Chemical Physics and Chair of the Theory Group in the Chemistry Department. He was elected as a Fellow of the Royal Society in 2016. |
1 Introduction
The structure–function paradigm continues to play a central role in advancing our understanding of molecular biology. With the advent of modern spectroscopy and computer simulation techniques, it is now possible to study biomolecules at very fine spatial and temporal resolutions to obtain new insight into the structure–function relationship. It is becoming increasingly clear that evolution has endowed biomolecules with a certain degree of flexibility, which allows them to not only adopt stable structures, but also switch between different conformations over a hierarchy of timescales, to perform different functions.1,2 These results highlight the importance of a dynamical perspective. The notion that biomolecules are ‘static sculptures’ is not sufficient to describe their impressive functional capabilities.3 A deeper understanding of the intimate connections between structure, dynamics and function at the molecular level is therefore necessary. In this Feature Article we illustrate how these connections can be addressed in the framework of potential energy landscape theory.4There are actually two aspects to the protein folding problem, which have been extensively discussed in previous reviews.5–9 The first one concerns structure prediction: given an amino acid sequence, what three-dimensional structures will a biomolecule populate at thermodynamic equilibrium to fulfil a certain biological function? The second aspect concerns folding mechanisms and kinetics, which describe how the system achieves its functional three-dimensional structure from a relatively unstructured configuration by navigating along folding routes on the underlying landscape, or switches between different metastable conformations that dominate the equilibrium. Many evolved proteins conform to the ‘principle of minimum frustration’, corresponding to landscapes where kinetic traps are absent, and fold on physiological timescales. This scenario led to the funnel hypothesis, that the native state lies at the bottom of a relatively smooth free energy landscape.5,6 However, some proteins have evolved to exhibit multifunctional character, with an underlying multifunnelled landscape, which can be tuned via mutations,10 ligand-binding,11,12 or even subtle changes in environmental conditions.13 An analogous situation exists for nucleic acids, especially RNA.14,15 Although protein and RNA folding share several common features, significant differences arise due to the polyelectrolyte nature of RNA. Furthermore, due to the lower stability gap between native and non-native states, structure prediction as well as studies of folding mechanisms and kinetics become even more challenging for RNA.16,17
Various experiments18–20 and numerical simulations21–23 have succeeded in extracting specific features of biomolecular energy landscapes. Nonetheless, determining the global topography of the landscape, and predicting or interpreting emergent properties have proved more difficult. In this context, single molecule pulling experiments are an attractive approach.24–26 Recently, several studies27,28 have employed non-equilibrium pulling experiments to reconstruct landscape profiles, using an extended version of Jarzynski's equality29 suggested by Szabo and Hummer.30,31 The specific challenges encountered in computational studies of biomolecular structure and pathways are determined by the complexity of the underlying potential energy landscape. Most biological systems exhibit relatively large barriers between alternative competing morphologies, leading to broken ergodicity. In such situations, brute-force simulations have limited applicability, because the equivalence between time and ensemble averages breaks down over short timescales. Hence, the development of enhanced sampling techniques is essential. Many of these techniques primarily aim at predicting thermodynamic properties, and exploit multiple coupled simulations at different temperatures32–34 or energies,35 predefined reaction coordinates,36–38 or hypersurface deformations39–42 to improve conformational sampling. Obtaining kinetic information, and identifying key intermediates along the multitude of folding pathways, is more difficult. Although techniques based on systematic sampling of reactive trajectories, such as transition path sampling,43,44 transition interface sampling,45 milestoning,46,47 and forward flux sampling,48 can provide kinetic and mechanistic insight, they can be computationally intensive.
The construction of kinetic transition networks provides a complementary way to study biomolecular energy landscapes.49–51 We have actively developed methods based on the potential energy landscape perspective, which provides a convenient framework for building and analysing transition networks.4,50 In this approach, the landscape is coarse-grained into a set of interconnected stationary points [minima (M) and transition states (TS)]. This simplification is particularly attractive because stationary points can be located using geometry optimisation, largely independent of energy barriers. The global thermodynamics is dictated by the configuration space associated with the potential energy minima. The connections between different regions of the landscape are defined in terms of M–TS–M triples, which encode the kinetics.4 Observable properties are extracted from the databases of stationary points using established tools of statistical mechanics and unimolecular rate theory.52–55 It is also possible to analyse the landscape in terms of selected order parameters and lumping schemes to identify states or ensembles, commensurate with the experimental definition.56 Methods that employ explicit dynamics to construct transition networks, mainly in the context of Markov State Models (MSM),49,51,57 are again complementary to methodology based on geometry optimisation.
The potential energy landscape approach has been used to study a range of biomolecular processes. Recent applications include folding of RNA hairpins,58 the origin of heterogeneity in the intrinsically disordered PUMA peptide,59 ring puckering in collagen,60 the effect of mutation on the influenza A virus,61 and the transformation of the landscape for a model protein by a static pulling force.62 The purpose of the present contribution is to briefly summarise the potential energy landscape framework, and discuss recent advances that have made new applications possible.
Biological systems of practical interest can often exceed 100![[thin space (1/6-em)]](https://www.rsc.org/images/entities/char_2009.gif) 000 atoms in size. The number of degrees of freedom poses a serious challenge to current simulation techniques, and even for a biomolecule of moderate size with around 1000 atoms, attaining true equilibrium is time consuming. To circumvent this problem, a common approach is to coarse grain the atomistic representation of the molecule.63–65 However, such reductionist schemes may not be able to represent key dynamical features, and can result in an artificially smooth landscape. Here we present two strategies within the potential energy landscape perspective that have proved effective in structure prediction, and obtaining thermodynamic and kinetic insight at the all-atom level. In Section 3, we review the key findings of a general local rigid body approach from a recent study of the trpzip1 peptide. On the technological side, implementing geometry optimisation routines for GPU hardware has proved effective, as summarised in Section 4. We then discuss two recent case studies involving biological conformational switches. The first example analyses how mutations reshape the underlying landscape of a coiled-coil protein, and the second case study shows how the potential energy landscape framework can be used to probe transitions between different helical morphologies of a DNA duplex. Both examples exhibit multifunnel energy landscapes, which we associate with intrinsic multifunctional behaviour.59
000 atoms in size. The number of degrees of freedom poses a serious challenge to current simulation techniques, and even for a biomolecule of moderate size with around 1000 atoms, attaining true equilibrium is time consuming. To circumvent this problem, a common approach is to coarse grain the atomistic representation of the molecule.63–65 However, such reductionist schemes may not be able to represent key dynamical features, and can result in an artificially smooth landscape. Here we present two strategies within the potential energy landscape perspective that have proved effective in structure prediction, and obtaining thermodynamic and kinetic insight at the all-atom level. In Section 3, we review the key findings of a general local rigid body approach from a recent study of the trpzip1 peptide. On the technological side, implementing geometry optimisation routines for GPU hardware has proved effective, as summarised in Section 4. We then discuss two recent case studies involving biological conformational switches. The first example analyses how mutations reshape the underlying landscape of a coiled-coil protein, and the second case study shows how the potential energy landscape framework can be used to probe transitions between different helical morphologies of a DNA duplex. Both examples exhibit multifunnel energy landscapes, which we associate with intrinsic multifunctional behaviour.59
2 Methods
The potential energy landscape is characterised by stationary points: local minima and transition states. A stationary point is a local minimum if all the non-zero normal mode frequencies are real, whereas transition states are classified geometrically as stationary points with one imaginary normal mode frequency.66 In the following sections we provide a brief summary of the approaches employed to locate stationary points and construct kinetic transition networks; specifically, basin-hopping global optimisation67–70 and discrete path sampling.71–73 We then explain how the free energy surface may be computed from the underlying potential energy landscape using the superposition approach.4,74 Lastly, we discuss the use of disconnectivity graphs75–78 to visualise the landscape. The more recent developments, in terms of local rigidification and implementation of geometry optimisation techniques on GPU hardware, are described in more detail in the following sections.2.1 Structure prediction by basin-hopping global optimisation
The basin-hopping global optimisation procedure67,68 has been successfully applied to a wide range of systems, spanning atomic clusters,68 glass formers,79 and biomolecules.80 This method employs a hypersurface deformation, but does not change the global minimum of the potential energy surface (PES). Each configuration on the PES can be represented by a 3N-dimensional vector X, where N is the number of atoms and the energy corresponding to X is given by E(X). The energy obtained by a minimisation starting from X is written as min{E(X)}. In the present work energy minimisation was achieved using the limited-memory BFGS (L-BFGS)81,82 algorithm, which is well-suited for large-scale problems, since the user is able to control the amount of storage required. The PES is the union of the ‘basins of attraction’83,84 of all the local minima. This procedure effectively removes all downhill barriers between connected minima. Basin-hopping global optimisation has been implemented in the GMIN program,85 which is available for use under the GNU General Public License.2.2 Kinetic transition networks from discrete path sampling
In discrete path sampling71–73 (DPS) the aim is to determine the kinetics of a system from a collection of transition pathways, connecting reactant (e.g. a denatured configuration) and product (e.g. the native structure) states. A discrete path is defined as a sequence of local minima on the potential energy surface (PES) and the transition states that directly connect them.We start by constructing an initial path from the reactant (A) to the product (B).86–88 Transition state candidates are first located using the doubly-nudged elastic band (DNEB) procedure.86 A double-ended interpolation between A and B produces an intermediate set of images [X1, X2…XM], where Xi represents the Cartesian coordinates of the ith image. Next, harmonic springs are used to connect equivalent atoms in adjacent images, resulting in a spring potential. Components of the spring gradient and the gradient of the true potential are then utilised in the derivation of the elastic band gradient. This gradient prevents interference of the spring potential (which affects convergence of images) and the true potential (which affects the spacing of images) and gives the band its ‘nudging’ properties.89 The complete set of images is then relaxed by L-BFGS minimisation, using a weak convergence condition, which focuses on the local maxima.86
Approximate transition states (the images corresponding to maxima in the DNEB energy profile) are then converged more tightly by hybrid eigenvector-following (HEF).90,91 This is a single-ended procedure for locating transition states, where a single starting configuration is considered.90,91 In contrast, for double-ended procedures, such as the DNEB method, two initial endpoint geometries are needed. In HEF, only one Hessian eigenvector (emin) and the corresponding eigenvalue (λmin) are used for uphill searches and a minimisation procedure, such as the L-BFGS algorithm, is used for optimisation in all other directions.91 The smallest non-zero eigenvalue can be found using the Rayleigh–Ritz ratio  , where x represents a small perturbation in the current geometry. To avoid explicit computation of the Hessian (H), λ(x) is estimated from the numerical second derivative of the energy. Through successive iterations, tightly converged transition states are characterised. These transition states are then connected to minima by following approximate steepest-descent paths parallel and antiparallel to the eigenvector corresponding to the unique negative eigenvalue.
The minima and transition states found during DNEB/HEF searches form a database of stationary points. Recall that the goal is to find a connected path between the reactant (A) and product (B). Before each new DNEB/HEF cycle, a metric is needed to determine which minima in the database are most appropriate for subsequent connection attempts. A modified version92 of Dijkstra's algorithm,93 which selects pairs based on a minimised Euclidean distance metric, is used for this purpose. In a database of stationary points the total set of minima can be described using a complete graph G(M,D); where the nodes M represent minima and the edges D represent the transition states. The edge weight w(x,y) between arbitrary minima x and y is set to zero if the minima are connected by a single transition state. If the number of connection attempts between minima x and y reaches the maximum value (set by the user), the edge-weight becomes infinite. Otherwise, w(x,y) is expressed as a function of the Euclidean distance. At the beginning of each DNEB/HEF cycle, pairs of minima for connection attempts are prioritised based on these weights. This process is repeated until there are no missing connections along the path.
The doubly-nudged elastic band procedure, hybrid eigenvector-following, and the shortest path algorithm are implemented in the OPTIM code.94 Parallel OPTIM runs are organised by the PATHSAMPLE program.95
2.3 Optimisation of stationary point databases
The initial path found between reactant and product states is usually long with many high barriers, particularly for states distant in configuration space. The objective is then to grow the stationary point database and locate kinetically relevant paths. At any point, the fastest path (B ← A) is taken as the one making the largest contribution to the steady-state rate constant, kSSBA, which can be defined as a sum over all discrete paths with the steady-state approximation for intervening minima.71,72 Once the fastest path is identified, it can then be used in various ways to search for new paths.The SHORTCUT scheme96,97 chooses pairs of minima from the current ‘fastest’ path that are separated by a minimum number of transition states (steps) and attempts to connect them using the procedures discussed above. The SHORTCUT procedure usually decreases the total number of steps on the path and leads to a significant increase in the overall rate constant. Alternatively, the SHORTCUT BARRIER scheme92,96 selects minima on either side of the largest barriers on the current path, up to a maximum number of steps apart. Additional connection attempts between these minima may find paths avoiding such high barriers, again improving the rate constant.
However, these procedures may also introduce kinetic traps, in the form of low-lying minima separated from the product minimum by high barriers. Most of these traps are artificial and are due to insufficient sampling. To find low-barrier paths for these minima the UNTRAP scheme96 is used. Candidate minima for ‘untrapping’ are chosen based on the ratio of the potential energy barrier and potential energy difference from the product (B). Hence, minima with low potential energies connected by high barriers are most likely to be chosen. Connection attempts between these minima and the product minimum then proceed in search of better paths. Local free energies can also be used.
2.4 Computation of free energies
Thermodynamic properties can be estimated directly from the underlying potential energy landscape using the superposition approach. At a given temperature, the canonical partition function Z(T) is written as a sum of contributions from the basins of attraction of the local minima:4,52,74,98–101 | (1) |
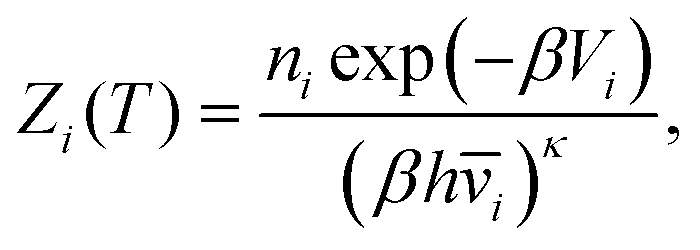 | (2) |
![[v with combining macron]](https://www.rsc.org/images/entities/i_char_0076_0304.gif) i is the geometric mean vibrational frequency and κ is the number of vibrational degrees of freedom.4 The free energy of each minimum is then:
i is the geometric mean vibrational frequency and κ is the number of vibrational degrees of freedom.4 The free energy of each minimum is then:| Fi(T) = −kBTlnZi(T). | (3) |
2.5 Visualisation of energy landscapes: disconnectivity graphs
Originally introduced by Becker and Karplus,75 disconnectivity graphs have played a pivotal role in conceptualising energy landscapes.76–78Fig. 1 illustrates how a disconnectivity graph (red lines) may be constructed from a database of minima and the transition states that connect them (blue curve). The energy is represented on the vertical axis of the graph, while the horizontal axis can be arbitrary or may represent an order parameter. In the disconnectivity graph, a vertical line is drawn from each minimum (A–D), beginning at the potential or free energy of that state. At the energy threshold E + ΔE minima A and B are grouped together, since the transition state connecting them lies below the threshold, and similarly for minima C and D. However, the two sets are disjoint, as the transition state connecting them lies above this threshold. When the threshold is high enough the two sets of minima merge. Since the energy spacing (ΔE) determines how the analysis is performed, the graph is most meaningful when the thresholds are spaced at suitable regular intervals. This analysis provides useful information on relative barriers separating minima in different regions of the landscape. | ||
| Fig. 1 Construction of a disconnectivity graph from a database of stationary points. Minima are labelled A–D. In the disconnectivity graph (red) each local minimum is represented by a vertical line, starting at the energy of that minimum. At a given energy threshold, E + nΔE, minima connected by transition states that lie below the threshold are grouped into disjoint sets. | ||
3 Systematic local rigidification for trpzip1
Bimolecular processes, such as protein folding, frequently exhibit a separation of timescales between low frequency modes and localised fast vibrations.109–113 For instance, changes in ring planarity occur orders of magnitude faster than the formation of salt bridges. We can exploit this disparity in timescales to improve computational efficiency, by effectively factorising out the irrelevant degrees of freedom using a local rigid body (LRB) framework.114–117 This approach is similar in spirit to the FEG-RBD procedure,118 where rigid body dynamics is employed to compute free energy gradients in constrained MD simulations.In the local rigidification scheme employed here, groups of atoms, whose relative coordinates vary on timescales significantly shorter than the process of interest, are treated as rigid units.115–117 Each non-linear rigid unit, regardless of size, then has six degrees of freedom: three translational and three rotational. Since interactions between sites within each local rigid body are not required, this formulation results in computational savings in evaluating the energy and gradient. Additionally, fewer geometry optimisation steps are generally needed, due to the dimensionality reduction of the conformational search space. Hence, significant speedups in the mean first encounter time for global optimisation are possible.116 Moreover, a clear mapping between the minima found on locally rigidified and unconstrained potential energy landscapes can be maintained.116
In a recent article,108 we investigated the systematic effects of local rigidification on the structure, thermodynamics and kinetics of trpzip1.119 The tryptophan side-chain rings, peptide bonds, trigonal planar centres and termini were grouped as rigid bodies, and, based on these sets, we formulated three LRB schemes: I – rings, II – rings and peptide bonds, III – rings, peptide bonds, termini, trigonal planar centres treated as local rigid bodies. Trpzip1 was represented by the AMBER99SB forcefield,120 and discrete path sampling71,72 was used to analyse the potential energy landscape for each LRB scheme, as well as the unconstrained (U) peptide.
The main conclusions are summarised in Fig. 2 and 3. The potential energy range and structural heterogeneity of the locally rigidified landscapes are consistent with the unconstrained landscape (Fig. 2). However, there is a significant increase in the number of prominent subfunnels in the disconnectivity graph for the most constrained case (Fig. 2d). This result suggests that excessive rigidification can reduce the conformational flexibility of the protein in an unphysical manner, leading to artificially high barriers on the potential energy landscape.
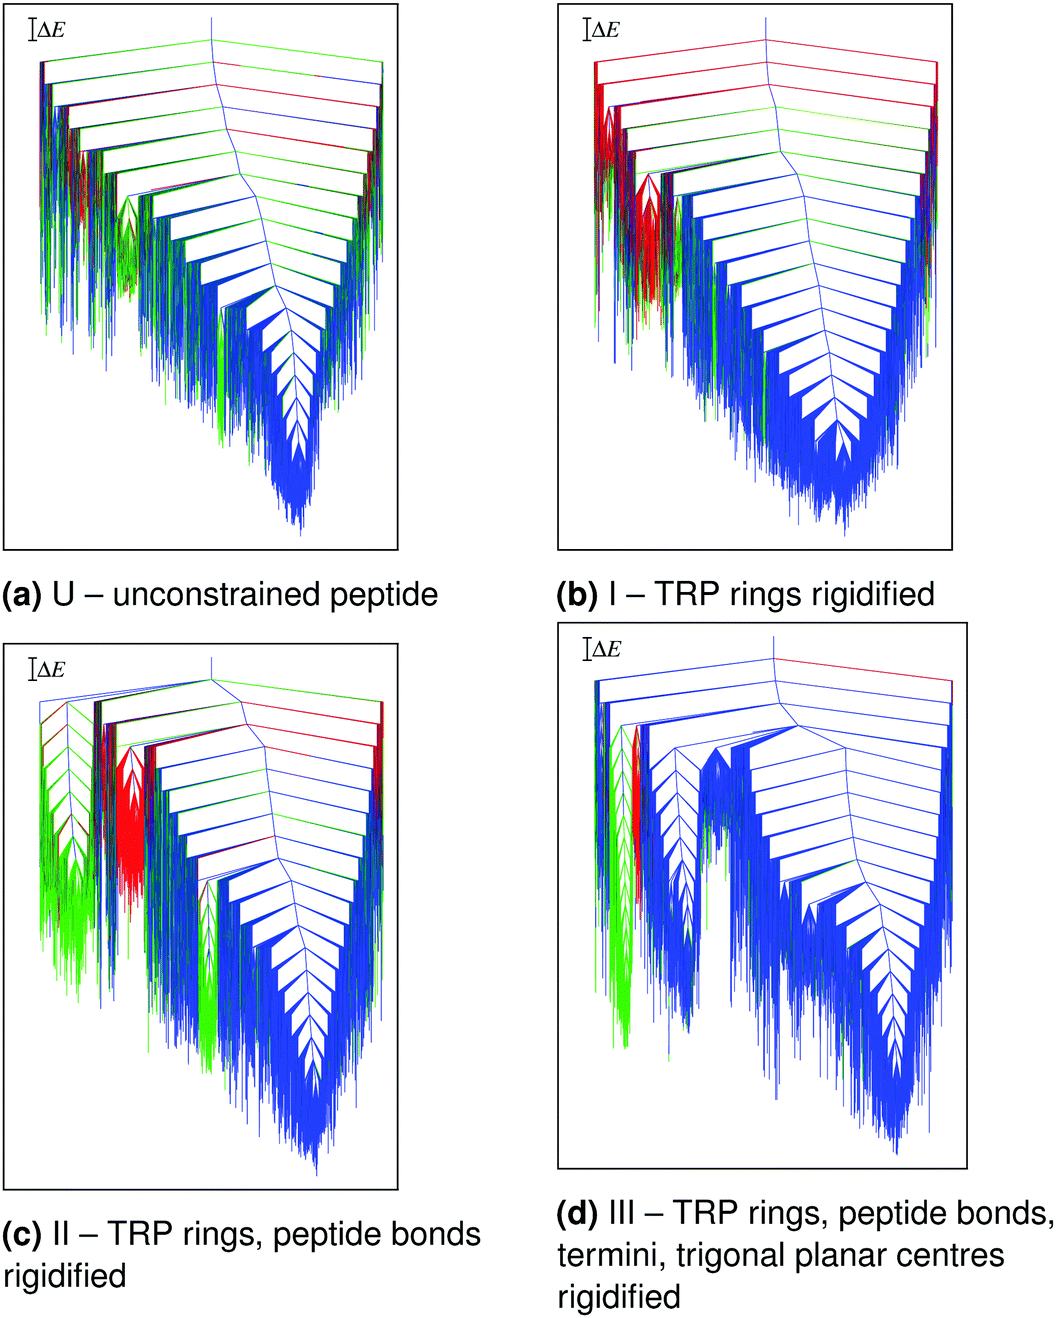 | ||
| Fig. 2 Potential energy disconnectivity graphs for TZ1 (ΔE = 2 kcal mol−1) at different levels of local rigidification. The branches are coloured based on order parameters L (the sum of the four inner native hydrogen-bond lengths and the distances between the CD2 atoms of the three TRP pairs) and S (the relative orientation of the TRP rings). The three main morphologies are: blue (L < 60 Å, S-value = +1), green (L < 60 Å, S-value = −1), and red (all other minima). Adapted from ref. 108. | ||
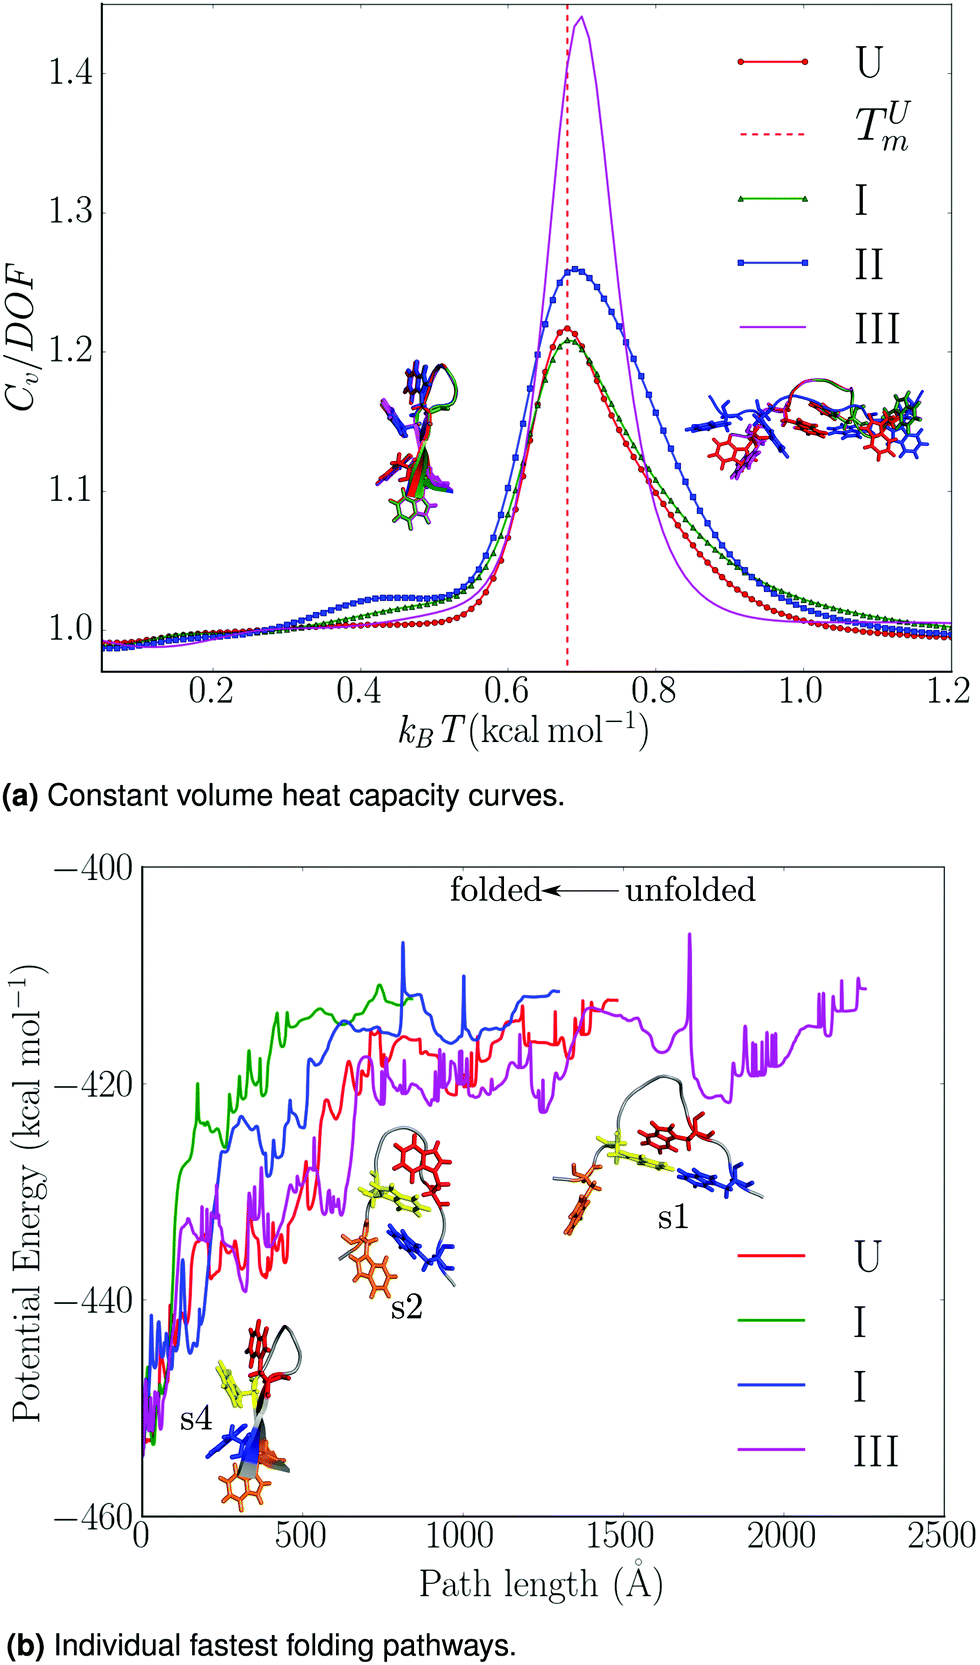 | ||
| Fig. 3 Summary of thermodynamic and mechanistic properties for trpzip1, as a function of local rigidification: U – no local rigid bodies; I – TRP rings, II – TRP rings and peptide bonds, III – TRP rings, peptide bonds, termini, trigonal planar centres treated as rigid bodies. (a) Constant volume heat capacity curves: the heat capacities are divided by the appropriate total number of degrees of freedom (DOF) and the melting temperature of the unconstrained peptide, TUm, is indicated. The free energy global minima at 0.48 and 0.88 kcal mol−1 are superimposed on the plot; key: red (U), green (I), blue (II), magenta (III). (b) Variation of the total potential energy (kcal mol−1) with the integrated path length (Å) for the fastest folding path from the denatured trpzip1 peptide to the global minimum. Some morphologies encountered along the paths are shown. Adapted from ref. 108. | ||
Nonetheless, the free energy global minimum (particularly at low temperatures) and the melting temperature for the locally rigidified implementations were in good agreement with the unconstrained benchmarks (Fig. 3a). To assess the effects of local rigidification on the folding mechanism, we extracted the fastest folding path71–73 from each transition network (Fig. 3b). The folding pathways for the unconstrained peptide, schemes I and II, were found to be consistent with an initial hydrophobic collapse (s1 → s2), followed by subsequent zipping (s2 → s4). However, for LRB scheme III a significant lengthening of the folding pathway was observed, which is consistent with excessive reduction in conformational flexibility.
These results suggest that local rigidification should be useful for analysis of thermodynamics and folding mechanisms of biomolecules. Moreover, the results provide some practical guidelines for systematically eliminating unnecessary degrees of freedom, and demonstrate how too much rigidification can significantly perturb pathways and kinetics. An appropriate choice of local rigidification (based on the level of resolution required, and the timescale to be probed) can preserve the underlying properties, and provide useful gains in computational efficiency.
The number of stationary points on the energy landscape increases exponentially with system size,98,121 but the mean first encounter time for the global minimum in basin-hopping global optimisation for atomic clusters seems to scale roughly as the cube of the number of atoms.68 Hence, removing irrelevant degrees of freedom will be even more beneficial if the size scaling is steeper, which may be the case for larger proteins.
4 GPU-accelerated geometry optimisation
Basin-hopping global optimisation,67,68 the doubly-nudged86 elastic band87,89 method (DNEB), hybrid eigenvector-following (HEF)90 and the local rigid body framework116,117 have all been adapted to run on graphics processing units (GPUs).122 GPU hardware is well suited to massively parallel computations, as a greater number of transistors are devoted to data processing than to data caching and flow control, relative to a CPU.123The most time-consuming component in all of the computational energy landscapes approaches is the calculation of the potential energy and gradient. For biomolecules, the task of adapting a force field for GPU was facilitated by the release of a GPU-accelerated version of the AMBER potential.124 The generalised Born (GB) implicit solvent potential from AMBER 12 was interfaced with all the energy landscapes codes. The DPDP precision model was used, in which contributions to forces and their accumulation are both performed in double precision.
Basin-hopping global optimisation and transition state determination employ several variants of the L-BFGS algorithm. In each case, the whole algorithm was ported to the GPU, and compared to an implementation with just the potential on GPU. Our GPU implementation of L-BFGS was based on the code of Wetzl and Taubmann,125,126 with various modifications applied to make it as similar as possible to our CPU code. The coordinate transformation and gradient projection functions from our local rigid body framework were also ported to GPU. Extensive use was made of the cuBLAS library127 in this work, alongside custom CUDA kernels.
Tests were performed for eight different system sizes ranging from 81 to 22811 atoms. A subset of these results is presented here for the trimeric haemagglutinin (HA) glycoprotein of the influenza A(H1N1) virus128 (‘full trimer’, 22811 atoms), a monomeric version of HA (‘full monomer’, 7585 atoms), and finally a truncated version of this monomer (‘truncated monomer’, 3522 atoms). These systems are shown in Fig. 4. L-BFGS was benchmarked in isolation as a proxy for full basin-hopping global optimisation. The change in coordinates and the change in gradient for the last m steps are used in calculating the step direction for minimisation.129 The history size, m, affects the accuracy of the L-BFGS step direction and the overall time taken for minimisation. Results for L-BFGS are shown in Table 1 for history sizes 4 and 1000. Significant speed ups are obtained of up to two orders of magnitude. A large history size is more favourable for bigger systems with the whole L-BFGS algorithm on GPU, whereas a smaller history size gives optimal performance for smaller systems; in contrast, for CPUs a larger history size is always more favourable. We extended our analysis to find the optimal history size and GPU implementation for the full HA trimer. The fastest average minimisation time obtained was 1788 s for a history size of 75 with the whole L-BFGS algorithm on GPU (implementation 1).
 | ||
| Fig. 4 Structures of the biomolecules used in the tests of GPU geometry optimisation procedures. Adapted from ref. 122. | ||
| History size | System | Average minimisation time for GPU implementation 1/seconds | Average minimisation time for GPU implementation 2/seconds | Average minimisation time for CPU implementation/seconds | Time for CPU implementation/time for GPU implementation 1 | Time for CPU implementation/time for GPU implementation 2 |
|---|---|---|---|---|---|---|
| a GPU implementation 1 has the entire L-BFGS routine on GPU, including the potential calculation. GPU implementation 2 has just the potential calculation on GPU. See the original paper for full descriptions of all the parameters.122 | ||||||
| 4 | Truncated monomer | 40.1 | 39.4 | 5937.7 | 148.1 | 150.8 |
| Full monomer | 489.9 | 492.1 | 86552.8 | 176.7 | 175.9 | |
| Full trimer | 2546.9 | 2527.1 | 517567.7 | 203.2 | 204.8 | |
| 1000 | Truncated monomer | 382.1 | 239.6 | 4561.2 | 11.9 | 19.0 |
| Full monomer | 1249.5 | 1609.0 | 48754.5 | 39.0 | 30.3 | |
| Full trimer | 2392.5 | 4747.1 | 337077.0 | 140.9 | 71.0 | |
Tests were also performed to compare transition state searches on GPU and CPU. Interfacing the DNEB procedure with the GPU-accelerated potential gave a 178 times speed up compared to CPU for the full HA trimer with a small history size of 4. Results for hybrid eigenvector-following with HA are shown in Table 2. Again, significant improvements are obtained.
| History size | System | Average time for GPU implementation (m = 4)/seconds | Average time for CPU implementation (m = 4)/seconds | Time for CPU implementation/time for GPU implementation (m = 4) |
|---|---|---|---|---|
| a The GPU implementation has the entire Rayleigh–Ritz L-BFGS and L-BFGS routines with gradient projection on GPU, including the potential calculation. See the original paper for full descriptions of all the parameters.122 | ||||
| 4 | Truncated monomer | 25.7 | 3529.1 | 137.4 |
| Full monomer | 197.1 | 36779.8 | 186.6 | |
| Full trimer | 1047.6 | 176550.7 | 168.5 | |
| 1000 | Truncated monomer | 186.3 | 3160.9 | 17.0 |
| Full monomer | 669.6 | 32046.2 | 47.9 | |
| Full trimer | 1225.4 | 169234.0 | 138.1 | |
Local rigidification is now supported on GPU in conjunction with all of these methods in the GMIN85 and OPTIM94 programs. The GPU implementations of the coordinate transformations and gradient projection were found to incur negligible computational overhead in each L-BFGS procedure.
5 Multifunnel energy landscapes for proteins
The question that originally motivated interest in the energy landscapes of proteins is how a sequence of amino acids achieves its native fold.130 From the application of statistical mechanics to various model systems the existence of intrinsic properties of protein sequences emerged, which lead to a preference for particular folded states. This idea produced the notion of a funnelled free energy landscape containing the native state as the global minimum.9,131,132A single funnel on the free energy landscape leads to a single dominant ensemble corresponding to the native state, yet for many biological systems more than one stable fold is observed, e.g. activated states or misfolded states. In many cases these additional stable states require a significant rearrangement of the original folded structure. The resulting alternative morphologies are unlikely to exist within a single funnel on the energy landscape. As a result we observe multifunnel energy landscapes that contain at least two competing morphologies. One important group of multifunnel landscapes are associated with proteins that exhibit stable misfolded structures. Such structures alter the functionality of the protein, and hence they may be pathological. Particularly important examples are amyloid forming proteins, such as Aβ1–42. Another set of proteins likely to exhibit multifunnel landscapes are those that show activated and inactive states, such as kinases. Apart from these important biological and medically relevant proteins, artificial systems used in nanotechnology, such as peptide-based molecular switches, may also require multifunnel landscapes to represent alternative states of an engineered system.
An interesting question for multifunnel landscapes involves the changes caused by mutations, which affect the observable properties. Analysing these changes will lead to a better understanding of biological processes, such as activation and disease, as well as design principles for functional peptides. Previous studies of mutations suggest that naturally occurring proteins possess an inherent stability towards mutations.134 Hence, if a protein still folds after mutation, the folded structure may closely resemble the wild type native state. However, it has also been noted that this stability is likely to be marginal, and may be overcome.135–137
Recently, we have studied a system that exemplifies these features.133 The coiled-coil protein, GCN4-pLI, experimentally exhibits exclusively parallel assemblies of α-helices. A mutation of the parent sequence, namely E20S, leads to the observation of both parallel and antiparallel states.138 Other studies have considered a variety of similar coiled-coil systems, and concluded that there is competition between different oligomer sizes, as well as between parallel and antiparallel alignments.139–142 A multifunnel landscape was suggested as one explanation for this behaviour.143 Our calculations used the properly symmetrised144,145 AMBER ff99SB force field,120,146–148 with an implicit generalised Born solvation model149,150 using infinite interaction cutoffs and the Debye–Hückel approximation for salt (0.1 M).151
The energy landscapes for the parent sequence and the E20S mutant dimers resemble each other, as shown in Fig. 5, in that the main topography is maintained. There are two distinct funnels for parallel (red) and antiparallel (blue) structures. However, a key difference is found in the intermediate region between these funnels. The E20S mutant supports stable intermediate structures, which show a kink in one of the helices (one example is shown in Fig. 5). These low energy structures facilitate interconversion at lower temperatures, which will not occur for the parent sequence, a feature that leads to signatures in the calculated heat capacity curves. The structural basis for this effect is the change in interaction patterns caused by the mutation. When the energy landscapes are analysed regarding the distribution of the local minima with respect to potential energy, and the logarithm of the product of their normal mode frequencies,133 we find that the E20S mutant exhibits a bimodal distribution, corresponding to the parallel and the antiparallel funnels in the landscape. In contrast, the parent sequence only exhibits unimodal distributions, suggesting that the energy landscape is based on an underlying single funnel.
 | ||
| Fig. 5 Disconnectivity graphs for the E20S mutant (top) and the parent sequence (bottom). The order parameter q1 represents the angle between the two helices and is 0 for parallel and 1 for antiparallel alignments. The separate funnels are clearly visible. Adapted from ref. 133. | ||
Further insight can be obtained by decomposing the contributions of local minima to the heat capacity features, using the temperature gradient of the occupation probabilities.152 For the E20S mutant three peaks in the heat capacity curve can be associated with three distinct transitions (see Fig. 6): (i) from the global minimum to other low-lying minima in the same funnel, (ii) from minima in the parallel funnel to minima in the intermediate region, and (iii) a melting peak. The second transition is the key to the thermal accessibility of both parallel and antiparallel states at ambient conditions.133 In contrast, the parent sequence only shows transitions within the same funnel and a single melting peak.
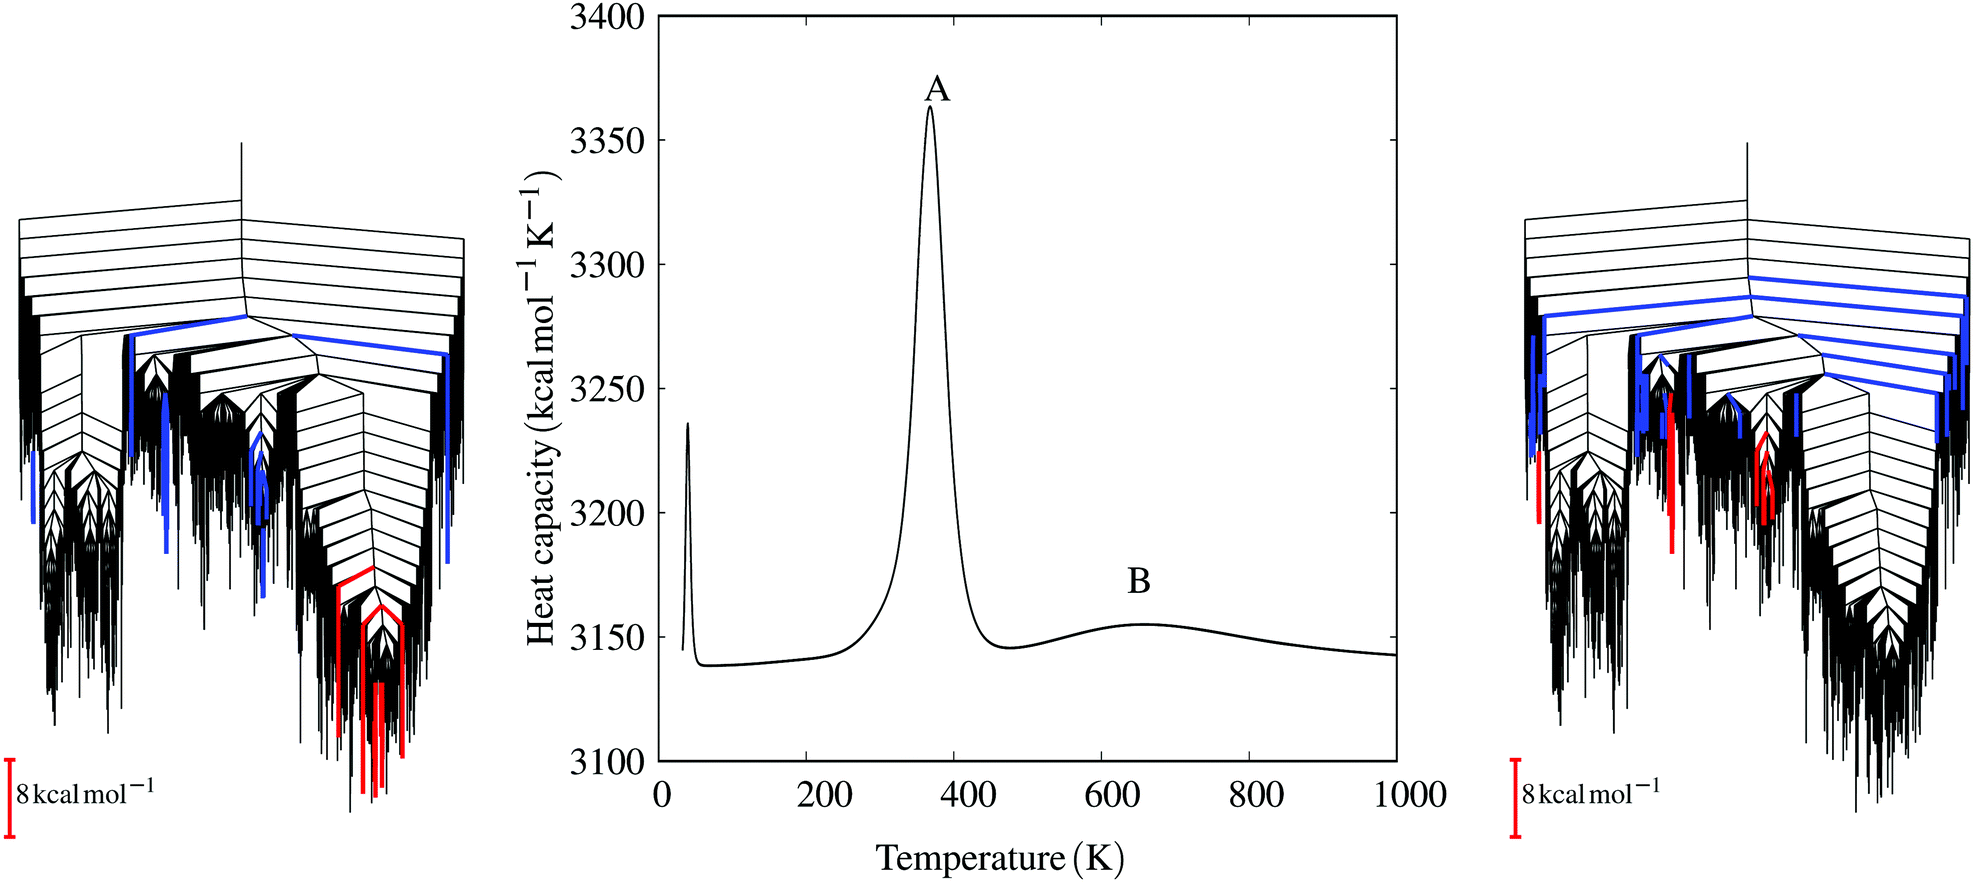 | ||
| Fig. 6 The heat capacity curve for the E20S mutant shows three distinct peaks. The central peak (A) corresponds to the transition from the parallel funnel to intermediate states. The disconnectivity graph (left) highlights the minima involved, colouring branches red and blue for decreasing and increasing occupation probabilities, respectively, for the states that make the largest contributions to the heat capacity peak.152 The highest temperature peak (B) corresponds to the melting peak and a disconnectivity graph with the key minima coloured in the same way is shown on the right. These results exploit a formulation of the heat capacity written in terms of occupation probability temperature gradients,152 which enables the contribution of each minimum to be quantified. Adapted from ref. 133. | ||
Moving to more disruptive mutations, the energy landscapes of three further mutants, E20P, E20A and E20G, all exhibit distinct features (Fig. 7). While all three still support stable dimers, both antiparallel and parallel, a number of significant changes occur. Firstly, the energy differences between funnels shift as the dimers are destabilised. Additionally, for E20A and E20G, we see new funnels appearing. Furthermore, the number of intermediate structures increases and they show a larger variety of conformations. While the E20S mutant exhibits one particular interconversion mechanism, the larger perturbations of the bonding pattern lead to coiling and helix kinking in many places.
 | ||
| Fig. 7 Disconnectivity graphs for E20A (left), E20G (middle) and E20P (right) mutants. The order parameter q1 represents the angle between the two helices and is 0 for parallel and 1 for antiparallel alignments. Adapted from ref. 133. | ||
These results suggest a number of important conclusions. First of all, the effects of mutations can be analysed using energy landscape methods, leading to a detailed understanding of energetic balances, structural and mechanistic differences, and changes of associated observables, such as the heat capacity curves. Moreover, protein sequences may be mutated in silico to use energy landscape methods as a predictive tool in engineering and de novo design. Our results also reveal the inherent complexity of multifunnel landscapes and the nature of changes associated with mutations. Last but not least, even the relatively simple coiled-coil system highlights the marginal stability of these energy landscapes towards mutations.
6 Helical transitions in a DNA duplex
The B → Z transition is one of the slowest conformational changes that has been characterised in biomolecules. ZDNA exhibits a left-handed helical structure,153–155 in contrast to the well known right-handed helices of BDNA and ADNA. This left-handed helix has zig-zag phosphate backbone with an alternating pattern of syn and anti glycosidic torsions.154–156 The discovery that ZDNA has important cellular functions156–161 makes the complex rearrangements required to interconvert alternative helices particularly interesting. Experimentally, BDNA may convert to ZDNA at high salt concentrations,153,156,162,163 through negative supercoiling,164–166 methylation,167–169 and binding to protein ligands.170,171 Various suggestions have been proposed for the mechanism,172 ranging from cooperative schemes,173 pathways involving base-pair opening,154 ADNA intermediates,174 stretched intermediates,175,176 and a zipper model, which involves stepwise propagation of a B–Z junction.177,178Although the helical transitions are relatively slow, this does not present a problem for methodology based on geometry optimisation. In fact, the transition state theory formulation we employ to calculate the individual minimum-to-minimum rate constants using harmonic vibrational densities of states will probably be most reliable for pathways with higher overall barriers. We investigated the landscape and helix interconversion kinetics for a DNA hexamer duplex with the sequence (CGCGCG)2, using a properly symmetrised144,145 version of the AMBER99bsc0 force-field,179 and ε and ζ torsional corrections180 with implicit solvent treated by a generalised Born model,149,150 and an effective salt concentration of 1.0 M from the Debye–Hückel approximation.151 Full details are available in the original report,181 including comparisons with molecular dynamics runs using explicit solvent, which provide a check on the stability of the predicted structures on short timescales.
The resulting free energy landscape at 298 K is illustrated in Fig. 8, where minima separated by free energy barriers less than 5 kcal mol−1 have been recursively regrouped.56,182 There are two principal funnels, which can be largely assigned to left- and right-handed helices. The global free energy minimum under these conditions corresponds to an ensemble of BDNA configurations, including structures with terminal bases frayed out, stacked on top of the base-pairing partner, and trans Watson–Crick/sugar edge hydrogen-bonding patterns, in addition to the canonical form. Helices exhibiting B–Z junctions and ADNA structures are also present in this funnel, and are generally connected to BDNA minima via low downhill barriers. The B–Z junctions have the first two base-pairs in a ZDNA-like conformation, and the last three in a BDNA-like conformation, with the G3 and C10 bases at the boundary flipped out.
 | ||
| Fig. 8 Free energy landscape computed at 298 K using a regrouping threshold182 of 5 kcal mol−1.181 The branches are coloured according to the handedness (H) of the DNA structure, with positive values representing right-handed conformations and negative values representing left-handed conformations.185 Some representative structures from the different conformational ensembles are also shown. Adapted from ref. 181. | ||
The funnel containing ZDNA is more structurally homogeneous, and our results support the suggestion that BDNA is more flexible. This funnel also contains conformations that we have described as left-handed BDNA.181 At high energy we see stretched DNA structures, where the helix is significantly unwound. These minima are different from the SDNA state that forms during overstretching, which is thought to be a ladder-like structure, with Watson–Crick base-pairs maintained throughout.183,184 The stretched forms that we have characterised have no such pairs.
A mechanistic analysis of the landscape reveals two distinct pathways (Fig. 9) for the B → Z transformation:181 one involving a B–Z junction and the other sampling stretched intermediates. The stretched minima are accessed via helix unwinding, loss of Watson–Crick base-pairs, with the central guanines flipping from anti to syn conformations before the guanines near the helix termini. This ordering is reversed for the BZ-junction mechanism, which is predicted to be more favourable at 298 K, since the enthalpy barrier is lower.181 However, stretched intermediates will become more competitive at higher temperatures.
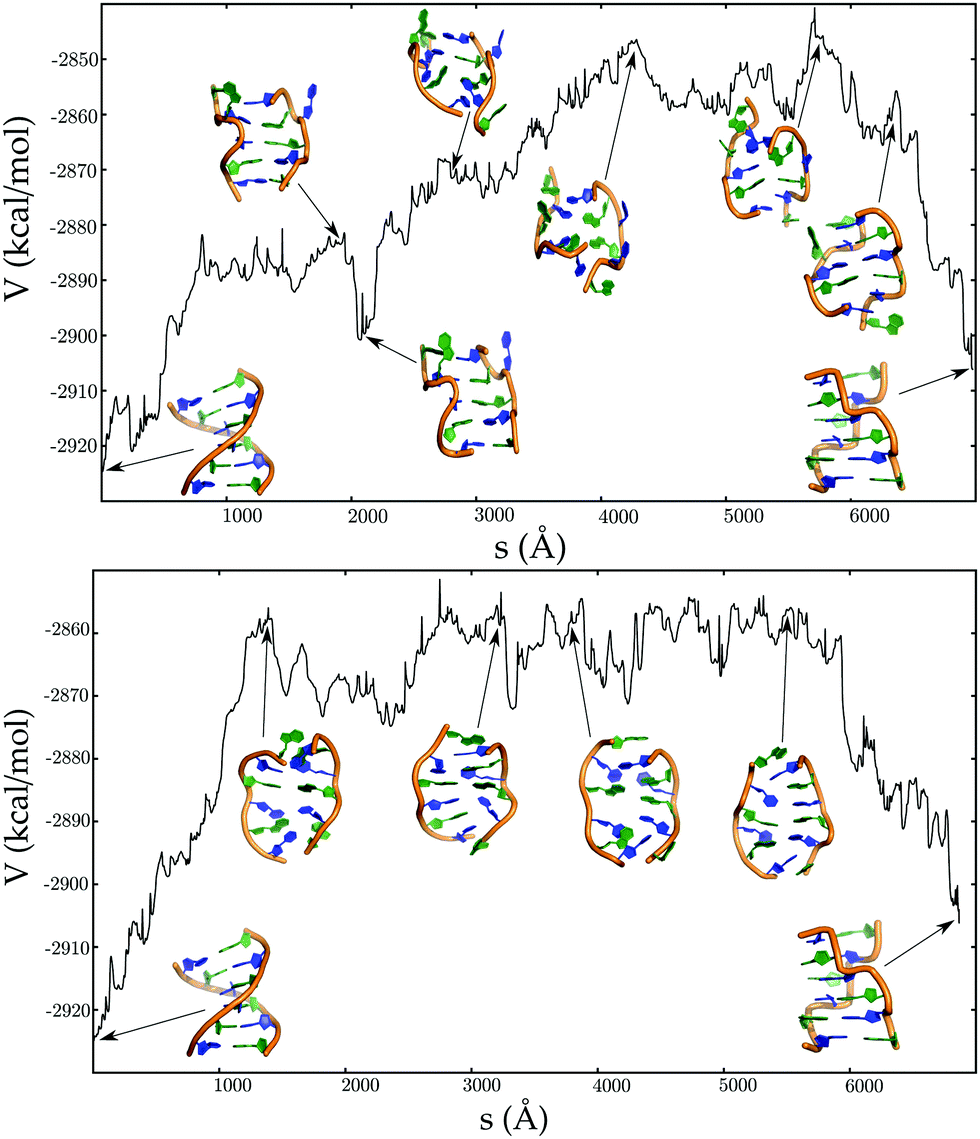 | ||
| Fig. 9 Potential energy (V) as a function of the integrated path length (s) for pathways corresponding to the BDNA to ZDNA transition, via BZ junction (top panel), and stretched intermediates (bottom panel). Adapted from ref. 181. | ||
In contrast to the B → Z transition pathways, the A → B transformation is essentially downhill (Fig. 10), consistent with previous molecular dynamics simulations.186,187 The small barriers encountered along the pathway correspond to repuckering of the ribose sugars, which in turn are coupled to global changes in the helix morphology. The key features of the Calladine–Drew model are correctly captured in our proposed mechanism.188
 | ||
| Fig. 10 Potential energy (V) as a function of the integrated path length (s) for pathways corresponding to ADNA to BDNA transition (top panel), left-handed BDNA to ZDNA transition (bottom panel). Adapted from ref. 181. | ||
A switch in the chain topology is required for the transformation from the left-handed BDNA structure to ZDNA (Fig. 10). This transition does not require large-scale deformations of the DNA duplex, and is largely driven by concerted motions involving only a few nucleobases. The anti to syn torsional flips of the guanine bases, which are necessary to reach the ZDNA state, introduce kinetic bottlenecks in the pathway.
Due to the intrinsic coupling between many degrees of freedom, probing helical transitions in a DNA duplex is a challenging task. This case study therefore provided an ideal testing ground for the potential energy landscape framework. Our simulations captured several aspects of the models proposed for helical transformations in DNA, and revealed some additional complexity, which would be difficult to capture in approaches that require the definition of a reaction coordinate.
7 Conclusions
The computational procedures associated with the potential energy landscapes framework are largely complementary to conventional molecular dynamics and Monte Carlo schemes. Coarse-graining the landscape, in terms of local minima and the transition states that connect them, enables us to predict structure, dynamics, and thermodynamic properties using established methods and approximations of statistical mechanics and unimolecular rate theory. In this Feature Article we have highlighted the gains in efficiency resulting from implementation of all the key geometry optimisation techniques on GPU, and from a general local rigid body formulation. Recent results for systematic analysis of these schemes have been summarised, and specific applications to protein and nucleic acid systems provide examples of interesting test cases.Accelerating the sampling and exploration of the potential energy landscape has many benefits, especially in terms of treating larger systems. Initial surveys involving global optimisation to find favourable conformations are also a stringent test of the empirical force field. Identifying unphysical features can inform future force field development and improvement, which provides the foundations on which analysis of thermodynamic properties and kinetics depends.
Many new applications can be envisaged for biomolecules, including more coarse-grained models of mesoscopic systems. The two applications we have summarised for this report show how new insight into mechanism and design of new materials might arise. Both the coiled-coil protein and the DNA duplex landscapes exhibit multifunnel organisation, with competing low energy morphologies separated by relatively high barriers. The potential to tune such landscapes through mutations, applied fields, salt concentration, temperature, and specific ligands, raises the possibility of new design principles for multifunctional devices. The ability to explore such designs through theory and simulation, in tandem with feedback from experiment, could significantly facilitate progress in these endeavours.
Acknowledgements
This work was supported by the Engineering and Physical Sciences Research Council (RGM and KR), the Cambridge Commonwealth, European and International Trust (DC), and the Gates Cambridge Trust (JAJ).References
- K. Henzler-Wildman and D. Kern, Nature, 2007, 450, 964–972 CrossRef CAS PubMed.
- A. M. Mustoe, C. L. Brooks and H. M. Al-Hashimi, Annu. Rev. Biochem., 2014, 83, 441–466 CrossRef CAS PubMed.
- R. Nussinov and P. G. Wolynes, Phys. Chem. Chem. Phys., 2014, 16, 6321–6322 RSC.
- D. J. Wales, Energy Landscapes, Cambridge University Press, 2003 Search PubMed.
- J. N. Onuchic and P. G. Wolynes, Annu. Rev. Phys. Chem., 1997, 48, 545–600 CrossRef CAS PubMed.
- J. N. Onuchic and P. G. Wolynes, Curr. Opin. Struct. Biol., 2004, 14, 70–75 CrossRef CAS PubMed.
- K. A. Dill, S. B. Ozkan, M. S. Shell and T. R. Weikl, Annu. Rev. Biophys., 2008, 37, 289–316 CrossRef CAS PubMed.
- J. D. Bryngelson, J. N. Onuchic, N. D. Socci and P. G. Wolynes, Proteins, 1995, 21, 167–195 CrossRef CAS PubMed.
- P. G. Wolynes, J. Onuchic and D. Thirumalai, Science, 1995, 267, 1619–1620 CrossRef CAS PubMed.
- H. Nguyen, M. Jäger, A. Moretto, M. Gruebele and J. W. Kelly, Proc. Natl. Acad. Sci. U. S. A., 2003, 100, 3948–3953 CrossRef CAS PubMed.
- K. Okazaki and S. Takada, Proc. Natl. Acad. Sci. U. S. A., 2008, 105, 11182–11187 CrossRef CAS PubMed.
- K. Osazaki, N. Koga, S. Takada, J. Onuchic and P. G. Wolynes, Proc. Natl. Acad. Sci. U. S. A., 2006, 103, 11844–11849 CrossRef PubMed.
- L. Cruzeiro, J. Phys. Org. Chem., 2008, 21, 549–554 CrossRef CAS.
- P. Brion and E. Westhof, Annu. Rev. Biophys. Biomol. Struct., 1997, 26, 113–137 CrossRef CAS PubMed.
- D. Thirumalai and C. Hyeon, Non-Protein Coding RNAs, Springer, Berlin, Heidelberg, 2009, vol. 13, pp. 27–47 Search PubMed.
- D. Thirumalai and S. A. Woodson, Acc. Chem. Res., 1996, 29, 433–439 CrossRef CAS.
- D. Thirumalai, D. K. Klimov and S. A. Woodson, Theor. Chem. Acc., 1997, 96, 14–22 CrossRef CAS.
- K. Truex, H. S. Chung, J. M. Louis and W. A. Eaton, Phys. Rev. Lett., 2015, 115, 018101 CrossRef PubMed.
- H. Dietz and M. Reif, Proc. Natl. Acad. Sci. U. S. A., 2004, 101, 16192–16197 CrossRef CAS PubMed.
- H. Ma, D. J. Proctor, E. Kierzek, R. Kierzek, P. C. Bevilacqua and M. Gruebele, J. Am. Chem. Soc., 2006, 128, 1523–1530 CrossRef CAS PubMed.
- H. A. Scheraga, Annu. Rev. Phys. Chem., 2007, 58, 57–83 CrossRef CAS PubMed.
- J. K. Noel and P. Whitford, Isr. J. Chem., 2014, 54, 1093–1107 CrossRef.
- R. B. Best, Curr. Opin. Struct. Biol., 2012, 22, 52–61 CrossRef CAS PubMed.
- A. N. Gupta, A. Vincent, K. Neupane, H. Yu, F. Wang and M. T. Woodside, Nat. Phys., 2011, 7, 631–634 CrossRef CAS.
- M. T. Woodside and S. M. Block, Annu. Rev. Biophys., 2014, 43, 19–39 CrossRef CAS PubMed.
- K. Neupane, D. A. N. Foster, D. R. Dee, H. Yu, F. Wang and M. T. Woodside, Science, 2016, 352, 239–242 CrossRef CAS PubMed.
- M. C. Engel, D. B. Ritchie, D. A. N. Foster, K. S. D. Beach and M. T. Woodside, Phys. Rev. Lett., 2014, 113, 238104 CrossRef PubMed.
- A. P. Manuel, J. Lambert and M. T. Woodside, Proc. Natl. Acad. Sci. U. S. A., 2015, 112, 7183–7188 CrossRef CAS PubMed.
- C. Jarzynski, Phys. Rev. Lett., 1997, 78, 2690–2693 CrossRef CAS.
- G. Hummer and A. Szabo, Proc. Natl. Acad. Sci. U. S. A., 2001, 98, 3658–3661 CrossRef CAS PubMed.
- G. Hummer and A. Szabo, Proc. Natl. Acad. Sci. U. S. A., 2010, 107, 21441–21446 CrossRef CAS PubMed.
- R. H. Swendsen and J.-S. Wang, Phys. Rev. Lett., 1986, 57, 2607–2609 CrossRef PubMed.
- D. J. Earl and M. W. Deem, Phys. Chem. Chem. Phys., 2005, 7, 3910–3916 RSC.
- Y. Sugita and Y. Okamoto, Chem. Phys. Lett., 1999, 314, 141–151 CrossRef CAS.
- F. Wang and D. P. Landau, Phys. Rev. Lett., 2001, 86, 2050–2053 CrossRef CAS PubMed.
- G. M. Torrie and J. P. Valleau, J. Comput. Phys., 1977, 23, 187–199 CrossRef.
- J. Kästner, Wiley Interdiscip. Rev.: Comput. Mol. Sci., 2011, 1, 932–942 CrossRef.
- A. Barducci, M. Bonomi and M. Parrinello, Wiley Interdiscip. Rev.: Comput. Mol. Sci., 2011, 1, 826–843 CrossRef CAS.
- A. F. Voter, Phys. Rev. Lett., 1997, 78, 3908–3911 CrossRef CAS.
- A. F. Voter, J. Chem. Phys., 1997, 106, 4665–4677 CrossRef CAS.
- D. Hamelberg, J. Mongan and J. A. McCammon, J. Chem. Phys., 2004, 120, 11919–11929 CrossRef CAS PubMed.
- C. E. Y. Miao, F. Feixas and J. A. McCammon, J. Comput. Chem., 2015, 36, 1536–1549 CrossRef PubMed.
- P. G. Bolhuis, D. Chandler, C. Dellago and P. L. Geissler, Annu. Rev. Phys. Chem., 2002, 53, 291–318 CrossRef CAS PubMed.
- C. Dellago, P. G. Bolhuis and D. Chandler, J. Chem. Phys., 1998, 108, 9236–9245 CrossRef CAS.
- T. S. van Erp, D. Moroni and P. G. Bolhuis, J. Chem. Phys., 2003, 118, 7762–7774 CrossRef CAS.
- A. K. Faradjian and R. Elber, J. Chem. Phys., 2004, 120, 10880–10889 CrossRef CAS PubMed.
- E. Vanden-Eijnden, M. Venturoli, G. Ciccotti and R. Elber, J. Chem. Phys., 2008, 129, 174102 CrossRef PubMed.
- R. J. Allen, C. Valeriani and P. R. ten Wolde, J. Phys.: Condens. Matter, 2009, 21, 463102 CrossRef PubMed.
- F. Noé and S. Fischer, Curr. Opin. Struct. Biol., 2008, 18, 154–162 CrossRef PubMed.
- D. J. Wales, Curr. Opin. Struct. Biol., 2010, 20, 3–10 CrossRef CAS PubMed.
- V. S. Pande, K. Beauchamp and G. R. Bowman, Methods, 2010, 52, 99–105 CrossRef CAS PubMed.
- M. R. Hoare and J. J. McInnes, Faraday Discuss. Chem. Soc., 1976, 61, 12–24 RSC.
- H. Pelzer and E. Wigner, Z. Phys. Chem. B, 1932, 15, 445 Search PubMed.
- H. J. Eyring, J. Chem. Phys., 1935, 3, 107–115 CrossRef CAS.
- M. G. Evans and M. Polyani, Trans. Faraday Soc., 1935, 31, 875–894 RSC.
- D. J. Wales and P. Salamon, Proc. Natl. Acad. Sci. U. S. A., 2014, 111, 617–622 CrossRef CAS PubMed.
- J. D. Chodera and F. Noé, Curr. Opin. Struct. Biol., 2014, 25, 135–144 CrossRef CAS PubMed.
- D. Chakraborty, R. Collepardo-Guevara and D. J. Wales, J. Am. Chem. Soc., 2014, 136, 18052–18061 CrossRef CAS PubMed.
- Y. Chebaro, A. J. Ballard, D. Chakraborty and D. J. Wales, Sci. Rep., 2015, 5, 10386 CrossRef PubMed.
- W. Y. Chow, D. Bihan, C. J. Forman, D. A. Slatter, D. G. Reid, D. J. Wales, R. W. Farndale and M. J. Duer, Sci. Rep., 2015, 5, 12556 CrossRef CAS PubMed.
- C. Shang, C. S. Whittleston, K. H. Sutherland-Cash and D. J. Wales, J. Chem. Theory Comput., 2015, 11, 2307–2314 CrossRef CAS PubMed.
- D. J. Wales and T. Head-Gordon, J. Phys. Chem. B, 2012, 116, 8394–8411 CrossRef CAS PubMed.
- J. J. de Pablo, Annu. Rev. Phys. Chem., 2011, 62, 555–574 CrossRef CAS PubMed.
- D. A. Potoyan, A. Savelyev and G. A. Papoian, Wiley Interdiscip. Rev.: Comput. Mol. Sci., 2013, 3, 69–83 CrossRef CAS.
- W. G. Noid, J. Chem. Phys., 2013, 139, 090901 CrossRef CAS PubMed.
- J. Murrell and K. J. Laidler, Trans. Faraday Soc., 1968, 64, 371–377 RSC.
- Z. Li and H. A. Scheraga, Proc. Natl. Acad. Sci. U. S. A., 1987, 84, 6611–6615 CrossRef CAS.
- D. J. Wales and J. P. K. Doye, J. Phys. Chem. A, 1997, 101, 5111–5116 CrossRef CAS.
- D. J. Wales and H. A. Scheraga, Science, 1999, 285, 1368–1372 CrossRef CAS PubMed.
- K. Sutherland-Cash, D. J. Wales and D. Chakrabarti, Chem. Phys. Lett., 2015, 625, 1–4 CrossRef CAS.
- D. J. Wales, Mol. Phys., 2002, 100, 3285–3305 CrossRef CAS.
- D. J. Wales, Mol. Phys., 2004, 102, 891–908 CrossRef CAS.
- D. A. Evans and D. J. Wales, J. Chem. Phys., 2004, 121, 1080–1090 CrossRef CAS PubMed.
- B. Strodel and D. J. Wales, Chem. Phys. Lett., 2008, 466, 105–115 CrossRef CAS.
- O. M. Becker and M. Karplus, J. Chem. Phys., 1997, 106, 1495–1517 CrossRef CAS.
- D. J. Wales, M. A. Miller and T. R. Walsh, Nature, 1998, 394, 758–760 CrossRef CAS.
- S. V. Krivov and M. Karplus, J. Chem. Phys., 2002, 117, 10894–10903 CrossRef CAS.
- D. A. Evans and D. J. Wales, J. Chem. Phys., 2003, 118, 3891–3897 CrossRef CAS.
- J. P. K. Doye, D. J. Wales, F. H. M. Zetterling and M. Dzugutov, J. Chem. Phys., 2003, 118, 2792–2799 CrossRef CAS.
- M. C. Prentiss, D. J. Wales and P. G. Wolynes, J. Chem. Phys., 2008, 128, 225106 CrossRef PubMed.
- J. Nocedal, Math. Comput., 1980, 35, 773–782 CrossRef.
- D. C. Liu and J. Nocedal, Math. Program., 1989, 45, 503–528 CrossRef.
- P. G. Mezey, Potential Energy Hypersurfaces, Elsevier, Amsterdam, 1987 Search PubMed.
- D. J. Wales, J. Chem. Soc., Faraday Trans., 1992, 88, 653–657 RSC.
- D. J. Wales, GMIN: A program for finding global minima and calculating thermodynamic properties, http://www-wales.ch.cam.ac.uk/GMIN/, accessed Sep 29, 2016.
- S. A. Trygubenko and D. J. Wales, J. Chem. Phys., 2004, 120, 2082–2094 CrossRef CAS PubMed.
- D. Sheppard, R. Terrell and G. Henkelman, J. Chem. Phys., 2008, 128, 134106 CrossRef PubMed.
- Y. Zeng, P. Xiao and G. Henkelman, J. Chem. Phys., 2014, 140, 044115 CrossRef PubMed.
- G. Henkelman and H. Jónsson, J. Chem. Phys., 2000, 113, 9978–9985 CrossRef CAS.
- L. J. Munro and D. J. Wales, Phys. Rev. B: Condens. Matter Mater. Phys., 1999, 59, 3969–3980 CrossRef CAS.
- Y. Kumeda, D. J. Wales and L. J. Munro, Chem. Phys. Lett., 2001, 341, 185–194 CrossRef CAS.
- J. M. Carr, S. A. Trygubenko and D. J. Wales, J. Chem. Phys., 2005, 122, 234903 CrossRef PubMed.
- E. W. Dijkstra, Numer. Math., 1959, 1, 269–271 CrossRef.
- D. J. Wales, OPTIM: A program for optimising geometries and calculating pathways, http://www-wales.ch.cam.ac.uk/OPTIM/, accessed Sep 29, 2016.
- D. J. Wales, PATHSAMPLE: A driver for OPTIM to create stationary point databases using discrete path sampling and perform kinetic analysis, http://www-wales.ch.cam.ac.uk/PATHSAMPLE/, accessed Sep 29, 2016.
- B. Strodel, C. S. Whittleston and D. J. Wales, J. Am. Chem. Soc., 2007, 129, 16005–16014 CrossRef CAS PubMed.
- D. J. Wales, J. M. Carr, M. Khalili, V. K. de Souza, B. Strodel and C. S. Whittleston, Proteins: Energy, Heat and Signal Flow, CRC Press, 2009, p. 315 Search PubMed.
- F. H. Stillinger and T. A. Weber, Science, 1984, 225, 983–989 CAS.
- D. J. Wales, Mol. Phys., 1993, 78, 151–171 CrossRef CAS.
- F. H. Stillinger, Science, 1995, 267, 1935–1939 CAS.
- V. A. Sharapov, D. Meluzzi and V. A. Mandelshtam, Phys. Rev. Lett., 2007, 98, 105701 CrossRef PubMed.
- S. F. Chekmarev and I. H. Umirzakov, Z. Phys. D, 1993, 26, 373–376 CrossRef CAS.
- J. P. K. Doye and D. J. Wales, J. Chem. Phys., 1995, 102, 9659–9672 CrossRef CAS.
- J. P. K. Doye and D. J. Wales, J. Chem. Phys., 1995, 102, 9673–9688 CrossRef CAS.
- F. Calvo, J. P. K. Doye and D. J. Wales, J. Chem. Phys., 2001, 115, 9627–9636 CrossRef CAS.
- F. Calvo, J. P. K. Doye and D. J. Wales, J. Chem. Phys., 2001, 114, 7312–7329 CrossRef CAS.
- I. Georgescu and V. A. Mandelshtam, J. Chem. Phys., 2012, 137, 144106 CrossRef PubMed.
- J. A. Joseph, C. S. Whittleston and D. J. Wales, J. Chem. Theory Comput., 2016, 12, 6109–6117 CrossRef CAS PubMed.
- H. Gohlke and M. F. Thorpe, Biophys. J., 2006, 91, 2115–2120 CrossRef CAS PubMed.
- Z. Zhang, L. Lu, W. G. Noid, V. Krishna, J. Pfaendtner and G. Voth, Biophys. J., 2008, 95, 5073–5083 CrossRef CAS PubMed.
- C. Clementi, Curr. Opin. Struct. Biol., 2008, 18, 10–15 CrossRef CAS PubMed.
- M. G. Saunders and G. A. Voth, Annu. Rev. Biophys., 2013, 42, 73–93 CrossRef CAS PubMed.
- H. I. Ingólfsson, C. A. Lopez, J. J. Uusitalo, D. H. de Jong, S. M. Gopal, X. Periole and S. J. Marrink, Wiley Interdiscip. Rev.: Comput. Mol. Sci., 2014, 4, 225–248 CrossRef PubMed.
- D. J. Wales, Philos. Trans. R. Soc., A, 2005, 363, 357–377 CrossRef CAS PubMed.
- D. Chakrabarti and D. J. Wales, Phys. Chem. Chem. Phys., 2009, 11, 1970–1976 RSC.
- H. Kusumaatmaja, C. S. Whittleston and D. J. Wales, J. Chem. Theory Comput., 2012, 8, 5159–5165 CrossRef CAS PubMed.
- V. Rühle, H. Kusumaatmaja, D. Chakrabarti and D. J. Wales, J. Chem. Theory Comput., 2013, 9, 4026–4034 CrossRef PubMed.
- P. Tao, A. J. Sodt, Y. Shao, G. König and B. Brooks, J. Chem. Theory Comput., 2014, 10, 4198–4207 CrossRef CAS PubMed.
- A. G. Cochran, N. J. Skelton and M. A. Starovasnik, Proc. Natl. Acad. Sci. U. S. A., 2001, 98, 5578–5583 CrossRef CAS PubMed.
- V. Hornak, R. Abel, A. Okur, B. Strockbine, A. Roitberg and C. Simmerling, Proteins: Struct., Funct., Bioinf., 2006, 65, 712–725 CrossRef CAS PubMed.
- D. J. Wales and J. P. K. Doye, J. Chem. Phys., 2003, 119, 12409–12416 CrossRef CAS.
- R. G. Mantell, C. E. Pitt and D. J. Wales, J. Chem. Theory Comput., 2016, 12, 6182–6191 CrossRef CAS PubMed.
- CUDA C Programming Guide, http://docs.nvidia.com/cuda/cuda-c-programming-guide/, accessed Sep 21, 2016.
- A. W. Götz, M. J. Williamson, D. Xu, D. Poole, S. Le Grand and R. C. Walker, J. Chem. Theory Comput., 2012, 8, 1542–1555 CrossRef PubMed.
- CudaLBFGS, http://https://github.com/jwetzl/CudaLBFGS, accessed Oct 1, 2013.
- J. Wetzl, O. Taubmann, S. Haase, T. Köhler, M. Kraus and J. Hornegger, Bildverarbeitung für die Medizin 2013: Algorithmen – Systeme – Anwendungen. Proceedings des Workshops vom 3. bis 5. März 2013 in Heidelberg, Springer, Berlin, Heidelberg, 2013, pp. 21–26 Search PubMed.
- cuBLAS, http://https://developer.nvidia.com/cublas, accessed Sep 21, 2016.
- S. Chutinimitkul, S. Herfst, J. Steel, A. C. Lowen, J. Ye, D. van Riel, E. J. Schrauwen, T. M. Bestebroer, B. Koel, D. F. Burke, K. H. Sutherland-Cash, C. S. Whittleston, C. A. Russell, D. J. Wales, D. J. Smith, M. Jonges, A. Meijer, M. Koopmans, G. F. Rimmelzwaan, T. Kuiken, A. D. Osterhaus, A. García-Sastre, D. R. Perez and R. A. Fouchier, J. Virol., 2010, 84, 11802–11813 CrossRef CAS PubMed.
- J. Nocedal and S. J. Wright, Numerical Optimization, Springer, New York, 2nd edn, 2006, ch. 7, pp. 176–180 Search PubMed.
- M. Karplus, Folding Des., 1997, 2, S69–S75 CrossRef CAS PubMed.
- J. D. Bryngelson and P. G. Wolynes, Proc. Natl. Acad. Sci. U. S. A., 1987, 84, 7524–7528 CrossRef CAS.
- P. E. Leopold, M. Montal and J. N. Onuchic, Proc. Natl. Acad. Sci. U. S. A., 1992, 89, 8721–8725 CrossRef CAS.
- K. Röder and D. J. Wales, J. Chem. Theory Comput., 2017, 13, 1468–1477 CrossRef PubMed.
- E. D. Nelson and J. N. Onuchic, Proc. Natl. Acad. Sci. U. S. A., 1998, 95, 10682–10686 CrossRef CAS.
- B. V. Reddy, S. Datta and S. Tiwari, Protein Eng., 1998, 11, 1137–1145 CrossRef CAS PubMed.
- D. M. Taverna and R. A. Goldstein, J. Mol. Biol., 2002, 315, 479–484 CrossRef CAS PubMed.
- D. M. Taverna and R. A. Goldstein, Proteins, 2002, 46, 105–109 CrossRef CAS PubMed.
- M. K. Yadav, L. J. Leman, D. J. Price, C. L. Brooks, C. D. Stout and M. R. Ghadiri, Biochemistry, 2006, 45, 4463–4473 CrossRef CAS PubMed.
- Y. Deng, J. Liu, Q. Zheng, Q. Li, N. R. Kallenbach and M. Lu, Chem. Biol., 2008, 15, 908–919 CrossRef CAS PubMed.
- Y. Gambin, A. Schug, E. A. Lemke, J. J. Lavinder, A. C. M. Ferreon, T. J. Magliery, J. N. Onuchic and A. A. Deniz, Proc. Natl. Acad. Sci. U. S. A., 2009, 106, 10153–10158 CrossRef CAS PubMed.
- J. Ramos and T. Lazaridis, Protein Sci., 2011, 20, 1845–1855 CrossRef CAS PubMed.
- S. Rämisch, R. Lizatović and I. André, Proteins, 2015, 83, 235–247 CrossRef PubMed.
- G. Grigoryan and A. Keating, Curr. Opin. Struct. Biol., 2008, 18, 477–483 CrossRef CAS PubMed.
- E. Małolepsza, B. Strodel, M. Khalili, S. Trygubenko, S. N. Fejer and D. J. Wales, J. Comput. Chem., 2010, 31, 1402–1409 Search PubMed.
- E. Małolepsza, B. Strodel, M. Khalili, S. Trygubenko, S. N. Fejer and D. J. Wales, J. Comput. Chem., 2012, 33, 2209 CrossRef.
- D. A. Case, T. Darden, T. E. Cheatham III, C. Simmerling, J. Wang, R. Duke, R. Luo, R. Walker, W. Zhang, K. Merz, B. Roberts, S. Hayik, A. Roitberg, G. Seabra, J. Swails, A. Götz, I. Kolossváry, K. Wong, F. Paesani, J. Vanicek, R. Wolf, J. Liu, X. Wu, S. Brozell, T. Steinbrecher, H. Gohlke, Q. Cai, X. Ye, J. Wang, M.-J. Hsieh, G. Cui, D. Roe, D. Mathews, M. Seetin, R. Salomon-Ferrer, C. Sagui, V. Babin, T. Luchko, S. Gusarov, A. Kovalenko and P. Kollman, AMBER12, 2012 Search PubMed.
- S. J. Weiner, P. A. Kollman, D. T. Nguyen and D. A. Case, J. Comput. Chem., 1986, 7, 230–252 CrossRef CAS.
- D. A. Pearlman, D. A. Case, J. W. Caldwell, W. S. Ross, T. E. Cheatham III, S. DeBolt, D. Ferguson, G. Seibel and P. Kollman, Comput. Phys. Commun., 1995, 91, 1–41 CrossRef CAS.
- A. Onufriev, D. Bashford and D. A. Case, J. Phys. Chem. B, 2000, 104, 3712–3720 CrossRef CAS.
- A. Onufriev, D. Bashford and D. A. Case, Proteins, 2004, 55, 383–394 CrossRef CAS PubMed.
- J. Srinivasan, M. W. Trevathan, P. Beroza and D. A. Case, Theor. Chem. Acc., 1999, 101, 426–434 CrossRef CAS.
- D. J. Wales, Phys. Rev. E, 2017, 95, 030105 CrossRef PubMed.
- F. M. Pohl and T. M. Jovin, J. Mol. Biol., 1972, 67, 375–396 CrossRef CAS PubMed.
- A. H.-J. Wang, G. J. Quigley, F. J. Kolpak, J. L. Crawford, J. H. van Boom, G. van der Marel and A. Rich, Nature, 1979, 282, 680–686 CrossRef CAS PubMed.
- T. J. Thamann, R. C. Lord, A. H. Wang and A. Rich, Nucleic Acids Res., 1981, 9, 5443–5457 CrossRef CAS PubMed.
- A. Rich, A. Nordheim and A. H. J. Wang, Annu. Rev. Biochem., 1984, 53, 791–846 CrossRef CAS PubMed.
- A. Rich and S. Zhang, Nat. Rev. Genet., 2003, 4, 566–572 CrossRef CAS PubMed.
- A. Herbert and A. Rich, Struct. Biol. Funct. Genomics, Springer, Netherlands, Dordrecht, 1999, pp. 53–72 Search PubMed.
- A. Jaworski, W. Zacharias, W.-T. Hsieh, J. A. Blaho, J. E. Larson and R. D. Wells, Gene, 1988, 74, 215–220 CrossRef CAS PubMed.
- A. Jaworski, W. T. Hsieh, J. A. Blaho, J. E. Larson and R. D. Wells, Science, 1987, 238, 773–777 CAS.
- R. Liu, H. Liu, X. Chen, M. Kirby, P. O. Brown and K. Zhao, Cell, 2001, 106, 309–318 CrossRef CAS PubMed.
- M. Guéron, J. Demaret and M. Filoche, Biophys. J., 2000, 78, 1070–1083 CrossRef.
- T. M. Jovin, D. M. Soumpasis and L. P. McIntosh, Annu. Rev. Phys. Chem., 1987, 38, 521–558 CrossRef CAS.
- F. Azorin, A. Nordheim and A. Rich, EMBO J., 1983, 2, 649–655 CAS.
- A. Nordheim and A. Rich, Proc. Natl. Acad. Sci. U. S. A., 1983, 80, 1821–1825 CrossRef CAS.
- A. Nordheim, E. M. Lafer, L. J. Peck, J. C. Wang, B. D. Stollar and A. Rich, Cell, 1982, 31, 309–318 CrossRef CAS PubMed.
- W. Zacharias, A. Jaworski and R. D. Wells, J. Bacteriol., 1990, 172, 3278–3283 CrossRef CAS PubMed.
- M. Behe and G. Felsenfeld, Proc. Natl. Acad. Sci. U. S. A., 1981, 78, 1619–1623 CrossRef CAS.
- Y. Xu, R. Ikeda and H. Sugiyama, J. Am. Chem. Soc., 2003, 125, 13519–13524 CrossRef CAS PubMed.
- H. Takeuchi, N. Hanamura and I. Harada, J. Mol. Biol., 1994, 236, 610–617 CrossRef CAS PubMed.
- T. Schwartz, J. Behlke, K. Lowenhaupt, U. Heinemann and A. Rich, Nat. Struct. Mol. Biol., 2001, 8, 761–765 CAS.
- M. A. Fuertes, V. Cepeda, C. Alonso and J. M. Pérez, Chem. Rev., 2006, 106, 2045–2064 CrossRef CAS PubMed.
- S. Harvey, Nucleic Acids Res., 1983, 11, 4867–4868 CrossRef CAS PubMed.
- W. Saenger and U. Heinemann, FEBS Lett., 1989, 257, 223–227 CrossRef CAS PubMed.
- W. Lim and Y. P. Feng, Biopolymers, 2005, 78, 107–120 CrossRef CAS PubMed.
- W. Lim and Y. P. Feng, Biophys. J., 2005, 88, 1593–1607 CrossRef CAS PubMed.
- L. J. Peck and J. Wang, Proc. Natl. Acad. Sci. U. S. A., 1983, 80, 6206–6210 CrossRef CAS.
- P. S. Ho, Proc. Natl. Acad. Sci. U. S. A., 1994, 91, 9549–9553 CrossRef CAS.
- A. Pérez, I. Marchán, D. Svozil, J. Šponer, T. E. Cheatham, C. A. Laughton and M. Orozco, Biophys. J., 2007, 92, 3817–3829 CrossRef PubMed.
- M. Zgarbová, F. J. Luque, J. Šponer, T. E. Cheatham, M. Otyepka and P. Jurečka, J. Chem. Theory Comput., 2013, 9, 2339–2354 CrossRef PubMed.
- D. Chakraborty and D. J. Wales, Phys. Chem. Chem. Phys., 2017, 19, 878–892 RSC.
- J. M. Carr and D. J. Wales, J. Phys. Chem. B, 2008, 112, 8760–8769 CrossRef CAS PubMed.
- P. Cluzel, A. Lebrun, C. Heller, J. L. Vivoy and F. Caron, Science, 1996, 271, 792–794 CAS.
- N. Bosaeus, A. H. El-Sagheer, T. Brown, S. B. Smith, B. Åkerman, C. Bustamante and B. Nordén, Proc. Natl. Acad. Sci. U. S. A., 2012, 109, 15179–15184 CrossRef CAS PubMed.
- M. Moradi, V. Babin, C. Roland and C. Sagui, Nucleic Acids Res., 2013, 41, 33–43 CrossRef CAS PubMed.
- L. Yang and B. M. Pettitt, J. Phys. Chem., 1996, 100, 2564–2566 CrossRef CAS.
- T. E. Cheatham and P. A. Kollman, Structure, 1997, 5, 1297–1311 CrossRef CAS PubMed.
- C. R. Calladine and H. R. Drew, J. Mol. Biol., 1984, 178, 773–782 CrossRef CAS PubMed.
| This journal is © The Royal Society of Chemistry 2017 |