
 Open Access Article
 This Open Access Article is licensed under a
 Creative Commons Attribution 3.0 Unported Licence
In situ investigation of degradation at organometal halide perovskite surfaces by X-ray photoelectron spectroscopy at realistic water vapour pressure†
Jack
Chun-Ren Ke
 ab,
Alex S.
Walton
bc,
David J.
Lewis
d,
Aleksander
Tedstone
c,
Paul
O'Brien
c,
Andrew G.
Thomas
*bd and
Wendy R.
Flavell
*ab
ab,
Alex S.
Walton
bc,
David J.
Lewis
d,
Aleksander
Tedstone
c,
Paul
O'Brien
c,
Andrew G.
Thomas
*bd and
Wendy R.
Flavell
*ab
aSchool of Physics and Astronomy, The University of Manchester, Oxford Road, Manchester, M13 9PL, UK. E-mail: wendy.flavell@manchester.ac.uk
bPhoton Science Institute, The University of Manchester, Oxford Road, Manchester, M13 9PL, UK. E-mail: andrew.g.thomas@manchester.ac.uk
cSchool of Chemistry, The University of Manchester, Oxford Road, Manchester, M13 9PL, UK
dSchool of Materials, The University of Manchester, Oxford Road, Manchester, M13 9PL, UK
First published on 19th April 2017
Abstract
Near-ambient-pressure X-ray photoelectron spectroscopy enables the study of the reaction of in situ-prepared methylammonium lead iodide (MAPI) perovskite at realistic water vapour pressures for the first time. We show that MAPI decomposes directly to PbI2, HI and NH3 without formation of methylammonium iodide, allowing us to distinguish between alternative mechanisms for the atmospheric degradation reaction.
Organometal halide perovskite (OHP) absorbers have rapidly emerged as one of the most promising photovoltaic materials for use in solar cells due to their high visible to near-infrared light absorptivity,1–4 remarkably low exciton binding energy,5 and extraordinarily long diffusion length for electrons and holes.6,7 As a result, perovskite solar cells (PSCs) have achieved certified power conversion efficiencies of more than 20%,8 in just over 7 years from the initial discovery of the photovoltaic effect in TiO2 coated with nanocrystalline perovskite.9 These efficiencies are now comparable to those of commercial polycrystalline silicon solar cells. However, OHPs show poor long-term stability, particularly when exposed to humid atmospheres which means that there are questions about the commercial exploitation of PSCs in solar panels.10 Improving the stability of OHP absorbers is of paramount importance, but only with insight into the degradation mechanisms at the atomic level can solutions thus be realised.
Numerous characterisation techniques have been applied to investigate the degradation mechanism, such as ultraviolet-visible (UV-Vis) spectroscopy,11–13 X-ray diffraction (XRD),11,13,14 Raman spectroscopy,15 and X-ray photoelectron spectroscopy (XPS).16–18 This latter technique is useful since it allows in situ deposition of the films in an ultrahigh vacuum (UHV) environment,17,19–21 so that degradation of the films before measurement is ruled out. Several XPS studies have been carried out to determine the surface composition or film growth mechanism,19–27 and band alignment.28–30
Despite these studies, the mechanism of degradation of pristine films at the atomic and nanometre scale remains imprecisely defined. Currently, two models of OHP degradation have been proposed. The first involves the water-catalysed loss of nitrogen, in the form of ammonia, and hydrogen iodide via the reaction (eqn (1)):17
 | (1) |
 | (2) |
The MAPI film was prepared in UHV by vacuum deposition of PbCl2 and MAI onto a SrTiO3(100) single crystal substrate, using the two-step route of Liu et al. (see ESI† for details of preparation and characterisation).32Fig. 1a shows high-resolution NAPXPS spectra of the Sr 3d and Pb 4f core levels recorded from the MAPI film before water exposure, during water exposure at H2O vapour pressures of 3 mbar (RH 10%) and 9 mbar (RH 30%), and after the water vapour has been removed and the system returned to UHV conditions. The intensity is normalised to the integrated area of the Sr 3d5/2 peak from the SrTiO3 substrate, which allows comparison of the intensity of the Pb 4f peaks as a function of water exposure. All photoelectron binding energies are quoted to a precision of ±0.05 eV. Prior to exposure to H2O vapour and under UHV, the Pb 4f7/2 peak of the perovskite film is located at a binding energy (BE) of 138.60 eV, which is in excellent agreement with previous reports for the Pb in MAPI perovskite materials (denoted ‘Pb-I’ in Fig. 1).16,22,30,33 We note that there is a weaker Pb 4f7/2 peak at 136.80 eV, which is attributed to metallic lead.16,22,30,33 This has been observed for several perovskite materials, such as MAPI,16,22,27,33 MAPbI2Cl,34 MAPbBr3.33 Metallic lead is often observed in MAPI perovskite films, both for the standard solution-processed films35,36 and CVD-deposited films.22 In the study presented here the metallic Pb probably arises due to decomposition of the PbCl2 precursor vapour during the initial deposition step;21 some beam-induced decomposition cannot be ruled out, but is not the major source of elemental Pb (as we discuss further below). No Cl was observed in survey scans (see Fig. S1, ESI†). The Pb![[thin space (1/6-em)]](https://www.rsc.org/images/entities/char_2009.gif) :I:N stoichiometry of the film determined from XPS, excluding the metallic Pb component, was found to be 1.0 ± 0.1:2.7 ± 0.1:0.9 ± 0.2 (Table 1), in good agreement with the nominal stoichiometry of MAPI. Quantification of the XPS signals is discussed further below and in the ESI† (Tables S1–S3).
:I:N stoichiometry of the film determined from XPS, excluding the metallic Pb component, was found to be 1.0 ± 0.1:2.7 ± 0.1:0.9 ± 0.2 (Table 1), in good agreement with the nominal stoichiometry of MAPI. Quantification of the XPS signals is discussed further below and in the ESI† (Tables S1–S3).
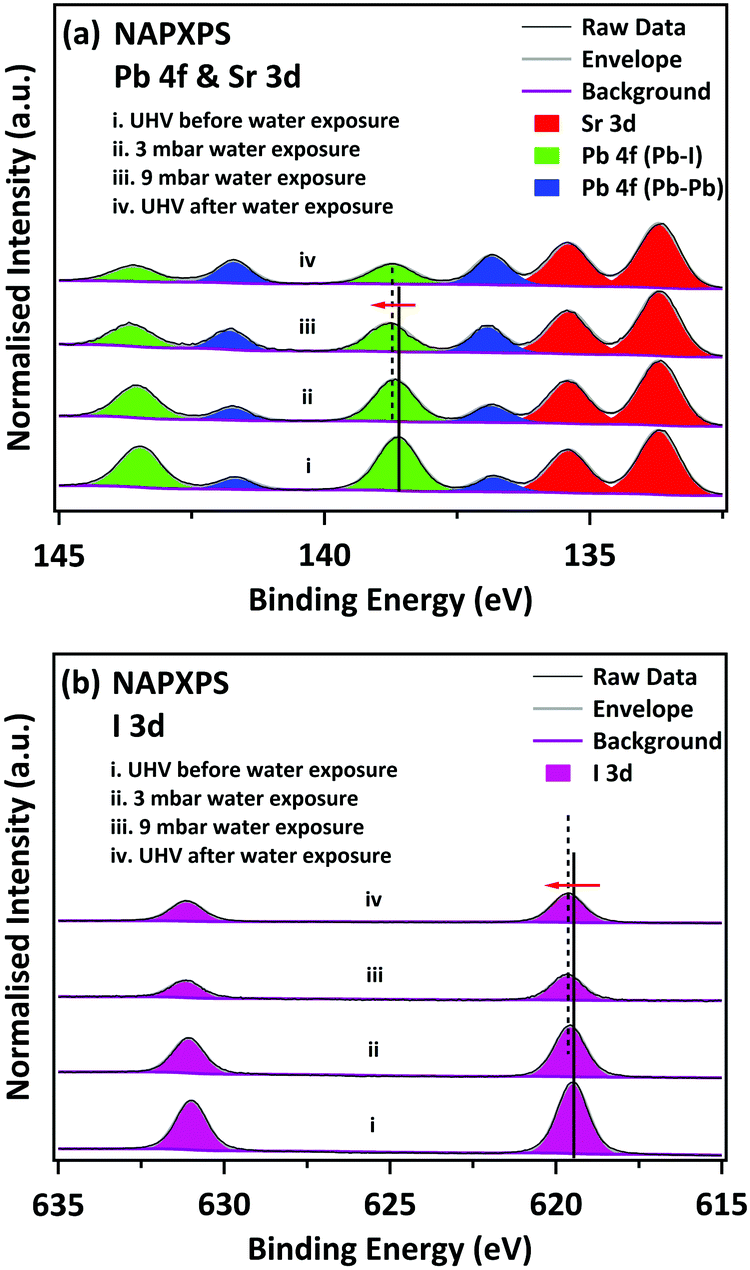 | ||
| Fig. 1 NAPXPS spectra of (a) Pb 4f & Sr 3d, and (b) I 3d core levels under various conditions as noted (before/during/after water exposure). All the spectra are normalised to the corresponding integrated area of the Sr 3d5/2 peak. | ||
| Status ID | I/Pb | N/Pb |
|---|---|---|
| UHV before water exposure | 2.7 ± 0.1 | 0.9 ± 0.2 |
| UHV after water exposure | 2.4 ± 0.1 | 0.0 ± 0.2 |
Fig. 1(a) shows Pb 4f and Sr 3d spectra recorded during exposure to H2O vapour. The Pb–I features decrease in intensity, whilst the metallic Pb features increase in intensity. The BE of the Pb 4f7/2 Pb–I feature shifts upwards slightly to 138.70 eV on exposure to 3 mbar H2O and to 138.80 eV when the water exposure is increased to 9 mbar. This may be due to the formation of lead iodide (Pb 4f7/2 BE = 138.90 eV);16 however the peak cannot be resolved into individual components arising from MAPI and PbI2. The BE of the MAPI/PbI2 peak recorded after water exposure, when the water vapour is pumped away and the sample returned to ultra-high vacuum conditions (Fig. 1(a)-iv), is not shifted relative to the spectrum recorded at a water vapour pressure of 9 mbar (Fig. 1(a)-iii). This suggests that the presence of water vapour is not responsible for the observed binding energy shifts, i.e. the shifts are due to changes in the nature of the material. The data recorded following removal of the water vapour indicate that the changes induced by exposure to water vapour are not reversible. We observe an additional increase in the intensity of the metallic-lead-derived peak in the UHV spectrum taken following water exposure. In synchrotron studies this was attributed to beam damage,16 and it is well known that PbI2 slowly decomposes to Pb and I2 under illumination with visible light.37 However, spectra taken at this stage from fresh points on the sample surface (see ESI,† Fig. S3) show a similar surface stoichiometry to that in Fig. 1(a)-iv, and in particular, similar amounts of metallic Pb. We conclude that the decomposition of PbI2 into Pb and I2 cannot be attributed solely to beam damage.
Fig. 1b shows I 3d core-level spectra, also normalised to the integrated area of the Sr 3d5/2 peak. The BE of the I 3d5/2 shifts towards higher BE, from 619.50 eV (UHV before) to 619.60 eV at 3 mbar water exposure and reaches 619.65 eV at 9 mbar water exposure. The change in BE matches the changes in the Pb 4f spectra. The I signal decreases significantly upon water exposure, suggesting it is lost from the surface, which is not consistent with a degradation mechanism resulting in the formation of MAI. We note that the intensity increases slightly when the water vapour is removed. This is a consequence of the lower kinetic energy of the I 3d electrons relative to Pb 4f. Lower kinetic energy electrons are less likely to be detected by the analyser than high energy ones as the gas pressure in the NAPXPS cell is increased.
Fig. 2 shows the C 1s and Sr 3p spectra. The C 1s spectrum allows us to investigate the behaviour of the organic part of the perovskite under water vapour exposure. The Sr 3p3/2 peaks are located at 269.20 eV, consistent with Sr–O bonding.38 The clean SrTiO3 spectrum shows a very weak signal associated with a small amount of residual adventitious carbon. In the freshly-prepared MAPI film we observe two C species in the C 1s spectrum. The larger C 1s peak is located at a BE of 285.35 eV. This peak has been assigned both to CH3I,21 and to C–C bonds (hydrocarbon).21 Ng et al. linked the formation of the C–C species to reaction with PbI2,22 but it is perhaps more likely to occur due to decomposition of the precursors or simply due to outgassing of the sources during evaporation of the films. A shoulder is also observed at 286.85 eV, 1.5 eV higher than the main peak, corresponding to C–N bonding in the MAPI perovskite.16,17,21,34 However, as discussed below, we believe this feature also contains contributions from C![[double bond, length as m-dash]](https://www.rsc.org/images/entities/char_e001.gif) O/C–OH groups in the hydrocarbon contamination. We do not believe the MAI precursor contributes significantly to the higher binding energy feature here, since the core level shift in the C 1s feature between C–C/CH3I and C–N in MAI is larger at 1.9 eV,22 than the 1.5 eV measured here. Upon exposure to water vapour, the relative intensities of the C 1s peaks change substantially. The higher energy peak, which contains contributions from C–N in the MAPI, is seen to decrease in intensity. During and after exposure to 9 mbar water vapour there is an increase in the relative intensity of the lower binding energy feature as C–N is converted to CH, consistent with the mechanism proposed in eqn (1).
O/C–OH groups in the hydrocarbon contamination. We do not believe the MAI precursor contributes significantly to the higher binding energy feature here, since the core level shift in the C 1s feature between C–C/CH3I and C–N in MAI is larger at 1.9 eV,22 than the 1.5 eV measured here. Upon exposure to water vapour, the relative intensities of the C 1s peaks change substantially. The higher energy peak, which contains contributions from C–N in the MAPI, is seen to decrease in intensity. During and after exposure to 9 mbar water vapour there is an increase in the relative intensity of the lower binding energy feature as C–N is converted to CH, consistent with the mechanism proposed in eqn (1).
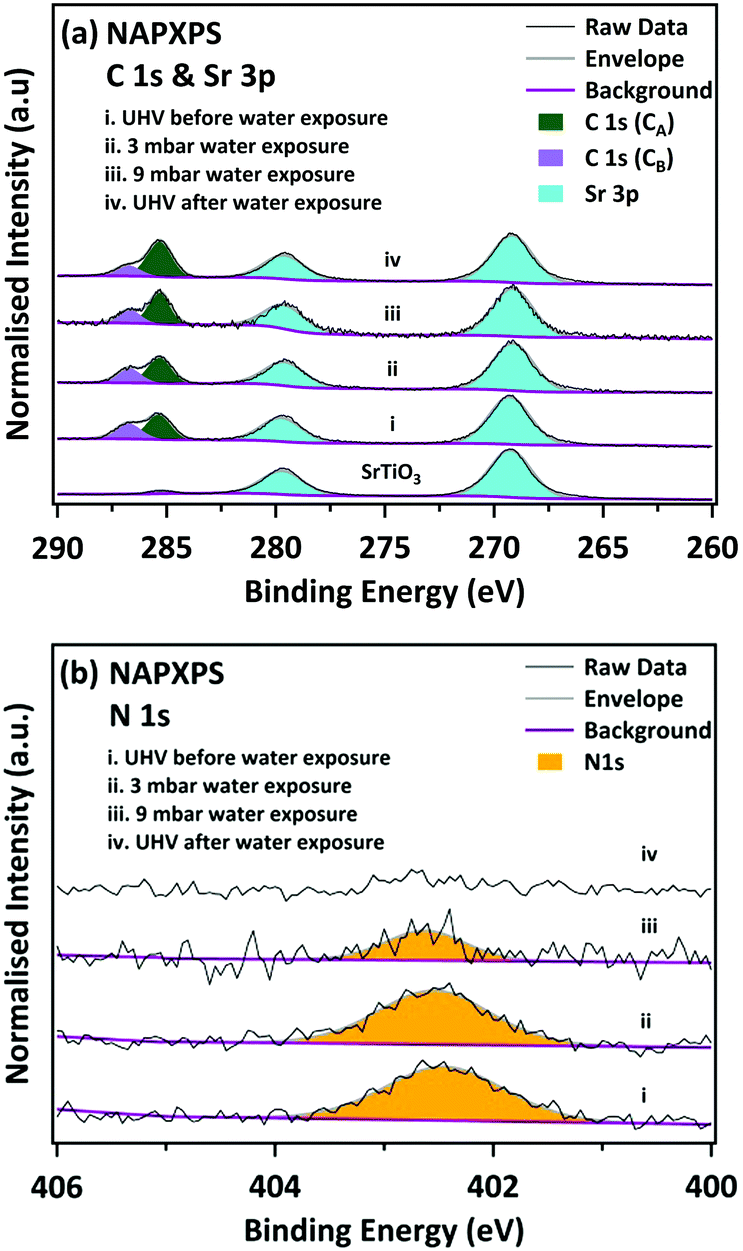 | ||
| Fig. 2 NAPXPS spectra of (a) C 1s & Sr 3p, and (b) N 1s core levels before/during/after water exposure. All spectra are normalised to the corresponding integrated area of the Sr 3d5/2 peak. | ||
Stronger evidence for the cleavage of the C–N bond is seen in the corresponding N 1s spectra in Fig. 2. Before exposure to water vapour, the N 1s spectrum of the pristine sample lies at a binding energy of 402.45 eV, in good agreement with the methylammonium group in MAPI.16,21 During and after exposure to water the N 1s peak is seen to dramatically decrease in intensity during water exposure, and after water exposure the N 1s signal cannot be reliably distinguished from the spectral noise. This confirms that at least some of the intensity in the C 1s peak at 286.75 eV arises from other carbon species (such as CO/C–OH), since there is some remnant intensity, even after all of the N 1s signal is removed. During and after exposure to 9 mbar water vapour there is an increase in the relative intensity of the lower binding energy feature which may be due to conversion of C–N to C–H/C–C, consistent with the mechanism proposed in eqn (1).
The stoichiometry of the film before and after water exposure is calculated from the integrated peak areas, using CASAXPS sensitivity factors (Table 1).39 These calculations are only performed for the sample under UHV conditions, since RSFs are not available for the analyser under near-ambient conditions. As noted above, the Pb:I:N: ratio of the as-deposited film is close to the expected stoichiometry. Following H2O vapour exposure the Pb/I ratio decreases and N is completely lost from the surface. Although obtaining information on the stoichiometry of the C part of the material is difficult because of the hydrocarbon contamination, there are some observations which support the decomposition of MAPI to form NH3. The decrease in intensity of the higher binding energy component of the C 1s spectrum is consistent with the overall loss of N (see ESI,† Table S2). In addition, we find that the total amount C at the surface remains constant, suggesting that C–N is converted to –CH2– in accordance with eqn (1).
The evidence from NAPXPS strongly supports a decomposition mechanism similar to that suggested by Li et al. (eqn (1)),17 where nitrogen is lost from the perovskite via reaction with water to give NH3(g). The results are consistent with conversion of lead in the MAPI film to PbI2 (I/Pb is significantly reduced, Table 1), some of which is then further decomposed as shown in eqn (3).
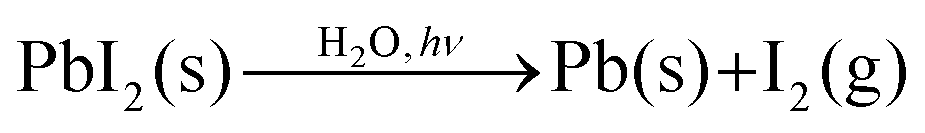 | (3) |
In conclusion, XPS analysis suggests a stoichiometric MAPI thin film was successfully fabricated via vapour deposition, in good agreement with previous studies.40,41 The data clearly demonstrate the pathway of water-induced degradation of the MAPI film at relative humidity similar to those found in ambient air, using NAPXPS. It is shown that MAI is not formed during decomposition of MAPI during water exposure. The data suggest that at 9 mbar water vapour exposure, MAPI is almost completely transformed into a mixture of Pb, PbI2 and hydrocarbon species, with a complete loss of nitrogen from the surface. The work further demonstrates the potential for NAPXPS in understanding the surface degradation of materials under atmospheric conditions. In this case it allows us to distinguish unambiguously between the proposed mechanistic pathways,16,17 potentially allowing methodologies for mitigating the degradation to be developed.
The authors thank the University of Manchester and EPSRC (UK) (grant number EP/K009710) for funding. C. R. Ke thanks the University of Manchester for the award of a President's Doctoral Scholarship.
Notes and references
- F. Hao, C. C. Stoumpos, D. H. Cao, R. P. Chang and M. G. Kanatzidis, Nat. Photonics, 2014, 8, 489–494 CrossRef CAS
.
- N. J. Jeon, J. H. Noh, W. S. Yang, Y. C. Kim, S. Ryu, J. Seo and S. I. Seok, Nature, 2015, 517, 476–480 CrossRef CAS PubMed
- M. M. Lee, J. Teuscher, T. Miyasaka, T. N. Murakami and H. J. Snaith, Science, 2012, 338, 643–647 CrossRef CAS PubMed
- P. Qin, H. Kast, M. K. Nazeeruddin, S. M. Zakeeruddin, A. Mishra, P. Bäuerle and M. Grätzel, Energy Environ. Sci., 2014, 7, 2981–2985 CAS
- A. Miyata, A. Mitioglu, P. Plochocka, O. Portugall, J. T.-W. Wang, S. D. Stranks, H. J. Snaith and R. J. Nicholas, Nat. Phys., 2015, 11, 582–587 CrossRef CAS
- S. D. Stranks, G. E. Eperon, G. Grancini, C. Menelaou, M. J. Alcocer, T. Leijtens, L. M. Herz, A. Petrozza and H. J. Snaith, Science, 2013, 342, 341–344 CrossRef CAS PubMed
- A. A. Zhumekenov, M. I. Saidaminov, M. A. Haque, E. Alarousu, S. P. Sarmah, B. Murali, I. Dursun, X.-H. Miao, A. L. Abdelhady and T. Wu, ACS Energy Lett., 2016, 1, 32–37 CrossRef CAS
- M. A. Green, K. Emery, Y. Hishikawa, W. Warta and E. D. Dunlop, Prog. Photovoltaics: Res. Appl., 2016, 24, 905–913 CrossRef
- A. Kojima, K. Teshima, Y. Shirai and T. Miyasaka, J. Am. Chem. Soc., 2009, 131, 6050–6051 CrossRef CAS PubMed
- T. A. Berhe, W.-N. Su, C.-H. Chen, C.-J. Pan, J.-H. Cheng, H.-M. Chen, M.-C. Tsai, L.-Y. Chen, A. A. Dubale and B.-J. Hwang, Energy Environ. Sci., 2016, 9, 323–356 CAS
- G. Niu, W. Li, F. Meng, L. Wang, H. Dong and Y. Qiu, J. Mater. Chem. A, 2014, 2, 705–710 CAS
- F. Matsumoto, S. M. Vorpahl, J. Q. Banks, E. Sengupta and D. S. Ginger, J. Phys. Chem. C, 2015, 119, 20810–20816 CAS
- J. Yang, B. D. Siempelkamp, D. Liu and T. L. Kelly, ACS Nano, 2015, 9, 1955–1963 CrossRef CAS PubMed
- Y. Han, S. Meyer, Y. Dkhissi, K. Weber, J. M. Pringle, U. Bach, L. Spiccia and Y.-B. Cheng, J. Mater. Chem. A, 2015, 3, 8139–8147 CAS
- M. Ledinsky, P. Löper, B. Niesen, J. Holovsky, S.-J. Moon, J.-H. Yum, S. De Wolf, A. Fejfar and C. Ballif, J. Phys. Chem. Lett., 2015, 6, 401–406 CrossRef CAS PubMed
- B. Philippe, B.-W. Park, R. Lindblad, J. Oscarsson, S. Ahmadi, E. M. Johansson and H. K. Rensmo, Chem. Mater., 2015, 27, 1720–1731 CrossRef CAS
- Y. Li, X. Xu, C. Wang, C. Wang, F. Xie, J. Yang and Y. Gao, J. Phys. Chem. C, 2015, 119, 23996–24002 CAS
- W. Huang, J. S. Manser, P. V. Kamat and S. Ptasinska, Chem. Mater., 2015, 28, 303–311 CrossRef
- Y. Li, X. Xu, C. Wang, C. Wang, F. Xie, J. Yang and Y. Gao, AIP Adv., 2015, 5, 097111 CrossRef
- X. Zhou, X. Li, Y. Liu, F. Huang and D. Zhong, Appl. Phys. Lett., 2016, 108, 121601 CrossRef
- L. Liu, J. A. McLeod, R. Wang, P. Shen and S. Duhm, Appl. Phys. Lett., 2015, 107, 061904 CrossRef
- T.-W. Ng, C.-Y. Chan, M.-F. Lo, Z. Q. Guan and C.-S. Lee, J. Mater. Chem. A, 2015, 3, 9081–9085 CAS
- G. R. Kumar, A. D. Savariraj, S. Karthick, S. Selvam, B. Balamuralitharan, H.-J. Kim, K. Viswanathan, M. Vijaykumar and K. Prabakar, Phys. Chem. Chem. Phys., 2016, 18, 7284–7292 RSC
- J. Emara, T. Schnier, N. Pourdavoud, T. Riedl, K. Meerholz and S. Olthof, Adv. Mater., 2016, 28, 553–559 CrossRef CAS PubMed
- M.-C. Jung, Y. M. Lee, H.-K. Lee, J. Park, S. R. Raga, L. K. Ono, S. Wang, M. R. Leyden, B. D. Yu and S. Hong, Appl. Phys. Lett., 2016, 108, 073901 CrossRef
- H. Yu, F. Wang, F. Xie, W. Li, J. Chen and N. Zhao, Adv. Funct. Mater., 2014, 24, 7102–7108 CAS
- H. Xie, X. Liu, L. Lyu, D. Niu, Q. Wang, J. Huang and Y. Gao, J. Phys. Chem. C, 2015, 120, 215–220 Search PubMed
- T. Ding, R. Li, W. Kong, B. Zhang and H. Wu, Appl. Surf. Sci., 2015, 357, 1743–1746 CrossRef CAS
- E. M. Miller, Y. Zhao, C. C. Mercado, S. K. Saha, J. M. Luther, K. Zhu, V. Stevanović, C. L. Perkins and J. van de Lagemaat, Phys. Chem. Chem. Phys., 2014, 16, 22122–22130 RSC
- R. Lindblad, D. Bi, B.-W. Park, J. Oscarsson, M. Gorgoi, H. Siegbahn, M. Odelius, E. M. Johansson and H. K. Rensmo, J. Phys. Chem. Lett., 2014, 5, 648–653 CrossRef CAS PubMed
- A. Dualeh, P. Gao, S. I. Seok, M. K. Nazeeruddin and M. Grätzel, Chem. Mater., 2014, 26, 6160–6164 CrossRef CAS
- M. Liu, M. B. Johnston and H. J. Snaith, Nature, 2013, 501, 395–398 CrossRef CAS PubMed
- R. Lindblad, N. K. Jena, B. Philippe, J. Oscarsson, D. Bi, A. Lindblad, S. Mandal, B. Pal, D. D. Sarma and O. Karis, J. Phys. Chem. C, 2015, 119, 1818–1825 CAS
- B. Conings, L. Baeten, C. De Dobbelaere, J. D'Haen, J. Manca and H. G. Boyen, Adv. Mater., 2014, 26, 2041–2046 CrossRef CAS PubMed
- W. Zhang, S. Pathak, N. Sakai, T. Stergiopoulos, P. K. Nayak, N. K. Noel, A. A. Haghighirad, V. M. Burlakov, A. Sadhanala and W. Li, Nat. Commun., 2015, 6, 10030 CrossRef CAS PubMed
- D. Bi, C. Yi, J. Luo, J.-D. Décoppet, F. Zhang, S. M. Zakeeruddin, X. Li, A. Hagfeldt and M. Grätzel, Nat. Energy, 2016, 1, 16142 CrossRef CAS
- R. Dawood, A. Forty and M. Tubbs, Proc. R. Soc. A, 1965, 284, 272–288 CrossRef CAS
- H. Seyama and M. Soma, J. Chem. Soc., Faraday Trans. 1, 1984, 80, 237–248 RSC
-
N. Fairley, CasaXPS manual 2.3. 15, Acolyte Science, 2009 Search PubMed
- O. Malinkiewicz, A. Yella, Y. H. Lee, G. M. Espallargas, M. Graetzel, M. K. Nazeeruddin and H. J. Bolink, Nat. Photonics, 2014, 8, 128–132 CrossRef CAS
- O. Malinkiewicz, C. Roldán-Carmona, A. Soriano, E. Bandiello, L. Camacho, M. K. Nazeeruddin and H. J. Bolink, Adv. Energy Mater., 2014, 4, 1400345 CrossRef
Footnote |
| † Electronic supplementary information (ESI) available: Experimental details and supporting results. See DOI: 10.1039/c7cc01538k |
| This journal is © The Royal Society of Chemistry 2017 |