A Cu(II) complex targeting the translocator protein: in vitro and in vivo antitumor potential and mechanistic insights†‡
D.
Montagner
ab,
B.
Fresch
cd,
K.
Browne
a,
V.
Gandin
*e and
A.
Erxleben
*a
aSchool of Chemistry, National University of Ireland Galway, Ireland. E-mail: andrea.erxleben@nuigalway.ie
bDepartment of Chemistry, Maynooth University, Ireland
cDepartment of Chemistry, University of Liege, Belgium
dDepartment of Chemical Science, University of Padua, Italy
eDepartment of Pharmaceutical and Pharmacological Science, University of Padua, Italy. E-mail: valentina.gandin@unipd.it
First published on 1st December 2016
Abstract
A new Cu-based anticancer metallodrug which targets the translocator protein is reported. [CuBr2(TZ6)] elicits a remarkable in vitro cytotoxicity in sensitive and multidrug resistant cell lines and induces a 98% reduction of tumor mass in a murine tumor model. Target binding was studied by experimental and computational methods.
The translocator protein (TSPO) is a relatively small transmembrane protein (18 kDa) that is mainly located at the outer mitochondrial membrane.1–3 It is overexpressed in certain cancerous tissues in which its expression correlates with disease progression and malignant behavior.4–7 The TSPO plays an important role in mitochondrial biochemistry,8,9 transport of heme precursors into the mitochondria,10 mitochondrial quality control and the regulation of mitochondrial energy metabolism.11 A regulatory role for TSPO in mitochondria-mediated cell death pathways seems to arise from its complex crosstalk across multiple distinct downstream cell processes involving the mitochondria. In particular, TSPO acts as a molecular interplay linked to reactive oxygen species (ROS) signaling and its inhibition has been demonstrated to lead to cellular redox homeostasis imbalance and ultimately to cell death. The possibility to induce cancer cell death combined with the overexpression of TSPO in cancerous tissues makes TSPO a new and interesting target for metal-based chemotherapeutic agents.12 Different classes of ligands have been shown to bind to TSPO (Fig. S1, ESI‡).13–16 Jaremko et al. recently determined the structure of the TSPO-PK11195 adduct and the binding position of PK11195.17 Denora et al. and Trapani et al. reported detailed structure–activity relationship studies for the imidazopyridine ligand alpidem.18,19 The alpidem analogue TZ6, composed of an imidazopyridine moiety, a thiazole ring and a N,N-dialkylacetamide side chain (Fig. 1), was reported by Natile and coworkers who synthesized its Pt(II) complex.20,21 The complex had a high receptor affinity, but was poorly water soluble and less cytotoxic than cisplatin. Recently, a TSPO ligand functionalized with a chelating moiety was reported that shows high activity against C6 glioma cells.22 It was hypothesized that the active species was the complex formed with physiological Cu.
 | ||
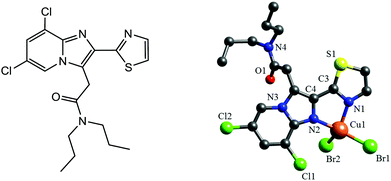
| Fig. 1 Left: Chemical structure of the ligand TZ6. Right: X-ray structure of 1. For the sake of clarity H atoms are omitted and only one set of the disordered isopropyl groups is shown. | ||
Complexes based on Cu receive significant current attention as possible anticancer drugs and numerous complexes with interesting antitumor activity have been synthesized on the assumption that endogenous metal ions are less toxic to normal cells than non-endogenous metals.23 We herein report that a highly effective and selective new anticancer agent is obtained, when the TSPO binding ligand TZ6 is combined with Cu(II) as a redox active metal center and potent ROS producer.
The complex [CuBr2(TZ6)] (1) was obtained by reacting CuBr2 with TZ6 at 40 °C (Fig. S2, ESI‡). Slow evaporation of a CH3CN solution of 1 gave greenish-red, X-ray suitable crystals. The X-ray structure presented in Fig. 1 shows the expected bidentate nitrogen co-ordination of the TZ6 ligand. Two additional bromide ligands give rise to a severely distorted tetrahedral coordination sphere. Because of the small bite angle of the ligand, the N1–Cu1–N2 angle is rather acute (80.9(4)°). By contrast, the Br2–Cu1–N1 (131.0(3)°) and Br1–Cu1–N2 (151.3(3)°) angles are significantly larger than the ideal 109.5° angle. The TZ6 ligand is essentially planar with a dihedral angle of 5.0(15)° between the thiazole ring and the imidazopyridine moiety (Table S2, ESI‡). The stability of the complex in 0.9% NaCl/0.1% CH3CN was studied by ESI-MS (Fig. S3, ESI‡). Br− coordination was still seen after 2 d.
The in vitro antitumor potential of TZ6 and 1 was evaluated in cell lines representative of lung (A549), colon (HCT-15), pancreatic (BxPC3), cervical (A431), breast (MCF-7), ovarian (A2780) and kidney (A498) cancers, along with melanoma (A375) and compared to that of the clinically used metallodrugs cisplatin (CDDP) and oxaliplatin (OXP). IC50 values after 72 h, calculated from dose-survival curves, are reported in Table 1. Uncoordinated TZ6 proved to be barely effective against all tested cultured human cancer cell lines. By contrast, the Cu complex showed a significant antiproliferative activity, with IC50 values in the low and sub-micromolar range. 1 was particularly effective against human breast MCF-7 cancer cells, with mean IC50 values exceeding about 36 and 16 times those recorded with CDDP and OXP, respectively. Similarly, 1 elicited an in vitro antitumor activity that was about 19- and 13-fold better than that of CDDP and OXP against human pancreatic BxPC3 cells. The antiproliferative activity of 1 was also investigated in two human cell line pairs which had been selected for sensitivity/resistance to CDDP (ovarian cancer cells 2008/C13*) and OXP (colon cancer cells LoVo/LoVo-OXP) or belong to the multidrug-resistant (MDR) phenotype (colon cancer cells LoVo/LoVo MDR). The IC50 and RF values (RF = resistance factor, defined as the ratio between IC50 of resistant cells and IC50 of sensitive ones) are reported in Table S3 (ESI‡). 1 exhibited a similar pattern of cytotoxicity both in platinum-sensitive and -resistant cells, and the RF values calculated for 2008/C13* and LoVo/LoVo-OXP cells were 14- to 24-fold lower than that of the reference platinum drug, thus indicating the absence of cross-resistance. Analogously, in colon cancer LoVo/LoVo MDR cells, complex 1 yielded RF values on average 30-fold lower than that obtained with doxorubicin, a drug belonging to the MDR spectrum. The cytotoxicity of 1 was also evaluated against non-tumor cells, namely human lung MRC-5 and colon CCD18-Co fibroblasts as well as human embryonic kidney HEK293 cells (Table S4, ESI‡). The preferential cytotoxicity of the newly synthesized Cu(II) complex towards neoplastic cells is confirmed by the selectivity index value (SI = average IC50 toward normal cells divided by the average IC50 for the malignant cells). The SI of 1 is significantly higher than those calculated for CDDP and OXP (SI of 17.5, 1.8, and 12.6 for 1, CDDP and OXP, respectively).
| IC50 (μM) ± SDa | ||||||||
|---|---|---|---|---|---|---|---|---|
| A549 | HCT-15 | BxPC3 | A375 | A431 | MCF-7 | A2780 | A498 | |
| a Cells (3–8 × 10⁴ mL−1) were treated for 72 h with increasing concentrations of the tested compounds. The cytotoxicity was assessed by the MTT test. IC50 values were calculated by a four parameter logistic model 4-PL (P < 0.05). | ||||||||
| 1 | 1.12 ± 0.57 | 3.16 ± 1.24 | 0.33 ± 0.07 | 2.22 ± 0.84 | 0.89 ± 0.54 | 0.21 ± 0.01 | 0.65 ± 0.08 | 1.16 ± 0.16 |
| TZ6 | >30 | >30 | >30 | >30 | >30 | >30 | >30 | >30 |
| CDDP | 10.56 ± 1.34 | 11.32 ± 1.51 | 6.17 ± 1.37 | 3.11 ± 0.98 | 1.65 ± 0.51 | 7.60 ± 0.21 | 2.23 ± 0.39 | 15.68 ± 2.48 |
| OXP | 1.67 ± 0.96 | 1.04 ± 0.67 | 4.15 ± 1.07 | 6.30 ± 2.01 | 3.06 ± 0.88 | 3.36 ± 1.69 | 2.45 ± 0.68 | 7.91 ± 2.42 |
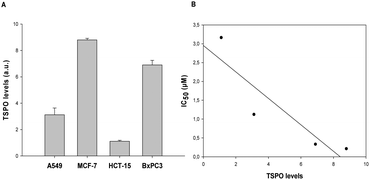
To investigate whether TSPO expression in human cancer cells influences cell sensitivity to 1, we evaluated the expression levels of TSPO in four different human cancer cells, namely lung (A549), breast (MCF-7), colon (HCT-15), and pancreatic (BxPC3) carcinoma cell lines (Fig. 2A). A direct relationship (R2 = 0.82) between TSPO levels and the cytotoxic activities of 1 was found (Fig. 2B). Moreover, the affinity of 1 and uncoordinated TZ6 for the TSPO receptor was evaluated by measuring the ability of 1 and TZ6 to displace the reference compound [3H]-PK11195 (Fig. S4, ESI‡). The Cu(II) complex showed an affinity comparable to that of free TZ6 (6.9 and 3.6 nM for 1 and free TZ6, respectively). These findings clearly confirm that TSPO plays a key role in the antiproliferative activity of 1.
 | ||
| Fig. 2 (A) TSPO expression in A549, MCF-7, HCT-15 and BxPC3 cells. (B) Correlation between cytotoxicity and TSPO expression. | ||
Taking into consideration previously reported experimental evidence that TSPO affects energy homeostasis and that it is implicated in the control of mitochondrial ROS production,11 we investigated the effects of 1 on the mitochondria, in particular on ROS levels, the alteration of the mitochondrial membrane potential, and the functioning of the respiratory chain. Treatment of MCF-7 cells with complex 1 induced a dose- and time-dependent increase in the cellular basal ROS production (Fig. S5A, ESI‡). However, the ROS production induced by 1 was lower than that provoked by antimycin A, a classical inhibitor of the mitochondrial respiratory chain at the level of complex III. An increase of cellular basal ROS production could be induced by a direct hampering effect on the respiratory chain. As depicted in Fig. S5B (ESI‡), 1 hampers the respiratory chain in a time- and dose-dependent manner, thus leading to a reduction of O2 consumption in treated cells. It is well known that hampering of the respiratory chain and the resulting increase of ROS production lead to the hypopolarization of the mitochondrial membrane. Consistently, a significant time and dose-dependent increase of cells with depolarized mitochondria was observed after treatment with 1 (Fig. S5C, ESI‡). Morphological analysis by TEM of MCF-7 cells treated with the Cu complex confirmed that 1 significantly alters the mitochondria (Fig. S6, ESI‡). Incubation for 12 and 24 h with IC50 doses of 1 induced a dramatic swelling of the mitochondria associated with decreased electron density of the inner membrane and matrix regions. The mitochondria of 1-treated MCF-7 cells showed disrupted cristae and were significantly increased in volume with respect to the mitochondria of control cells.
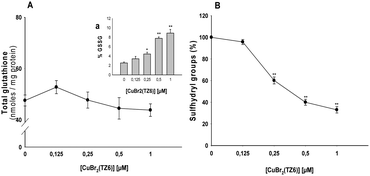
The increase in hydrogen peroxide production and the alteration of relevant mitochondrial pathophysiological parameters upon interaction of 1 with TSPO in human cancer cells can lead to an imbalance in the cellular redox homeostasis. Therefore, we assessed the effects induced on the sulfhydryl redox state. Fig. 3A shows the total amounts of glutathione (GSH) and oxidized glutathione (GSSG) in MCF-7 cells incubated for 48 h with increasing concentrations of complex 1. While no significant changes in total cellular glutathione levels were observed, a dose-dependent increase of GSSG levels occurred. Accordingly, the Cu complex caused a dose-dependent decrease in total sulfhydryl content (Fig. 3B).
Complex 1 was evaluated for its in vivo activity in the murine LLC solid tumor. The tumor growth inhibition induced by 1 was compared to that promoted by CDDP. Seven days after tumor inoculation, tumor-bearing mice were randomized into vehicle control and treatment groups (five mice per group). Control mice received the vehicle (0.5% DMSO (v/v) and 99.5% of a saline solution (v/v)), whereas treated groups received daily doses of 1 (20 and 10 mg kg−1 in a vehicle solution composed of 0.5% DMSO (v/v) and 99.5% of saline solution (v/v)) or cisplatin (3 mg kg−1 in saline solution). The tumor growth was estimated at day 15 and the results are reported in Table 2. As an estimation of the adverse side effects, changes in the body weights of tumor-bearing mice were monitored every two days (Fig. S7, ESI‡). Noteworthy, administration of 1 induced a ca. 98% reduction of the tumor mass compared to the control group. Remarkably, the time course of body weight changes indicated that treatment with 1 did not induce significant body weight loss (<20%). On the contrary, the time course of body weight changes indicated that CDDP induces anorexia, with a body weight loss >20% (Fig. S7, ESI‡).
| Compound | Dose (mg kg−1) | Average tumor weight (mean ± SD, g) | Inhibition of tumor growth (%) |
|---|---|---|---|
| a Starting from day 7 after tumor implantation, the tested compounds were daily administered intraperitoneally. At day 15, mice were sacrificed and tumor growth was determined as described in the ESI. **p < 0.01. | |||
| Control | — | 0.457 ± 0.08 | — |
| 1 | 20 | 0.010 ± 0.008** | 97.68 |
| 1 | 10 | 0.111 ± 0.05** | 75.74 |
| CDDP | 3 | 0.038 ± 0.03** | 91.75 |
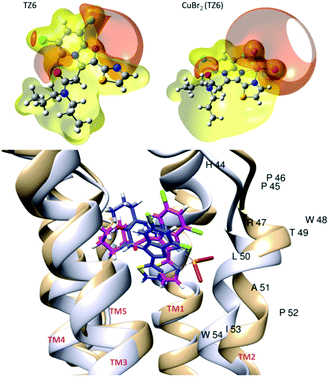
Computational studies at different levels of theory (see ESI‡) were carried out to shed light on the molecular details of the interaction of 1 with the target TSPO protein. Fig. 4 shows the isosurfaces of constant electrostatic potential (ESP) for the TZ6 ligand and for 1. ESP provides information about the distribution of electron density around the nuclei of the molecule. Negative isosurfaces (red) indicate an electron-rich region. The N1–C–C–N2 site of the TZ6 ligand is characterized by high electron density. As shown in Fig. 4, because of the presence of the bromides, a negative ESP region is also present in 1 so that the main feature of the ESP spatial distribution of TZ6 is conserved upon binding of the CuBr2 moiety. A similar spatial distribution of the molecular electrostatic potential is important in view of the binding of 1 to the TSPO target as long as the electrostatic component plays a central role in determining a favorable host–guest interaction.24 The binding of the ligands PK11195, TZ6 and of 1 to the target TSPO was first investigated by a rigid docking procedure25,26 and subsequently refined with an all-atom molecular mechanics simulation (AMBER Score) where the whole protein is flexible and the binding site can adjust its structure to the specific ligand.27–29 The values of the scoring functions are reported in Table S5 (ESI‡), negative values indicate favorable binding. The AMBER Score of TZ6 is practically equivalent to the score obtained by rigid docking (Table S3, ESI‡). On the contrary, in the case of 1, we observe a significant rearrangement of the binding site, see Fig. 4. As a result of this induced fit process,27 the estimated binding energy of complex 1 (−34.2 kcal mol−1) is only slightly smaller than the estimated binding energy of the free TZ6 ligand (−51.8 kcal mol) in qualitative agreement with the relative affinity of the two molecules measured experimentally. Thus, the coplanar conformation of the imidazopyridine and thiazole rings imposed by the metal coordination does not hamper the TZ6–TSPO interaction. The orientation of 1 that results most stabilized by the structural adjustment of the binding site (structure c of Fig. S9, ESI‡) is characterized by the CuBr2 moiety pointing toward the helix containing the THR49-LEU50-ALA51 residues (TM2 following the convention of ref. 17, see Fig. 4). In the best pose (Fig. 4), the TZ6 moiety of 1 (magenta) has the same orientation as the TZ6 ligand (blue) within the binding site. The channel created by the five α-helices of the TSPO target is larger in the CuBr2(TZ6)–TSPO complex (light brown structure in Fig. 4) than in the TZ6–TSPO complex (light grey structure). In particular, the TM2 α-helix of the receptor is displaced to fit the increased molecular volume of 1. In the structure of TSPO the loops between the transmembrane helices are short, with the exception of residues Gly28 to Pro45, which connect TM1 and TM2. The seven residues Glu29 to Ala35 fold into a short α helix that is inclined with respect to the long axis of TM1 and closes the binding pocket from the cytosolic side. The induced fit observed upon the binding of 1 suggests that this particular structural motif that was already found important for the binding of PK1119517 plays indeed a key role in the modulation of the TSPO binding site.
In conclusion [CuBr2(TZ6)] clearly targets TSPO and features significant in vitro and in vivo activity and selectivity for cancer cells over healthy cells which warrants its consideration for further development as a potential new type of anticancer metallodrug.
References
- C. J. D. Austin, J. Kahlert, M. Kassiou and L. M. Rendina, Int. J. Biochem. Cell Biol., 2013, 45, 1212 CrossRef CAS PubMed.
- C. Braestrup, R. Albrechtsen and R. F. Squires, Nature, 1977, 269, 702 CrossRef CAS PubMed.
- V. Papadopoulos, M. Baraldi, T. R. Guilarte, T. B. Knudsen, J.-J. Lacapère, P. Lindemann, M. D. Norenberg, D. Nutt, A. Weizman, M.-R. Zhang and M. Gavish, Trends Pharmacol. Sci., 2006, 27, 402 CrossRef CAS PubMed.
- P. Casellas, S. Galiegue and A. S. Basile, Neurochem. Int., 2002, 40, 475 CrossRef CAS PubMed.
- L. Veenman and M. Gavish, Drug Dev. Res., 2000, 50, 355 CrossRef CAS.
- K. L. Black, K. Ikezaki, E. Santori, D. P. Becker and H. V. Vinters, Cancer, 1990, 65, 93 CrossRef CAS PubMed.
- R. Nagler, O. Ben-Izhak, D. Savulescu, E. Krayzler, S. Akrish, S. Leschiner, I. Otradnov, S. Zeno, L. Veenman and M. Gavish, Biochim. Biophys. Acta, 2010, 1802, 454 CrossRef CAS PubMed.
- J. M. Bernassau, J. L. Reversat, P. Ferrara, D. Caput and G. Lefur, J. Mol. Graphics, 1993, 11, 236 CrossRef CAS PubMed.
- V. Papadopoulos, H. Amri, H. Li, N. Boujrad, B. Vidic and M. Garnier, J. Biol. Chem., 1997, 272, 32129 CrossRef CAS PubMed.
- A. Verma, J. S. Nye and S. H. Snyder, Proc. Natl. Acad. Sci. U. S. A., 1987, 84, 2256 CrossRef CAS.
- J. Gatliff, D. East, J. Crosby, R. Abeti, R. Harvey, W. Craigen, P. Parker and M. Campanella, Autophagy, 2014, 10, 2279 CrossRef CAS PubMed.
- S. Galiegue, N. Tinel and P. Casellas, Curr. Med. Chem., 2003, 10, 1563 CrossRef CAS PubMed.
- E. Romeo, J. Auta, A. P. Kozikowski, D. Ma, V. Papadopoulos, G. Puia, E. Costa and A. Guidotti, J. Pharmacol. Exp. Ther., 1992, 262, 971 CAS.
- G. Le Fur, M. L. Perrier, N. Vaucher, F. Imbault, A. Flamier, J. Benavides, A. Uzan, C. Renault, M. C. Dubroeucq and C. Gueremy, Life Sci., 1983, 32, 1839 CrossRef CAS PubMed.
- P. J. Marangos, J. Patel, J. P. Boulenger and R. Clark-Rosenberg, Mol. Pharmacol., 1982, 22, 26 CAS.
- S. Z. Langer, S. Arbilla, S. Tan, K. G. Lloyd, P. George, J. Allen and A. E. Wick, Pharmacopsychiatry, 1990, 23, 103 CrossRef PubMed.
- L. Jaremko, M. Jaremko, K. Giller, S. Becker and M. Zweckstetter, Science, 2014, 343, 1363 CrossRef CAS PubMed.
- N. Denora, V. Laquintana, M. G. Pisu, R. Dore, L. Murru, A. Latrofa, G. Trapani and E. Sanna, J. Med. Chem., 2008, 51, 6876 CrossRef CAS PubMed.
- G. Trapani, M. Franco, A. Latrofa, L. Ricciardi, A. Carotti, M. Serra, E. Sanna, G. Biggio and G. Liso, J. Med. Chem., 1999, 42, 3934 CrossRef CAS PubMed.
- N. Margiotta, N. Denora, R. Ostuni, V. Laquitana, A. Anderson, S. W. Johnson, G. Trapani and G. Natile, J. Med. Chem., 2010, 53, 5144 CrossRef CAS PubMed.
- N. Margiotta, R. Ostuni, R. Ranaldo, N. Denora, V. Laquintana, G. Trapani, G. Liso and G. Natile, J. Med. Chem., 2007, 50, 1019 CrossRef CAS PubMed.
- N. Denora, N. Margiotta, V. Laquintana, A. Lopedota, A. Cutrignelli, M. Losacco, M. Franco and G. Natile, ACS Med. Chem. Lett., 2014, 5, 685 CrossRef CAS PubMed.
- C. Santini, M. Pellei, V. Gandin, M. Porchia, F. Tisato and C. Marzano, Chem. Rev., 2014, 114, 815 CrossRef CAS PubMed.
- P. K. Weiner, R. Langridge, J. M. Blaney, R. Schaefer and P. A. Kollman, Proc. Natl. Acad. Sci. U. S. A., 1982, 79, 3754 CrossRef CAS.
- S. Mukherjee, T. E. Balius and R. C. Rizzo, J. Chem. Inf. Model., 2010, 50, 1986 CrossRef CAS PubMed.
- P. T. Lang, S. R. Brozell, S. Mukherjee, E. F. Pettersen, E. C. Meng, V. Thomas, R. C. Rizzo, D. A. Case, T. L. James and I. D. Kuntz, RNA, 2009, 15, 1219 CrossRef CAS PubMed.
- P. Csermely, R. Palotai and R. Nussinov, Trends Biochem. Sci., 2010, 35, 539 CrossRef CAS PubMed.
- B. Fresch and F. Remacle, Phys. Chem. Chem. Phys., 2014, 16, 14070 RSC.
- F. Di Sarra, B. Fresch, R. Bini, G. Saielli and A. Bagno, Eur. J. Inorg. Chem., 2013, 2718 CrossRef CAS.
Footnotes |
| † The work of BF is supported by the Italian Ministero dell'Istruzione, Università e Ricerca – grant “Rita Levi Montalcini – 2013”. The research of VG was supported by the University of Padova (Grants 60A04-0443, 60A04-3189 and 60A04-4015/15). |
| ‡ Electronic supplementary information (ESI) available: Experimental and computational details, crystallographic data, additional cytotoxicity data, values of the scoring functions, RESP partial atomic charges, cellular ROS levels, mitochondrial membrane potential and O2 consumption data, TEM images, body weight changes of treated mice, ligand poses and TSPO-complex structures. CCDC 1473112. For ESI and crystallographic data in CIF or other electronic format see DOI: 10.1039/c6cc08100b |
| This journal is © The Royal Society of Chemistry 2017 |


