A novel miniaturized biofilter based on silicon micropillars for nucleic acid extraction
Salvatore
Petralia
 a,
Emanuele Luigi
Sciuto
 b and
Sabrina
Conoci
 *a
*a
aSTMicroelectronics Stradale Primosole, 50 - 95121 Catania, Italy. E-mail: sabrina.conoci@st.com
bDipartimento di Fisica e Astronomia, Via S. Sofia, 64, 95123 Catania, Italy
First published on 21st November 2016
Abstract
New miniaturised microfluidic biofilter (BF) devices based on silicon micropillars have been developed and tested regarding their ability to extract HBV (Hepatitis B Virus) bacterial DNA from biological sample solutions. The device is composed of a silicon microchannel in which the pillars are distributed at the bottom surface. The extracted DNA solutions were analysed by real time PCR amplification and the biofilter performance was evaluated. The results obtained show that the DNA binding to the biofilters and the elution efficiency strictly depend on the pillars’ geometrical dimensions and increase proportionally with the surface/volume ratio. The device exhibiting the best extraction efficiency was then tested in combination with a silicon integrated real time PCR amplification chip as a preliminary step towards the development of genetic point-of-care devices.
1. Introduction
The development of miniaturized devices able to perform DNA analysis is still one of the fascinating fields in biomedical research. This marries the vision of future home-made molecular diagnosis by simply using a microchip integrated into smart mobile devices, such as smartphones or smart watches.1–3These miniaturized systems are called “Lab-on-Chip” (LoC) devices, and are sophisticated since they require the integration of several specific technological modules capable of efficiently managing the two main steps needed for molecular analysis: (a) DNA extraction and purification (sample preparation) and (b) DNA detection. The DNA extraction step plays a fundamental role in the outcome of the molecular analysis since the purity and the concentration of the extracted DNA strongly affect the subsequent detection analysis. While for DNA detection there are many examples of LoC able to perform polymerase chain reaction (PCR) or real time PCR, hybridization, capillary electrophoresis etc.,4–13 the sample preparation is still challenging since several starting material samples can be employed (blood, urine, saliva etc.) and, consequently, complex architectures and protocols are needed. Therefore, the literature reports few examples of miniaturized sample preparation devices when compared with those for DNA detection. Many of these are developed using plastic materials and include a complex microfluidic network that manages fluid movement, mixing, splitting etc.14–21 Plastic materials for integrated microfluidics have the advantage of low cost but the miniaturization, integration and the thermal properties required by some of the extraction steps (i.e. lysis) still remain the main limitations. In contrast, silicon is a very appealing material. In fact, it combines good physical aspects for sensing, such as low heat capacity, good thermal conductivity, and possible patterned structures to increase the surface–area ratio, with consolidated production technologies and industrialization processes at high volume. Additionally, it allows the integration of electrodes and microelectronics circuitry that imprint the so-called “intelligence on board”. Recently, we proposed an integrated silicon-based lab-on-chip for sample preparation, PCR amplification and hybridization to detect the betaglobin gene from blood.22 This solution adopts a sample preparation process in one step. It is performed in a silicon chamber using a lysis solution containing a mix of proteases that lyse the human cells and digest most of the proteins present in the blood. In this case, even if the DNA is not purified, this approach works in PCR detection since the concentration of human genomic DNA is quite high in human cells. In contrast, when the DNA to be extracted is viral or bacterial, the above-reported methodology fails since these genomes are present in very low concentration in the starting sample compared to the co-present human DNA. In this case, therefore, the purity of the extracted material must be high and, operatively speaking, after the lysis, two additional steps of purification and concentration are mandatory. Viral and bacterial DNA extractions are usually achieved by Solid Phase Extraction (SPE) based on capturing the DNA present in the lysed solution on solid surfaces (purification step) and then eluted with appropriate buffers (concentration step).23 SiO2 is the most used solid surface since it is well-known to bind DNA in the presence of chaotropic salts and ethanol.24 Most of the current commercial extraction kits use silica in the form of micro-filter mounted in a plastic column (i.e. Qiagen kits https://www.qiagen.com/gb/shop/sample-technologies/dna/qiaprep-spin-miniprep-columns) or layers covering magnetic beads (i.e. Magazorb kit https://ch.promega.com/-/media/files/resources/protocols/technical-bulletins/101/magazorb-dna-mini-prep-kit-protocol.pdf) that are moved by external magnets. Sometimes silica is derivatized with positive amino-groups to bind the negatively charged DNA more effectively than naked silica. However, the technical features (i.e. porosity, surface-to-volume ratio, etc.) of these systems are not explicitly disclosed since they are covered by trademarks. A drawback of the current extraction protocol is that the above-reported chemical agents (ethanol and chaotropic salts) can inhibit the PCR reaction or other molecular techniques.25 Therefore several washing steps are needed to eliminate traces of these compounds. In terms of miniaturization of the device, this implies complex architectures to manage the fluidic steps, with consequent increase of the design complexity and costs.
From the prospect of achieving a chip for DNA extraction based on SPE on the silica surface, one of the most interesting approaches shown in the literature is that involving the micro-fabricated silicon pillars. It merges the advantages to increase the surface within the capture area with the possibility to be monolithically integrated into a miniaturized device. The studies reported so far on analytical samples (pre-purified DNA)17–19,26 on cells18 prove this approach to have great potential towards the development of a genetic point-of-care device.
In this contribution, we present new miniaturised microfluidic biofilter (BF) devices based on silicon micropillars. They are analytically characterised regarding their efficiency to catch and release DNA. We have used HBV (Hepatitis B Virus) clone solutions at a concentration typical of real samples for infectious diseases (105 copies) as analytical samples. The device has been developed in three different geometrical structures, so that the effect of the Surface-to-Volume Ratio (SVR) on the extraction efficiency can be investigated. The total extraction performance was also evaluated and compared with those of commercial kits. Finally, the device exhibiting the best extraction efficiency was tested in combination with a silicon integrated real time PCR amplification chip as a preliminary step towards the development of genetic point-of-care devices.
2. Experimental
2.1 Silicon filter fabrication and characterization
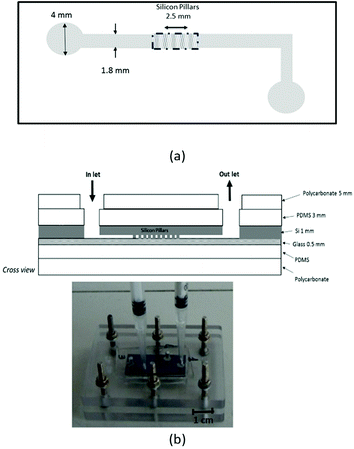
The BF devices (30 mm × 13 mm in size) consist of a microfabricated corner-shaped silicon channel (linear length 20 mm, large 1.8 mm) in which silica coated pillar arrays were etched in an area (5 mm long, 1.8 mm large) located in the middle of the channel (Fig. 1a). Three series of pillars arrays with a size of 5 × 1.8 mm2 (BF-1, BF-2 and BF-3) were fabricated varying the pillar diameter (from 12 to 15 μm) and the pillar-to-pillar distance (from 8 to 15 μm). The height of the pillar in all three arrays was 100 μm. The inlet and outlet ports of the channel are circular holes, 4 mm in diameter. Table 1 summarizes the geometrical details of all BF types.| Filter type | Pillar diameter (mm) | Pillar pitch (mm) | Pillar height (mm) | Total number of pillars | Total SVR (mm−1) |
|---|---|---|---|---|---|
| BF-1 | 0.012 | 0.008 | 0.1 | 23![[thin space (1/6-em)]](https://www.rsc.org/images/entities/char_2009.gif) 040 040 |
39.9 |
| BF-2 | 0.015 | 0.01 | 0.1 | 12![[thin space (1/6-em)]](https://www.rsc.org/images/entities/char_2009.gif) 190 190 |
30.5 |
| BF-3 | 0.015 | 0.015 | 0.1 | 7380 | 22.5 |
The microfabrication of these devices was carried out by a standard VLSI (Very Large Scale Integration) technology based on multi-step processes. The first step was the cleaning of the wafer with a solution of H2O2![[thin space (1/6-em)]](https://www.rsc.org/images/entities/char_2009.gif) :
:![[thin space (1/6-em)]](https://www.rsc.org/images/entities/char_2009.gif) H2SO4 (1
H2SO4 (1![[thin space (1/6-em)]](https://www.rsc.org/images/entities/char_2009.gif) :
:![[thin space (1/6-em)]](https://www.rsc.org/images/entities/char_2009.gif) 1) followed by washing with deionized water and drying at 90 °C. After that, the silicon wafer was coated with a positive photoresist layer (KrF (248 nm) purchased from FujiFilm) of 4.7 μm by a spin coating process (1000 rpm, for 1 min). UV light irradiation was performed through a photomask, and the development process with TMAH (tetramethylammonium hydroxide)-based solution (OPD4262 purchased from FujiFilm) was carried out. After that, the microstructures were fabricated by silicon etching using a standard Bosch process (United States Patent 5501893) forming silicon channels (18 mm long × 1.8 mm large), the active pillar areas (2.5 mm long × 1.8 mm large) and the inlet and outlet holes (4 mm diameter), respectively. A next stripping step by oxygen plasma was carried out to remove the residual photoresist. A subsequent final dry oxidation process at 1000 °C with O2, and H2O gas (rate 1 cm s−1) was carried out, leading to a surface silicon oxide layer of 320 nm in thickness. This was measured by Scanning Electron Microscopy (SEM) analysis obtained using a high-performance Schottky field emission, LEO 1550 SEM. The instrument was operated at 5 kV in a secondary electron imaging mode.
1) followed by washing with deionized water and drying at 90 °C. After that, the silicon wafer was coated with a positive photoresist layer (KrF (248 nm) purchased from FujiFilm) of 4.7 μm by a spin coating process (1000 rpm, for 1 min). UV light irradiation was performed through a photomask, and the development process with TMAH (tetramethylammonium hydroxide)-based solution (OPD4262 purchased from FujiFilm) was carried out. After that, the microstructures were fabricated by silicon etching using a standard Bosch process (United States Patent 5501893) forming silicon channels (18 mm long × 1.8 mm large), the active pillar areas (2.5 mm long × 1.8 mm large) and the inlet and outlet holes (4 mm diameter), respectively. A next stripping step by oxygen plasma was carried out to remove the residual photoresist. A subsequent final dry oxidation process at 1000 °C with O2, and H2O gas (rate 1 cm s−1) was carried out, leading to a surface silicon oxide layer of 320 nm in thickness. This was measured by Scanning Electron Microscopy (SEM) analysis obtained using a high-performance Schottky field emission, LEO 1550 SEM. The instrument was operated at 5 kV in a secondary electron imaging mode.
The silicon part was then sealed with a glass slide (0.5 mm thickness) by a standard anodic bonding process producing the final microchip (Fig. 2a). The internal volume of the device was 5 μL.
The microstructures of the microfabricated devices were imaged by both optical microscopy (OLYMPUS SZX16) and SEM.
2.2 Fluidic interface
To test the BF devices an appropriate fluidic connection was fabricated (Fig. 1b). A PDMS layer (3 mm thickness) was employed to cover the device from both sides. A final polycarbonate rigid holder (5 mm thickness) was mounted on to guarantee the structural rigidity and the ease of handling the device. Both PDMS layers and the polycarbonate holder contained holes that are aligned with the inlet and outlet ports of the silicon device. The fluid was actuated into/out of the devices by applying/removing pressure through syringes mounted on top of the inlet and outlet ports (see Fig. 1b).2.3 BF chemical treatment
Before using, the BF devices were chemically treated by flowing through their channel a solution of NH4OH![[thin space (1/6-em)]](https://www.rsc.org/images/entities/char_2009.gif) :
:![[thin space (1/6-em)]](https://www.rsc.org/images/entities/char_2009.gif) H2O2
H2O2![[thin space (1/6-em)]](https://www.rsc.org/images/entities/char_2009.gif) :
:![[thin space (1/6-em)]](https://www.rsc.org/images/entities/char_2009.gif) H20 (5
H20 (5![[thin space (1/6-em)]](https://www.rsc.org/images/entities/char_2009.gif) :
:![[thin space (1/6-em)]](https://www.rsc.org/images/entities/char_2009.gif) 1
1![[thin space (1/6-em)]](https://www.rsc.org/images/entities/char_2009.gif) :
:![[thin space (1/6-em)]](https://www.rsc.org/images/entities/char_2009.gif) 1) preheated at 60 °C for 5 min. Then channel rinsing was carried out 3 times with deionized water. Finally, the devices were dried under nitrogen flowed through the inlet port.
1) preheated at 60 °C for 5 min. Then channel rinsing was carried out 3 times with deionized water. Finally, the devices were dried under nitrogen flowed through the inlet port.
2.4 Chemicals and reagents
Stock solutions of a HBV clone complete genome (ref product 05960116), consisting of the HBV genome 3.2 kbps and a plasmid PBR322 vector 3.8 kbps in TE (Tris 10 mM, EDTA 1 mM, pH = 8) and the HBV real time PCR kit (ref product FO2 HBV MMIX KIT 48) were purchased from Clonit and used according to the Instructions for Use. Tris-HCl, EDTA, TE buffer and sterile deionized water were purchased from Sigma and used as received.2.5 Extraction experiments and characterization of BF performance
DNA binding/elution experiments were performed by using a starting solution containing 105 cps μL−1 of HBV complete genome dissolved TE buffer. A 5 μl volume of this solution (starting solution) was loaded into the BF channel through the inlet port and incubated for 10 min at room temperature. The solution was then recovered by aspiration from the outlet port (not-bound solution). A washing step with 10 μL of TE buffer was then carried out. The final elution step was executed by flowing 5 μL of elution buffer (see below). Two types of elution buffers were tested: (EB-1) water (EB1-elution solution); (EB-2) Tris-HCl 10 mM, EDTA 1 mM at pH = 8.0 (EB-2-elution solution).All experiments were performed at room temperature.
The recovered samples (not-bound solution, EB1-elution solution and EB2-elution solution) together with the starting solution were quantified in terms of HBV clone concentration by using real time PCR. The experiments were performed on an AB7500 Thermo-Cycler. 5 μL of the above-mentioned solutions were added to 20 μL of a HBV kit master mix. The PCR thermal cycling was as follows: 10 min at 95 °C, followed by 45 cycles of 95 °C for 15 s and 60 °C for 60 s. The quantitative measurements of HBV clone concentration were performed by a calibration curve calculated with the standard HBV concentrations of 1 × 10⁵, 1 × 10⁴, 1 × 10³ and 1 × 10² cps.
For comparison, the same starting analytical sample (solution of the HBV clone containing a total amount of 5 × 10⁵ cps) was extracted using two commercial kits: (a) a Magazorb DNA Mini-Prep Kit (Promega) and (b) a Qiagen QIAamp DNA Mini Kit (Ref. 51306), according their Instructions for Use.
2.6 Extraction and real time amplification on the chip
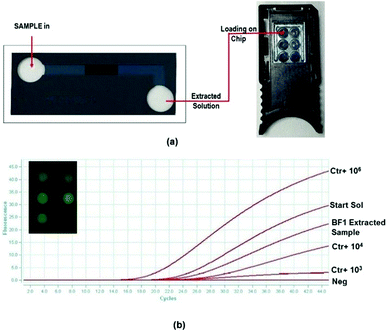
A complete extraction experiment was performed on a BF1-type biofilter device starting from a solution containing 105 cps μL−1 of the HBV clone in TE buffer (starting solution), following the procedure described in section 2.5. The eluted solution (5 μL) was analyzed via real time PCR on the chip using a disposable miniaturized silicon device integrating temperature sensors and heaters (RT-PCR chip) containing six PCR reaction chambers (15 μL each in volume) (Fig. 5). The chip is thermally and optically driven by using a Q3 instrument and the collected fluorescence signals versus PCR cycles are analyzed by Q3 software. The platform has been custom-developed by STMicroelectronics and the details related to the manufacturing process and features are described in ref. 19–21.5 μL of both starting and eluted solutions were pipetted into two out of the 6 chambers of the RT-PCR chip, and pre-loaded with 10 μL of the HBV kit master mix. The others 4 chambers were loaded with 1 negative sample (1 μL of water + 14 μL of HBV master mix) and three positive controls (1 μL of 1 × 10⁶, 1 × 10⁴ and 1 × 10³ cps μL−1 + 14 μL of HBV master mix) for the calibration curve. The real time PCR process was executed using the thermal protocol reported in section 2.5.
3. Results and discussion
3.1 Geometrical features of the microstructures
One of the key parameters for effectively capturing the DNA in SPE using the pillar approach is the surface-to-volume ratio (SVR): the higher the value, the larger the surface available for capture under the same chemical conditions (ionic force, pH, etc.) of the employed solutions.17–19,26 In order to gain more insight into the aspects related to our BF device, we developed three pillar microstructures generating three types of extraction chips (BF-1, BF-2 and BF-3) featured by different SVR characteristics.
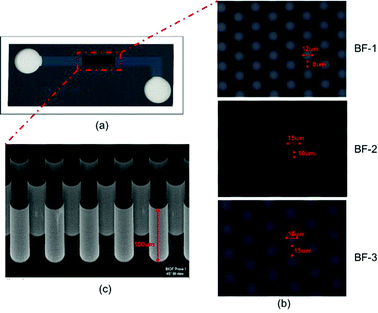
Fig. 2 illustrates a typical image of the fabricated BF microdevice (Fig. 2a) and the structural features of the pillar areas in the three device typologies (Fig. 2b and c). In particular, Fig. 2b clearly highlights the three kinds of packing pillar arrangements differing from each other in pillar diameter (12 μm in the case of BF-1 and 15 μm for both BF-2 and BF-3) and inter-pillar distance (8 μm in the case of BF-1, 10 μm for both BF-2 and 15 μm for BF-3). It can be also noticed that the pillars are arrayed in a close-packed arrangement in order to maximise the packing feature and to increase the surface area as much as possible. In light of this, each microstructure contained a different number of pillars from about 23![[thin space (1/6-em)]](https://www.rsc.org/images/entities/char_2009.gif) 000 in the case of BF-1, to 12
000 in the case of BF-1, to 12![[thin space (1/6-em)]](https://www.rsc.org/images/entities/char_2009.gif) 000 for BF-2 and to 7300 for BF-3. The pillars are cylindrically shaped as shown in the SEM image reported in Fig. 2c.
000 for BF-2 and to 7300 for BF-3. The pillars are cylindrically shaped as shown in the SEM image reported in Fig. 2c.
The above discussed geometrical features yield different surface-to-volume ratios (SVR). As summarised in Table 1, the device exhibiting the highest SVR value is BF-1 (39.90 mm−1) while BF-2 and BF-3 exhibit lower values equal to 30.105 mm−1 (BF-2) and 22.50 mm−1.(BF-3), respectively. It can be noticed that the major contribution to the total S/V comes from the active pillar area. Such an area contributes to the total surface of the BF chip, about 78% in the case of BF-1, 71% in the case of BF-2 and 61% in the case of BF-3. On the basis of this finding, we can reasonably attribute the major impact in the DNA capture to that area.
3.2 Effect of SVR and ionic force on extraction performance
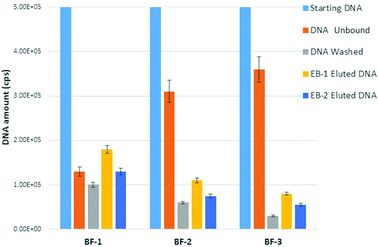
The extraction performance of the BF devices was measured using synthetic DNA clone of the HBV genome at a concentration close to that found in real samples (105 cps). This clone was selected as an analytical model to assess the extraction performance before testing real samples (such us blood, urine, and saliva etc.) that include the so-called “bias” interference.27We firstly evaluated both the binding and elution capability of the above-described microstructures (see section 2.5). After sample loading, the unbound, washed and eluted DNA was measured by real time PCR on the tube. Fig. 3 illustrates the comparison of the obtained data in terms of DNA amount (total cps) for the three typologies of BF devices.
It can be clearly noticed that the DNA binding capacity increases with the SVR of the device. The BF device exhibiting the highest SVR (BF-1) also shows the highest values of captured DNA. This latter is defined as the difference between the total starting DNA (blue bar) and the sum of total unbound (orange bar) and total washed DNA (grey bar). In agreement with this, the calculated binding efficiency (see eqn (1)†) corresponds to 54% for BF1 (SVR 39.9 mm−1) versus 26% for BF-2 (SVR 30.5 mm−1) and 22% for BF-3 (SVR 22.50 mm−1). This is expected on the basis of the increasing number of potential binding surface sites upon SVR increasing. Even if the trials were performed on the uncoated SiO2 surface, a remarkable amount of DNA was captured: about 1.8 × 10⁵ cps for BF1, 1.1 × 10⁵ cps for BF2 and 8.0 × 10⁴ cps for BF3 in the case of EB1 (yellow bars of Fig. 3) and about 1.1 × 10⁵ cps for BF1, 7.5 × 10⁴ cps for BF2 and 5.5 × 10⁴ cps for BF3 in the case of EB2 (blue bars of Fig. 3). This is due to the presence of silanol groups on the surface formed during the chemical treatment with NH4OH![[thin space (1/6-em)]](https://www.rsc.org/images/entities/char_2009.gif) :
:![[thin space (1/6-em)]](https://www.rsc.org/images/entities/char_2009.gif) H2O2
H2O2![[thin space (1/6-em)]](https://www.rsc.org/images/entities/char_2009.gif) :
:![[thin space (1/6-em)]](https://www.rsc.org/images/entities/char_2009.gif) H2O. These groups probably induce the formation of hydrogen bonds between the surface and the skeleton of the DNA molecule in the presence of high ionic strength solutions. Further mechanistic investigations are currently under way in our laboratories in this concern.
H2O. These groups probably induce the formation of hydrogen bonds between the surface and the skeleton of the DNA molecule in the presence of high ionic strength solutions. Further mechanistic investigations are currently under way in our laboratories in this concern.
It should be emphasized that the binding capacity occurs without the employment of chaotropic salts or ethanol that are well-known inhibitors of the PCR or other molecular techniques and make the design of miniaturized systems more complex (vide supra).
In terms of elution capability, we observe that water (EB-1) works better than the low-ionic strength buffer EB-2. In fact, the calculated elution efficiency percentage (see eqn (2)‡) in the case of water was about 50% higher than EB-2 buffer (75% water versus 50% EB-2). This can be tentatively attributed to the better ability of water to make the electrostatic interaction between DNA and surface hydrating DNA molecules thermodynamically unstable.
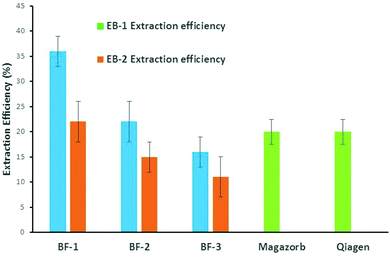
Finally, we calculated the total extraction efficiency of the three types of BF devices by means of eqn (3)§ and compared them with those related to two commercial state-of-the-art kits, Magazorb and Qiagen based on magnetic beads and silica filter, respectively. Fig. 4 illustrates the obtained results.
It is noteworthy that BF-1 shows the best extraction performance achieving about 36% efficiency using water as elution buffer versus 22% for BF-2, 16% for BF-3 (blue bars) and 20% for both Magazorb and Qiagen (green bars). Using EB-2 as elution buffer (orange bars), the final extraction efficiency of BF-1 is comparable with those of the commercial kits, while those of BF-2 and Bf-3 were slightly lower. The latter finding is in line with the previous results discussed above for elution efficiency. As far as the better result displayed by BF1 is concerned, we believe that a probable synergy between the filter structure and the experimental protocol adopted may play a key role.
3.3 Extraction and real time amplification on the chip
As a preliminary step towards the development of a genetic point-of-care device, we evaluated, in a semi-integrated configuration, the real genetic testing using the biofilter exhibiting the best extraction efficiency (BF1) in combination with a silicon integrated real time PCR amplification chip. In order to be compliant with the analytical procedure for quantitative analysis, the microchip has been designed to feature six reaction chambers to host both positive (Ctr+) and negative (Neg) controls and the sample. Furthermore, the microchip contains integrated temperature sensors and heaters to perform a one-step real time PCR process quickly.28–30Fig. 5a illustrates the scheme of the system configuration (the BF-1 extraction chip combined with the real time PCR chip) employed for this study.The on-chip amplification results on the extracted sample by BF1 are shown in Fig. 5b. The Ct values for both the starting (5 × 10⁵ cps) and the BF1-extracted solutions were 22.4 and 26.3, respectively. The final concentrations of these solutions were calculated by the calibration curves embedded into the chip. Specifically, it was obtained by means of the Ct values exhibited by the three positive controls (Ctrl + 1 × 10⁶, 1 × 10⁴ and 1 × 10³ cps) equal to 19.4, 23.9 and 31.0, respectively (the negative (Neg) control gave no results as expected). The calculation led to values of about 1.9 × 10⁵ for the starting solution and 7.8 × 10⁴ for the extracted solution. Based on these results, the extraction efficiencies calculated by eqn (3)§ correspond to about 40%. This is fully in agreement with the results obtained previously in the analytical characterization of BF1, and confirms the best extraction performance with respect to the commercial kits.
Furthermore, our results indicate that technology that uses micropillars in combination with an integrated real time PCR microchip can be very appealing for future developments of a fully-integrated genetic PoC device able to perform molecular genetic analysis close to the patient.
4. Conclusions
We have presented new miniaturised microfluidic biofilter (BF) devices based on silicon micropillars able to extract analytical samples of HBV (at a concentration comparable with real samples for infectious diseases of 105 copies), without chaotropic salt or ethanol. The extraction efficiency reaches about 40% in the case of the device exhibiting the highest SVR value (BF-1). This value is about 16% higher than that measured with a commercial kit, under the same experimental conditions, which is probably the result of a synergy between the filter structure and the experimental protocol adopted. This device has also been tested in combination with the silicon microchip for real time PCR as a preliminary step towards the development of a fully-integrated genetic point-of-care device. The results obtained confirm a better extraction performance with respect to that exhibited by the commercial kits.The findings here discussed encourage us in continuing our work towards the full integration of DNA extraction–PCR amplification modules in a monolithic device. This will allow to manage in one step the total molecular analysis process starting from real samples. In this case, the integration of all molecular steps in a monolithic device offers the advantages to perform molecular analyses easily in one step by non-specialised personnel. An additional benefit is the low cost of the genetic analysis since the volumes of reagents involved (few μL) are reduced compared to the current commercial kit (some tens of μL).
Acknowledgements
We are grateful to Prof. Salvatore Sortino for the critical reading of the manuscript.References
- D. R. Stedtfeld, D. M. Tourlousse, G. Seyrig, T. M. Stedtfeld, M. Kronlein, S. Price, F. Ahmad, E. Gulari, J. M. Tiedje and S. A. Hashshman, Lab Chip, 2012, 12, 1454–1462 RSC.
- The point-of-care diagnostics market: Growth Drivers and Challenges to Widespread Adoption by Scientia Advisor, 2010 (http://www.scientiaadv.com).
- C. Zhang, J. Xu, W. Ma and W. Zheng, Biotechnol. Adv., 2006, 24, 243–284 CrossRef CAS PubMed.
- A. Rajan and H. Glorikian, Expert Opin. Med. Diagn., 2009, 1, 1–4 CrossRef PubMed.
- F. Ahmad, et al. , Anal. Chim. Acta, 2012, 733, 1–15 CrossRef CAS PubMed.
- C. Zhang, et al. , Biotechnol. Adv., 2006, 24, 243–284 CrossRef CAS PubMed.
- D. R. Almassian, et al. , Chem. Soc. Rev., 2013, 42, 8769–8798 RSC.
- B. Foglieni, A. Brisci, F. San Biagio, P. Di Pietro, S. Petralia, S. Conoci, M. Ferrari and L. Cremonesi, Clin. Chem. Lab. Med., 2010, 48, 329–336 CrossRef CAS PubMed.
- N. Giamblanco, S. Conoci, D. Russo and G. Marletta, RSC Adv., 2015, 5, 38152–38158 RSC.
- G. Ventimiglia, E. Alessi and S. Petralia, Sens. Actuators, B, 2016, 232, 102–106 CrossRef CAS.
- Z. Hua, J. L. Rouse, A. L. Eckhardt, V. Srinivasan, V. K. Pamula, W. A. Schell, j. L. Benton, T. G. Mitchell and M. G. Pollak, Anal. Chem., 2010, 82, 2310–2316 CrossRef CAS PubMed.
- G. Ventimiglia, E. Alessi and S. Petralia, Sens. Transducers J., 2012, 139, 152–116 CAS.
- E. T. Lagally, J. R. Scherer, R. G. Blazej, N. M. Toriello, B. A. Diep, M. Ramchandani, G. F. Sensabaugh, L. W. Riley and R. A. Mathies, Anal. Chem., 2004, 76(11), 3162–3170 CrossRef CAS PubMed.
- J. J. Benitez, J. Topolancik, H. C. Tian, C. B. Wallin, D. R. Latulippe, K. Szeto, P. J. Murphy, B. R. Cipriany, S. L. Levy, P. D. Soloway and H. G. Craighead, Lab Chip, 2012, 12, 4848–4854 RSC.
- M. Cbreadmore, K. A. Wolfe, I. G. Arcibal, W. K. Leung, D. Dickson, B. C. Giordano, M. E. Power, J. P. Ferrance, S. H. Feldman, P. M. Norris and J. P. Landers, Anal. Chem., 2003, 75, 1880–1886 CrossRef.
- X. Chen, D. Cui, C. Liu, H. Li and J. Chen, Anal. Chim. Acta, 2007, 584, 237–243 CrossRef CAS PubMed.
- N. C. Cady, S. Stelick and C. A. Batt, Biosens. Bioelectron., 2003, 19, 59–66 CrossRef CAS PubMed.
- K.-H. Hwang, H.-K. Lim, S.-Y. Jung, K. Namkoong, J-H Kim, N. Huh, C. Ko and J-C Park, Anal. Chem., 2008, 80, 7786–7791 CrossRef CAS PubMed.
- H. M. Hegab, M. Soliman, S. Ebrahim and M. Op de Beeck, J. Bionsens. Bioelectron., 2013, 4, 1–6 Search PubMed.
- L. Chen, A. Manz and P. J. R. Day, Lab Chip, 2007, 7, 1413–1423 RSC; B. H. Park, Y. T. Kim, G. H. Yung and T. S. Seo, Microchim. Acta, 2014, 181, 1655–1668 CrossRef CAS.
- S. Petralia and G. Ventimiglia, BioNanoScience, 2014, 4, 226–231 CrossRef; N. Y. Lee, Int. Neurourol., 2013, 17, 2–10 CrossRef PubMed.
- S. Petralia, R. Verardo, E. Klaric, S. Cavallaro, E. Alessi and C. Schneider, Sens. Actuators, B, 2013, 187, 99–105 CrossRef CAS.
- J. M. Buller, Forensic DNA Typing: Biology and technology behind STR Markers, Academic Press, SanDiego, USA, 2001 CrossRef CAS PubMed; H. Tian, A. F. Huhmer and J. P. Landers, Anal. Biochem., 2000, 283, 175–191 CrossRef CAS PubMed.
- J. West, M. Boerlin, A. D. Jadhav and E. Clancy, Sens. Actuators, B, 2007, 126(2), 664–671 CrossRef CAS.
- D. J. Kieleczawa, DNA Sequencing II dealing with difficult template, Jones and Bartlett Pubblishers, Sudbury, MA, USA, 2008 Search PubMed.
- L. A. Christel, K. Petersen, W. McMillan and M. A. Northrup, J. Biomech. Eng., 1999, 121, 22–27 CrossRef CAS PubMed.
- Martin F. Polz and Colleen M. Cavanaugh, Appl. Environ. Microbiol., 1998, 3724–3730 CAS.
- S. Petralia, M. E. Castagna, M. O. Spata, M. G. Amore and S. Conoci, Biosens. J., 2016, 5, 136 Search PubMed.
- S. Petralia, M. E. Castagna and D. Motta, BioNanoScience, 2016, 1, 1–7 Search PubMed.
- M. Spata, M. E. Castagna and S. Conoci, Sens. Biosens. Res. J., 2015, 6, 79–84 Search PubMed.
| This journal is © The Royal Society of Chemistry 2017 |

