 Open Access Article
Creative Commons Attribution 3.0 Unported Licence
The influence of deposited potential on the ORR activity of Pt catalysts on glassy carbon electrode
Fengting Caoa,
Zhao Zangb,
Shimei Suna,
Xiaolin Suna,
Xichao Lia,
Tao Liu a and
Jianfei Wu
 *a
*a
aQingdao Industrial Energy Storage Research Institute, Qingdao Institute of Bioenergy and Bioprocess Technology, Chinese Academy of Sciences, No. 189 Songling Road, 266101 Qingdao, PR China. E-mail: wujf@qibebt.ac.cn; Tel: +86-0532-80662751
bCollege of Mechanical and Electrical Engineering in China University of Petroleum, Qingdao, 266580, PR China
First published on 11th May 2017
Abstract
In this study, Pt catalysts were fabricated on a glassy carbon (GC) electrode Pt/GC using a potentiostatic technique at different reduction potentials in potassium hexachloroplatinate solutions with hydrochloric acid. The compositions of the catalysts were determined using energy dispersive spectroscopy (EDS), the surface morphologies were observed using scanning electron microscopy (SEM), and the crystal structure was confirmed using thin-film X-ray diffraction (XRD). The results show that all the electrodeposited Pt/GC catalysts exhibit a higher electrochemical activity for the oxygen reduction reaction (ORR) when compared with a commercial Pt/C electrode. There is an optimum electrodeposited potential (−0.15 V vs. Ag/AgCl) at which the Pt/GC electrode displays the highest electrochemical activity for the ORR due to the high-index plane and shape effect of the Pt particles. At a lower electrodeposited potential, the applied current density is high enough to form large and coarse metal particles, while at a higher electrodeposited potential, the active sites of Pt particles decrease because of its equiaxed shape.
1. Introduction
In proton exchange membrane fuel cells (PEMFC), catalysts are required for the oxygen reduction reaction (ORR) due to its sluggish kinetics under typical operation conditions.1,2 Various catalysts have been developed thus far with the most effective one being platinum, one of the most expensive metals on the earth, and its alloys.3–5 Nevertheless, because of the significant potential loss of ORR, a much higher loading amount of Pt-based catalysts is required, resulting in the high cost of PEMFC, and thereby severely impeding its commercialization.6–8To overcome this obstacle, one strategy is to maximize the performance of the Pt-based catalysts with a large specific surface area, high catalytic activity, and high stability. It was reported9,10 that the method of preparation, the microstructure, particle size and shape are the main factors influencing the ORR activity of Pt-based catalysts. One of the most widely used methods is electrodeposition,11–16 particularly potentiostatic deposition,13,14 which has been found to be an increasingly attractive route for the preparation of nanostructured catalysts because of its ease of operation, flexibility and high purity. In addition, the electrodeposition technique can be used to prepare the catalyst layer directly on the substrate in a single step with uniform particle distribution and selected particle sizes.17
Although electrodeposition is an attractive technique to prepare the catalyst layers for PEMFC, little work has been carried out on the preparation of catalysts using this method. The performance of Pt nanoparticles prepared using potentiostatic deposition is determined by several parameters, such as deposited potential, deposition temperature and the amount of charge passed during the deposition process. Yun-Bin Cho et al.18 fabricated nanoporous Pt films with three different degrees of porosity using amperometry and cyclic voltammetry. Among these, the one prepared by applying −0.21 V (vs. SCE) for 1300 (±100) s had the smallest particle size and exhibited the most positive ORR onset potential in the kinetically controlled region. Their study indicated the influence of the electrodeposition potential on the structure of the Pt nanoparticles and the kinetics of the ORR reaction. Nguyet Doan et al.19 obtained mesoporous Pt using the potentiostatic mode at −175 mV vs. SCE, and the mass activities were better than those of other Pt catalysts reported in the literature. Nevertheless, the reason for choosing this deposition potential in their study was not elaborated on, and it is uncertain whether this potential was optimal or not. Zaenal Awaludin et al.20 also prepared a Pt/GC catalyst using the potentiostatic deposition method. The deposited potential was fixed at −0.06 V vs. Ag|AgCl|KCl(sat), and the amount of charge passed during the deposition was set at 32 mC cm−2. Unfortunately, a clear explanation of the deposition potential was also not given in their report.
Based on the analysis of the literature thus far, it can be seen that the optimal deposition potentials of Pt particles are not identical and vary with the specific deposition conditions. A systematic investigation of this issue is lacking. For this reason, the aim of the present study was to find out the optimal deposition potential of Pt particles on the glassy carbon electrode (Pt/GC) to achieve the highest ORR catalyst activity, and the relative mechanism was proposed.
2. Experimental
2.1 Preparation of electrocatalysts
The electrodeposition process was conducted in a three-electrode cell using an electrochemical workstation (CHI750E). A glassy carbon electrode (GC) with a diameter of 3 mm was chosen as the substrate, and a Pt wire and Ag/AgCl (in saturated KCl) were used as the counter and the reference electrodes, respectively. The GC electrode was mechanically ground with silicon carbide papers from 3000 to 5000 grit, followed by ultrasonication in ethyl alcohol and Milli-Q water for 10 min, sequentially. The electrolyte consisted of 3 mM potassium hexachloroplatinate (K2PtCl6) and 0.1 M hydrochloric acid (HCl). A potential of −0.20 V, −0.15 V and −0.06 V (vs. Ag/AgCl) was applied to the GC electrode in the electrolyte (3 mM K2PtCl6 + 0.1 M HCl) under a saturated Ar environment, and the amount of charge during the deposition was set at 32 mC cm−2.For comparison, a commercial Pt/C thin film catalyst was prepared by adopting a technique based on the report of Garsany et al.21 Briefly, a 67% isopropanol solution (marked solution A) was acquired by mixing 18 mL of isopropanol and 9 mL of pure water. Furthermore, 21 mL of solution A was transferred into a vial containing 34.5 mg of 40 (wt%) commercial Pt/C (JM, Johnson Matthey Corp.), followed by ultrasonication for 60 min; thus solution B was obtained. After that, 3.92 mL of solution A, 1.08 mL of solution B and 20 μL of a 50 (wt%) Nafion solution were mixed together and ultrasonicated for 30 min; thus the commercial Pt/C ink was prepared. Finally, 5 mL of the prepared commercial Pt/C ink was cast onto a bare GC disk electrode (Φ 3 mm) and dried in air. The prepared commercial Pt/C electrode had a Pt loading of 10 mgPt cm−2.
2.2 Electrochemical measurements
Cyclic voltammetry (CV) was conducted in 0.1 M HClO4 under a saturated N2 and O2 environment at a scan rate of 200 mV s−1. The electrochemical surface area (ECSA, in m2 gPt−1) of Pt was assessed by integrating the hydrogen desorption region obtained in the CV measurements under a saturated N2 atmosphere. The electrochemical impedance spectroscopy (EIS) of Pt/GC was obtained under a saturated O2 environment at an open circuit potential (OCP) to evaluate the impedance of the catalysts. The frequency ranged from 10 kHz to 10 mHz with an amplitude of 5 mV AC signals, and the ZSimpDemo 3.30d software was used to fit the EIS data. These electrochemical measurements were also conducted using the electrochemical workstation (CHI750E) mentioned above.All reagents used in this study were analytical-grade; oxygen and nitrogen were 99.9% pure provided by a local supplier. All electrochemical measurements were conducted at least twice for repeatability at room temperature around 25 ± 1 °C. The potential values in this study were versus Ag/AgCl (in saturated KCl) unless noted otherwise.
2.3 Materials characterization
In order to facilitate the surface observations, indium tin oxide (ITO) conductive glass was chosen as the substitute of the GC electrode when preparing the corresponding specimens. In the process of electrodeposition on ITO, the amount of charge passed was the same to that on the GC electrode (32 mC cm−2).The surface morphology and energy dispersive spectra (EDS) of the as-prepared Pt/ITO electrodes were observed using a Hitachi S-4800 field emission scanning electron microscope (SEM), and the crystal structure was confirmed using thin-film X-ray diffraction (XRD) (Rigaku D/MAX-2500) equipped with a Cu Kα radiation source. XRD analysis was carried out using a Rigaku X-ray diffractometer with a Cu Kα (λ = 0.15418 nm) radiation source and a Ni filter.
3. Results and discussion
3.1 Electrochemical properties
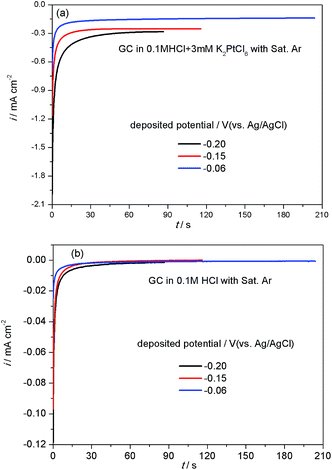
Fig. 1(a) shows the amperometric i–t curves measured during the electrodeposition of Pt/GC at different potentials. It can be seen that the deposition current density first increased rapidly and then achieved a steady platform value under all the deposition potentials studied. The platform value of current density decreased with an increase in the deposition potential, leading to the times of reaching the set amount of charge (32 mC cm−2) to prolonged, which were 87, 116 and 204 s at −0.20, −0.15 and −0.06 V, respectively. It is reported22 that the reduction of PtCl62− to Pt2+ species should occur at potentials more positive than −0.3 VMSE (0.119 V vs. Ag/AgCl) when the hydrogen evolution is negligible at −0.5 VMSE (−0.081 V vs. Ag/AgCl) and a current efficiency close to 100% is expected. Accordingly, under these three deposition potentials of −0.20, −0.15 and −0.06 V, PtCl62− can be readily reduced into Pt2+ species.In the electrodeposition process of Pt/GC, the total quantity of charge (Qtot, 32 mC cm−2) was divided into two parts: one part of the charge was consumed by the reduction of PtCl62− into Pt (QPt, in mC cm−2) and the other part was used for the double layer charging (Qdl, in mC cm−2). Qdl could be obtained by integration of the amperometric i–t curves in 0.1 M HCl solution at three deposited potentials (−0.20, −0.15 and −0.06 V), as seen in Fig. 1(b). At each potential, the deposition time was set the same as with that used in the deposition solution with 3 mM K2PtCl6. The Pt loading amount of the Pt/GC catalysts (W in μg cm−2) was calculated by the quantity of electricity related to the total reduction of PtCl62− into Pt QPt using the following equation:23
 | (1) |
![[thin space (1/6-em)]](https://www.rsc.org/images/entities/char_2009.gif) 500 C mol−1). The results for Qtot, Qdl, QPt and W are listed in Table 1. As can be seen, the Pt loadings of Pt/GC at all the deposition potentials studied are close to each other, around 16 μg cm−2.
500 C mol−1). The results for Qtot, Qdl, QPt and W are listed in Table 1. As can be seen, the Pt loadings of Pt/GC at all the deposition potentials studied are close to each other, around 16 μg cm−2.
| Deposited potential/V | Qtot/mC cm−2 | Qdl/mC cm−2 | QPt/mC cm−2 | W/μg cm−2 | ECSA/(m2 gPt−1) |
|---|---|---|---|---|---|
| JM Pt/C | — | — | — | 10 | 0.033 |
| −0.20 | 32 | 0.45 | 31.55 | 15.95 | 8.219 |
| −0.15 | 32 | 0.28 | 31.72 | 16.03 | 9.591 |
| −0.06 | 32 | 0.29 | 31.71 | 16.03 | 17.80 |
The CV curves obtained for bare GC, commercial Pt/C electrode and the as-prepared Pt/GC catalysts under a saturated Ar atmosphere are shown in Fig. 2(a). There was no peak at the bare GC electrode, implying that no electrochemical reaction occurred in this case. For a better comparison, the catalytic activity of Pt was normalized and calculated in units of AgPt−1, as shown in Fig. 2(b). It can be seen that an unobvious reduction peak emerged in the range of 0.5–0.6 V. The explanation of this peak is that the Pt atom was oxidized at the high initial scan potential (1.0 V) and then reduced when the potential shifted to the lower region. On the other hand, the hydrogen desorption area enlarged with an increase in the deposition potential. It is known24 that the ECSA of Pt can be determined by dividing the electric charge for hydrogen desorption QH(C) by the standard charge of hydrogen on a smooth Pt surface QH–Pt (i.e., 2.10 C m−2):20
 | (2) |
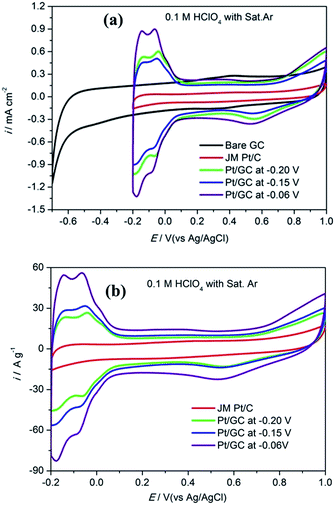 | ||
| Fig. 2 The cyclic voltammogram curves in unit of mA cm−2 (a) and A g−1 (b) obtained for a commercial Pt/C electrode and the as-prepared Pt/GC catalysts in 0.1 M HClO4 under a saturated Ar atmosphere. | ||
Fig. 3 shows the CV curves obtained for bare GC, the commercial Pt/C electrode and the as-prepared Pt/GC catalysts under a saturated O2 atmosphere. A notable reduction peak appeared in each CV curve that was not shown in those under a saturated Ar atmosphere shown in Fig. 2(a), and the current increased evidently because of the presence of O2. Evidently, this peak belongs to the oxygen reduction reaction (ORR). On the bare GC electrode surface, a reduction peak appeared at around −0.30 V compared to that observed in an Ar atmosphere. In regard to the electrodeposited Pt/GC catalysis, the ORR peak potential shifted significantly towards a positive value. The specific ORR peak potentials of the commercial Pt/C and electrodeposited Pt/GC electrodes are shown in Table 2, as well as the difference (ΔEshift) between the ORR peak potentials of the Pt/GC electrodes and that of the commercial Pt/C electrode is exhibited. Clearly, the Pt/GC electrode prepared under −0.15 V shifted by the maximum value, 0.210 V. It is believed that a shift in the ORR peak to a higher potential reflects a decrease in the adsorption strength for the other oxygen containing species on the surface, e.g. OHads.25 At the same time, the peak current density of ORR was also increased on the Pt/GC electrodes compared with that of the commercial Pt/C electrode. A maximum of the peak current density also appeared on the Pt/GC catalyst prepared under −0.15 V. It is worth noting that although the Pt/GC catalyst prepared under −0.15 V had a lower ECSA than that at −0.06 V, its ORR activity was the highest according to the ORR potential and current density.
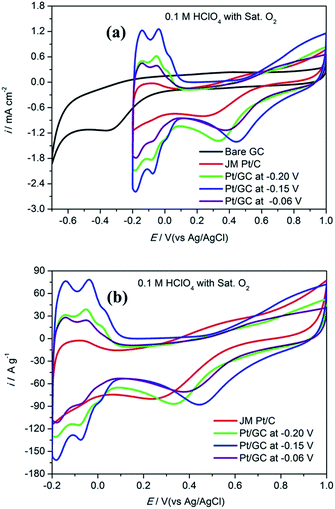 | ||
| Fig. 3 The cyclic voltammogram curves in unit of mA cm−2 (a) and A g−1 (b) obtained for a commercial Pt/C electrode and the as-prepared Pt/GC catalysts in 0.1 M HClO4 under saturated O2 atmosphere. | ||
| Deposited potential/V | Ep,ORR/mV | ΔEshift/mV | ip,ORR/mA cm−2 |
|---|---|---|---|
| JM Pt/C | 0.236 | 0 | −0.803 |
| −0.20 | 0.332 | 0.096 | −1.386 |
| −0.15 | 0.446 | 0.210 | −1.407 |
| −0.06 | 0.375 | 0.139 | −1.135 |
In order to obtain additional information on the ORR, the EIS characteristics of the electrodes, whose catalyst layers were deposited at different potentials, were investigated in 0.1 M HClO4 under a saturated O2 atmosphere. The corresponding plots are shown in Fig. 4. All the EIS presented a large semicircle in the Nyquist diagram, but the arc diameters were different. The wide phase angle in the Bode diagram shown in Fig. 4(c) suggests that there are at least two time constants in each EIS curve, corresponding to one capacitive arc on the Nyquist spectrum in the high-frequency domain and the other in the low-frequency domain.26 These two capacitive arcs overlap together and thus, only one large semicircle appears in the Nyquist diagram. At high frequencies, the capacitive arc is a gauge of the charge transfer.
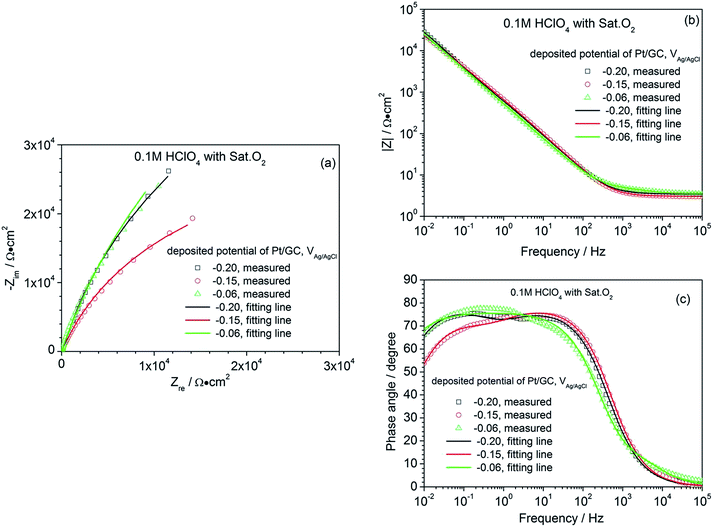 | ||
| Fig. 4 Nyquist (a) and Bode (b, and c) diagram of a commercial Pt/C electrode and the as-prepared Pt/GC catalysts in 0.1 M HClO4 under a saturated O2 atmosphere. | ||
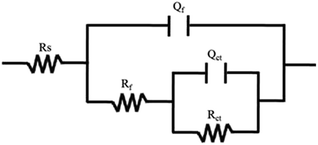
Resistance, relating to the charge transfer reaction kinetics27,28 and contributing to the cathodic ORR processes; the second capacitive arc in the low-frequency region represents the mass transfer process, contributing to the diffusion of oxygen to the Pt active surfaces and the proton transfer resistance within the catalyst layers. The EIS data are always fitted using an equivalent circuit to gain more details on the ORR process. Based on the analysis above, the equivalent circuit R(Q(R(QR))) shown in Fig. 5 is more appropriate for all the Pt/GC electrodes and the fitted results are listed in Table 3. The fitting accuracy was estimated using the chi-square value (χ2), which was in the magnitude of 10−4 for all of the fitted data in this study, implying that this equivalent circuit is suitable to reflect the ORR process of the electrodes. In this equivalent circuit, Rs is the solution resistance, Qf is the constant phase element (CPE) of the deposited layer of Pt particles, Rf is the resistance of deposited layer, Qct is the constant phase element (CPE) of the electric double layer and Rct is the charge transfer resistance for the ORR of the GC interface. Considering that the heterogeneity of the electrode surface could cause deviation in the electric double layer from pure capacitance, a constant phase angle element Q was chosen to substitute the pure capacitance C. The impedance function of a CPE complies with the following equation:
| ZCPE = Y0−1(jω)−n | (3) |
| Deposited potential/V | Rs/Ω cm2 | Qf − Y0/10−4 F cm−2 | n | Rf/103 Ω cm2 | Qct − Y0/10−4 F cm−2 | n | Rct/105 Ω cm2 |
|---|---|---|---|---|---|---|---|
| −0.20 | 3.45 | 1.62 | 0.83 | 0.16 | 3.78 | 0.88 | 1.23 |
| −0.15 | 3.06 | 2.84 | 0.87 | 4.30 | 1.04 | 0.74 | 0.58 |
| −0.06 | 3.54 | 1.39 | 0.85 | 0.02 | 2.62 | 0.84 | 1.87 |
The ORR process is very complicated, including the charge transfer process, the mass transfer process, and the reactions on the catalyst.29 Therefore, enhancing the electron transfer ability by lowering the charge transfer resistance Rct is an effective way to optimize an ORR catalyst.30 A lower Rct value suggests the superior charge transfer ability during the ORR, which can facilitate the ORR process. As can be seen in Table 3, the charge transfer resistance Rct of the Pt/GC electrode deposited at −0.15 V has a minimum value of 0.58 × 10⁵ Ω cm2, suggesting a fastest reaction rate for the ORR on this electrode. The results of EIS are in agreement with those found for the CV presented above.
3.2 Surface characterization
Fig. 6 presents the SEM images and EDS of the Pt particles electrodeposited on ITO. As can be seen, the surface morphology of the samples was strongly dependent on the deposition potentials. The Pt particle prepared under −0.20 V exhibited cube shapes with several sharp corners (Fig. 6a1, high magnification), uniformly distributed (Fig. 6a2, low magnification) and displayed a grain size close to 100 nm. These sharp corners maybe ascribed to the Pt(111) facet, which is the main face of the tetrahedral structures. It could be seen from the i–t curves (shown in Fig. 1) that the current density deposited under −0.20 V was the highest. It is reported31 that the nucleation rate of electrodeposition can be promoted at a high applied current density, causing the formation of small grain-sized particles and fine crystal structure. Nevertheless, if the applied current density is high enough to make the electrodeposition proceed under (or closer to) mass transfer control, large and coarse metal particles are formed.17,32 Accordingly, the current density under a deposition potential of −0.20 V may be so high that the electrodeposition is under mass transfer control and thus, produces coarse particles. When deposited at −0.15 V, the distribution of Pt particles became more uniform, and the particle size was smaller and appeared as regular cubes without sharp corners (Fig. 6b1). At the same time, the distribution density of the Pt particles increased under this deposition potential compared to that under −0.20 V (Fig. 6b2), resulting in an increase in the Pt atom percentage rising from 0.51 (Fig. 6a3) to 0.82 (Fig. 6b3). The specific areas of the EDS analysis are those in the red frames shown in Fig. 6a2, b2 and c2 for the catalysts obtained at −0.20 V, −0.15 V and −0.06 V, respectively. Because the magnification in Fig. 6a2, b2 and c2 was 21![[thin space (1/6-em)]](https://www.rsc.org/images/entities/char_2009.gif) 000, each area in the red frames was about 30 μm2, which is much greater than the diameter of the beam (in nm) in EDS and thus, the EDS data is credible for qualitative analysis.
000, each area in the red frames was about 30 μm2, which is much greater than the diameter of the beam (in nm) in EDS and thus, the EDS data is credible for qualitative analysis.
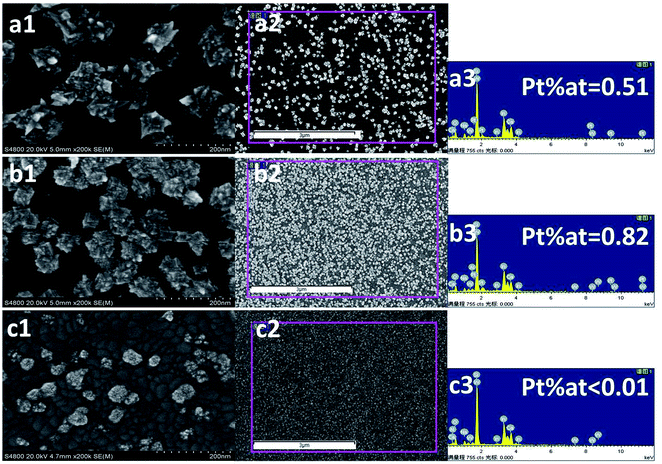 | ||
| Fig. 6 The SEM images and EDS of the Pt/ITO prepared at different deposited potentials: −0.20 V (a1, a2 and a3), −0.15 V (b1, b2 and b3), −0.06 V (c1, c2 and c3). | ||
It is noticeable that at an equal applied charge density, the amount of catalyst loading obtained at the lower current density (corresponding to the deposition potential of −0.15 V) tends to be higher than that obtained at the higher current density (corresponding to the deposited potential of −0.20 V). This may be ascribed to the intense hydrogen evolution and low current efficiency caused by the higher current density.33 When deposition was carried out under −0.60 V, the Pt particles became equiaxed crystals with a much smaller particle size, less than 50 nm (Fig. 6c1). It has been demonstrated that the shape of the particles has a great influence on its catalytic efficiency. Particles with multipods exhibit better catalytic activity than spherical ones due to the presence of rich active edges/corner atoms.34 Accordingly, the low catalytic activity of the Pt/GC electrode deposited at −0.06 V with equiaxed crystals is reasonable, considering its lower number of active sites. Moreover, the distribution of the particles (Fig. 6c2) was not uniform and the deposited amount decreased sharply, which was not detectable using the EDS technique (Fig. 6c3).
Fig. 7 shows the XRD patterns of the electrodeposited Pt catalysts on ITO (a) and the partially enlarged region (b). All the strong peaks in the obtained XRD patterns originate from the ITO background (In2O3(222) and In2O3(400)) because of the small loading amount of the electrodeposited Pt catalysts. Significantly, there were weak peaks originating from the deposited Pt particles in the high region of the Pt/ITO XRD patterns, which did not exist in the naked ITO. In the XRD pattern deposited under −0.20 V, a peak located at around 40° appeared, corresponding to the crystallographic planes of Pt(111), while under −0.15 and −0.06 V a peak emerged at around 46°, indicating the existence of the crystallographic planes Pt(200). Since the crystal structure of Pt metal belongs to cubic systems, its lattice parameters can be calculated using the following equation:35
 | (4) |
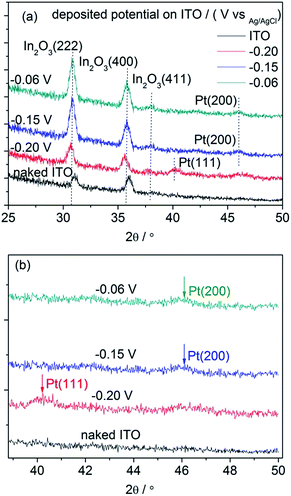 | ||
| Fig. 7 The XRD patterns obtained for the Pt/ITO catalyst grown on ITO and background ITO (a), the partial enlarged region (b). | ||
| Deposited potential/V | (hkl) | 2θ/° | sin![[thin space (1/6-em)]](https://www.rsc.org/images/entities/char_2009.gif) θ θ |
a/Å |
|---|---|---|---|---|
| −0.20 | (111) | 40.25 | 0.3441 | 3.8776 |
| −0.15 | (200) | 45.90 | 0.3899 | 3.9510 |
| −0.06 | (200) | 45.85 | 0.3895 | 3.9551 |
It has been demonstrated that nanoparticles with high-index planes have higher activity than (111) or (100),36,37 including tetrahexahedron (hk0), trapezohedron (hkk) and trisoctahedron (hhk) with at least one Miller index being larger than unity. This activity enhancement in the high-index planes was ascribed to the high density of the low-coordinated atoms situated on the steps, ledges and kinks.38,39 The ORR activities were highly dependent on the orientation of the steps and terraces on the surfaces. Accordingly, it is reasonable that the ORR activity of the Pt catalyst was higher when deposited under −0.15 V than that under −0.20 V. On the other hand, although the particle size of Pt deposited under −0.06 V was smaller than that under −0.15 V and also possessed the high-index planes, the equiaxed particle shape with less active sites limited the ORR activity of the catalyst. As mentioned above, the highest ECSA of Pt/GC under −0.06 V did not definitely correspond to the highest ORR activity.
4. Conclusions
Pt catalysts were prepared on glassy carbon (GC) electrodes using a potentiostatic method under different deposition potentials. The electrode deposited at −0.15 V exhibited the highest ORR activity with the existence of high-index planes and the shape effect of Pt. Neither too high nor too low potential is in favourable for the catalytic activity considering both the exposed planes and the shape of the Pt particles.Acknowledgements
This study was supported by the National Natural Science Foundation of China (No. 21673267).References
- X. Zhou, J. Qiao, L. Yang and J. Zhang, Adv. Energy Mater., 2014, 4, 1301523 CrossRef.
- J. K. Dombrovskis and A. E. C. Palmqvist, Fuel Cells, 2016, 16, 4 CrossRef CAS.
- Y. Wang, H. Luo, G. Li and J. Jiang, Appl. Energy, 2016, 173, 59 CrossRef CAS.
- Z. D. Wei, S. H. Chan, L. L. Li, H. F. Cai, Z. T. Xia and C. X. Sun, Electrochim. Acta, 2005, 50, 2279 CrossRef CAS.
- J. Li, F. Ye, L. Chen, T. Wang, J. Li and X. Wang, J. Power Sources, 2009, 186, 320 CrossRef CAS.
- H. A. Gasteiger, S. S. Kocha, B. Sompalli and F. T. Wagner, Appl. Catal., B, 2005, 56, 9 CrossRef CAS.
- R. Borup, J. Meyers, B. Pivovar, Y. S. Kim, R. Mukundan, N. Garland, D. Myers, M. Wilson, F. Garzon and D. Wood, Chem. Rev., 2007, 107, 3904 CrossRef CAS PubMed.
- J. Liu, E. Li, M. Ruan, P. Song and W. Xu, Catalysts, 2015, 5, 1167 CrossRef CAS.
- S. Mukerjee and J. Mcbreen, J. Electroanal. Chem., 1998, 448, 163 CrossRef CAS.
- N. Markovic, H. Gasteiger and P. N. Ross, J. Electrochem. Soc., 1997, 144, 1591 CrossRef CAS.
- B. Geboes, J. Ustarroz, K. Sentosun, H. Vanrompay, A. Hubin, S. Bals and T. Breugelmans, ACS Catal., 2016, 6, 5856 CrossRef CAS.
- H. Kim, N. P. Subramanian and B. N. Popov, J. Power Sources, 2004, 138, 14 CrossRef CAS.
- J. Seo, D. Cha, K. Takanabe, J. Kubota and K. Domen, ACS Catal., 2013, 3, 2181 CrossRef CAS.
- S. B. Han, Int. J. Electrochem. Sci., 2016, 3803 CrossRef CAS.
- J. Kaushik, T. D. Van Anh, V. Tiny, C. Serdar and F. A. de Bruijn, J. Phys. Chem. C, 2009, 113, 20371 Search PubMed.
- M. M. E. Duarte, A. S. Pilla, J. M. Sieben and C. E. Mayer, Electrochem. Commun., 2006, 8, 159 CrossRef CAS.
- Y. Saejeng and N. Tantavichet, J. Appl. Electrochem., 2008, 39, 123 CrossRef.
- Y. B. Cho, C. Lee and Y. Lee, J. Electrochem. Soc., 2015, 162, H792 CrossRef CAS.
- N. Doan, T. Sundqvist, P. Hiekkataipale, J. Korhonen, T. Kallio, J. Ruokolainen, K. Kontturi and C. Johans, Int. J. Electrochem. Sci., 2015, 10, 2535 CAS.
- Z. Awaludin, J. G. Sheng Moo, T. Okajima and T. Ohsaka, J. Mater. Chem. A, 2013, 1, 14754 CAS.
- Y. Garsany, O. A. Baturina, K. E. Swider-Lyons and S. S. Kocha, Anal. Chem., 2010, 82, 6321 CrossRef CAS PubMed.
- K. Shimazu, D. Weisshaar and T. Kuwana, J. Electroanal. Chem., 1987, 223, 223 CrossRef CAS.
- F. Gloaguen, J. M. Léger and C. Lamy, J. Appl. Electrochem., 1997, 27, 1052 CrossRef CAS.
- F. Takasaki, S. Matsuie, Y. Takabatake, Z. Noda, A. Hayashi, Y. Shiratori, K. Ito and K. Sasaki, J. Electrochem. Soc., 2011, 158, B1270 CrossRef CAS.
- Z. M. Zhou, Z. G. Shao, X. P. Qin, X. G. Chen, Z. D. We and B. L. Yi, Int. J. Hydrogen Energy, 2010, 35, 1719 CrossRef CAS.
- J. Zhang, Y. Tang, C. Song and J. Zhang, J. Power Sources, 2007, 172, 163 CrossRef CAS.
- S. D. Yang, C. M. Shen, X. J. Lu, H. Tong, J. J. Zhu, X. G. Zhang and H. J. Gao, Electrochim. Acta, 2012, 62, 242 CrossRef CAS.
- X. Cui, S. N. Wu, S. Jungwirth, Z. B. Chen, Z. H. Wang, L. Wang and Y. X. Li, Nanotechnology, 2013, 24, 765–771 Search PubMed.
- K. Gong, F. Du, Z. Xia, M. Durstock and L. Dai, Science, 2009, 323, 760 CrossRef CAS PubMed.
- L. Li, P. Dai, X. Gu, Y. Wang, L. Yan and X. Zhao, J. Mater. Chem. A, 2017, 5, 789 CAS.
- M. J. Amstrong and R. H. Muller, J. Electrochem. Soc., 1991, 138, 2303 CrossRef.
- O. Chène and D. Landolt, J. Appl. Electrochem., 1989, 19, 188 CrossRef.
- C. Rao and D. Trivedi, Coord. Chem. Rev., 2005, 249, 613 CrossRef CAS.
- D. Chen, P. Sun, H. Liu and J. Yang, J. Mater. Chem. A, 2017, 5, 4421, 10.1039/c6ta10476b.
- Y. Waseda, E. Matsubara and K. Shinoda, X-Ray diffraction crystallography, Springer, Heidelberg, Dordrecht, London, NewYork, 2011, ch. 4, p. 115, DOI:10.1007/978-3-642-16635-8.
- K. Sasaki, H. Naohara, Y. Cai, Y. M. Choi, P. Liu, M. B. Vukmirovic, J. X. Wang and R. R. Adzic, Angew. Chem., Int. Ed., 2010, 49, 8602 CrossRef CAS PubMed.
- A. Kuzume, E. Herrero and J. M. Feliu, J. Electroanal. Chem., 2007, 599, 333 CrossRef CAS.
- A. M. Gómez-Marín and J. M. Feliu, Catal. Today, 2015, 244, 172 CrossRef.
- Q. S. Chen, F. J. Vidal-Iglesias, J. Solla-Gullon, S. G. Sun and J. M. Feliu, Chem. Sci., 2012, 3, 136 RSC.
| This journal is © The Royal Society of Chemistry 2017 |

