 Open Access Article
Balancing structural distortions via competing 4f and itinerant interactions: a case of polymorphism in magnetocaloric HoCo2†
Y.
Mudryk
*a,
D.
Paudyal
a,
A. K.
Pathak
a,
V. K.
Pecharsky
ab and
K. A.
Gschneidner
Jr.
ab
aDivision of Materials Science and Engineering, Ames Laboratory of US DOE, Iowa State University, Ames, Iowa 50011-3020, USA. E-mail: slavkomk@ameslab.gov
bDepartment of Materials Science and Engineering, Iowa State University, Ames, Iowa 50011-2300, USA
First published on 13th April 2016
Abstract
The nature of multiple magnetostructural transformations in HoCo2 has been studied by employing magnetic and specific heat measurements, temperature and magnetic field dependent X-ray powder diffraction, and first-principles calculations. Unexpected increase of magnetization observed below the spin-reorientation temperature (TSR) suggests that the low-temperature transition involves a reduction of Co moment. First principles calculations confirm that the paramagnetic cubic to ferrimagnetic tetragonal transformation at TC is assisted by itinerant electron metamagnetism, and that the reduction of Co moment in HoCo2 occurs in parallel with the ferrimagnetic tetragonal to the nearly ferromagnetic orthorhombic transformation at TSRvia the rearrangement of both 3d states of Co and 5d states of Ho. The ac magnetic susceptibility measurements show significant magnetic frustration below TC. In contrast to earlier reports neither ac nor dc magnetic susceptibilities show anomalies in the paramagnetic region obeying the Curie–Weiss law.
Introduction
Among numerous compounds that undergo multiple phase transformations in response to varying temperature and/or magnetic field, an extended family of rare earth (R) – 3d transition metal (M) intermetallics continuously attracts research interest from both fundamental science and application perspectives. An in-depth understanding of the underlying science ultimately leads to practical applications, including permanent magnets,1,2 magnetostrictive devices and sensors,3 and magnetocaloric cooling4,5 to name a few. Often mysterious magnetism in some of these materials arises from a complex interplay between 4f and 5d electrons of lanthanides and 3d electrons of transition metal counterparts. Importantly, as was recognized long ago when relatively pure rare earth metals became available in research quantities,6 the physical properties of R–M compounds can be judiciously controlled by chemical modifications, thereby transforming them into an exciting playground for the investigation and better understanding of the ever elusive composition–structure–property relationships. As such, one may expect that binary R–M systems have already been broadly and thoroughly studied, yet this remains far from being true even for some of the simplest rare earth-transition metal intermetallics. One example is an unusual interplay between structure and magnetism of the low temperature orthorhombic phase in the simple Laves phase compound – HoCo2 – that was reported long ago,7,8 but its origin has not been fully understood to this day.The so-called Laves phases are one of the largest families known to exist among R–M compounds. Approximately 200 compounds with RM2 stoichiometry crystallize at room temperature in the three closely related C14 hexagonal MgZn2-type, C15 cubic MgCu2-type, and C36 hexagonal MgNi2-type structures.9 Many of RM2 compounds undergo structural distortions at low temperatures, which may or may not be coupled with magnetic ordering/reordering transformations. Depending upon the direction of the easy magnetization axis (EMA) that sets up at the magnetic transformation, cubic RM2 (M = Co or Ni) compounds with magnetic rare earths (R = Pr-Sm, Gd-Tm) may exhibit rhombohedral (for EMA 〈111〉), tetragonal (EMA 〈100〉), or orthorhombic (EMA 〈110〉) distortions.8,10–12 When M = Co the distortions can be either first (R = Dy, Ho, and Er) or second order (for other lanthanides) transitions.13
Physical behaviours of RCo2 compounds are characterized by the intrinsic instability of Co magnetic moment and by a rich array of phenomena that such instability provides.14 Considering its neighbours in the periodic table (Fe and Ni), Fe in RFe2 is always magnetic, while Ni remains non-magnetic in the corresponding isostructural RNi2 phases.14 Here, the nearly filled 3d band (3d9) of Ni is strongly hybridized with the 5d band of the rare earth metal, which effectively fills the 3d band quenching the magnetic moment of Ni. Magnetism of cobalt in RCo2 is, however, strongly dependent on a number of factors, either chemical (e.g. the nature of R element), or physical (applied pressure or magnetic field), or both; a similar instability is also present in RMn2 compounds, e.g. TbMn2,15 due to half-filled 3d shell of Mn. At ambient pressure and zero magnetic field the net Co moment varies from ∼1 μB in GdCo2 to zero in LuCo2 and YCo2.14 Application of very high magnetic field (up to 100 T) induces metamagnetism in non-magnetic YCo2 and LuCo2.16 Crystalline-electric fields (CEF)17,18 and magnetostructural coupling are strongly affecting both the magnetism and crystal structure of RCo2 compounds.
NdCo2 and HoCo2 occupy a special place among all RCo2 compounds because they undergo not one but two crystallographic transitions: first is the high temperature tetragonal distortion of the cubic structure at the magnetic ordering temperature, second is the low temperature orthorhombic deformation of the tetragonal structure at the spin-reorientation transition.7,8,19 HoCo2, however, is the only member of the series where the cubic–tetragonal transition is first-order in nature while the tetragonal–orthorhombic one is assumed to be second-order11,13 (both transitions in NdCo2 are second-order), although early measurements of the heat capacity of HoCo2 suggested that both transitions may be first-order.20,21
HoCo2 orders ferrimagnetically at TC = 76 K during cooling with EMA 〈100〉 and exhibits a narrow (∼2 K) thermal hysteresis around TC.20 The EMA changes to 〈110〉 at the spin-reorientation transition that, depending on the sample, occurs at TSR = 14–16 K.20,22 Both magnetic transitions are coupled with structural transformations, which are basically distortions of the original C15 cubic structure along the directions of EMA. Specific heat measurements confirm the presence of two distinct transitions in HoCo2.21,23 Two clearly defined peaks were observed in ac susceptibility, χac(T), of HoCo2 at TC and at TSR, and two additional minor anomalies (at ∼40 K and near TSR) are present as well.24 Bonilla et al.25 observed two major anomalies at TC and TSR plus a weak anomaly in the paramagnetic region at 126 K. Apparently, the χac(T) data are sample dependent even though the single-phase composition of HoCo2 alloys is claimed in nearly all published studies.
Spontaneous magnetization of HoCo2 crystal along 〈110〉 EMA is 7.7 μB per f.u. at 4.2 K.20 The holmium magnetization calculated in the same study is 9.3 μB per Ho leading to −0.8 μB per Co moment.20 Neutron diffraction and magnetization measurements performed on a HoCo2 sample with a higher TC = 87 K (indicating possible compositional deviation from the ideal stoichiometry) led to similar values of μHo = 9.5 μB and μCo = −1.0 μB.2659Co nuclear magnetic resonance study of HoCo2 gives a slightly lower cobalt moment of 0.84 μB per Co.27
It is believed that the cobalt magnetization is exchange induced by the lanthanides,14 and that their molecular field may lead to a non-zero value of Co moment in the paramagnetic state. In addition, spin fluctuations were observed and are strongly affecting electronic transport in the paramagnetic region above TC in all RCo2 compounds, including HoCo2.28 X-ray circular magnetic dichroism (XMCD) study of HoCo2 found that XMCD signals of both Ho and Co do not vanish above TC, confirming the existence of spin fluctuations.29 “Enhanced” Pauli susceptibility of Co sublattice, essentially temperature independent, was detected by polarized neutron diffraction in the paramagnetic region of HoCo2.30 The higher value of Co susceptibility (as compared to nonmagnetic YCo2) was explained by the presence of high molecular field of R atoms acting upon the Co atoms. At the same time the temperature evolution of the Co magnetic moment in ErCo2 single crystal measured using polarized neutron diffraction was found to be temperature dependent.31
It is worth to note that the presence of the Co net magnetic moment in the paramagnetic state is counterintuitive, but if one assumes such possibility, then the Co moment must be oriented antiparallel to the rare earth moment.14 The antiparallel alignment of R and Co magnetic sublattices in the paramagnetic phase was recently attributed to the occurrence of short-range correlations at T > TC.25,31–33 Observed in several RCo2 compounds, including HoCo2, this unusual magnetism was dubbed “parimagnetism”. Parimagnetism was explained in terms of Griffiths phase-like behaviour.25 In fact, the existence of two different paramagnetic phases, one immediately above TC and another one at T ≫ TC was reported in ref. 25. Recent theoretical calculations indicate that the interstitial impurities and antisite substitutions play a role in the formation of short-range ferromagnetic Co clusters in RCo2.34 With application of magnetic field these clustered Co atoms develop spin polarization leading to the observed parimagnetism.
Sharp changes in physical properties occur in HoCo2 at the first-order magnetostructural phase transition at TC.28,35–38 Latent heat and magnetovolume effect39 confirm that the first-order nature of this transition is related to the changes in the crystal lattice. Magnetic, electronic transport, and thermal properties of HoCo2 show that the TC is susceptible to changes of magnetic field and applied pressure (P):23,36–39TC increases with the increasing magnetic field, while hydrostatic pressure reduces TC because ferrimagnetic HoCo2 is the high volume phase.14,35,40 At p ∼ 3 GPa the transition becomes second-order and no change of TC is observed at higher pressures.36,38 The first-order nature of the transition in HoCo2 is preserved at least up to 5 T.39
The sensitivity of the first-order paramagnetic–ferrimagnetic transition to the applied magnetic field leads to several potentially useful effects in HoCo2 near TC, such as large magnetostriction, magnetoresistance, and giant magnetocaloric effect (GMCE). Spontaneous volume expansion ΔV/V of ∼ 4 × 10⁻³ at TC was reported.35 Magnetostriction constants, λ100 and λ111, are −2.2 × 10⁻³ and −0.5 × 10⁻³, respectively.10 Large magnetoresistance (−50%) was demonstrated above TC in HoCo2 single crystals oriented along [100], [111], [110] crystallographic directions.41 Large values of magnetic entropy (ΔSM) and adiabatic temperature (ΔTad.) change were obtained for HoCo2: for a magnetic field change from 0 to 8 T, ΔSM = −8 J mol−1 K−1 (−28.3 J kg−1 K−1) and ΔTad. = 10 K.23 Direct measurements of magnetocaloric effect in HoCo2 revealed ΔTad. = 5.1 K for 6 T magnetic field change at 82 K.42 Barocaloric effect was estimated theoretically and is expected to be similar in magnitude to the magnetocaloric one.43
While the physical behaviours of HoCo2 were extensively studied near the magnetic ordering transition, the region below TC remains less investigated. In particular, the origin of the structural transformation at TSR, which does not fit within the IEM model, and the unusual behaviour of lattice parameters and magnetization for the orthorhombic HoCo2 have emerged as interesting fundamental problems. Here, we report an in-depth investigation and analysis of these problems via both the experimental investigation of HoCo2 prepared using high-purity metals and the first-principles calculations employing experimentally determined near ground state crystallographic data.
Experimental techniques
Polycrystalline HoCo2 alloy (∼5 g) was arc-melted from the elements in an Ar atmosphere using high purity Ho metal prepared by the Materials Preparation Center at the Ames Laboratory of the U.S. Department of Energy;44 cobalt metal (Puratronic, 99.9+% purity) was purchased from Alfa Aesar. The Ho was at least 99.7 at% pure with respect to all elements in the Periodic Table. Synthesis of the HoCo2 compound using the stoichiometric quantities of Ho and Co resulted in the alloy containing a minor amount of the HoCo3 phase (sample I). The presence of the HoCo3 impurity could not influence the low-temperature X-ray diffraction (XRD) investigation of the material’s crystal structure but was detrimental to the physical property measurements. Therefore, an additional amount of Ho (3 wt%) was added during the second synthesis in order to compensate for the Ho loss from evaporation and to prevent the formation of the HoCo3 impurity phase. The alloy was melted and thoroughly mixed, then allowed to solidify, turned over, and re-melted again to ensure homogeneity; the button broke into several pieces during cooling after the second melting. After melting the alloy was sealed in a helium-filled quartz ampoule, heat-treated for 5 days at 900 °C, and quenched in water. The room temperature X-ray powder diffraction pattern indicated that the material is the single phase HoCo2 (sample II) crystallizing in the MgCu2-type structure with lattice parameter a = 7.1750(1) Å (Fig. S1, ESI†). Sample II phase purity was confirmed using backscatter scanning electron microscopy (Fig. S2, ESI†) and this sample was used in the physical property measurements.The temperature and magnetic field dependencies of dc magnetization and ac magnetic susceptibility were studied using Quantum Design Superconducting Quantum Interference Device (SQUID) magnetometer, model MPMS XL-7. The heat capacity was measured first using a semi-adiabatic heat pulse calorimeter45 in magnetic fields from 0 to 100 kOe; later the detailed study of the low-temperature heat capacity was performed using both 4He and 3He probes of the Quantum Design Physical Property Measurement System (PPMS).
The temperature and magnetic field dependent X-ray powder diffraction measurements were performed using the HoCo2 powder (sample I, particle size <25 μm, mixed with GE varnish) at temperatures ranging from 5 to 300 K and in magnetic fields between 0 and 40 kOe. The data were collected on a Rigaku TTRAX system with a rotating anode generating Mo Kα radiation. The range of measured 2θ angles was from 8 to 63 deg with a 0.01 deg step. Further details about sample preparation and experimental setup can be found in ref. 46.
Experimental results
Magnetic properties
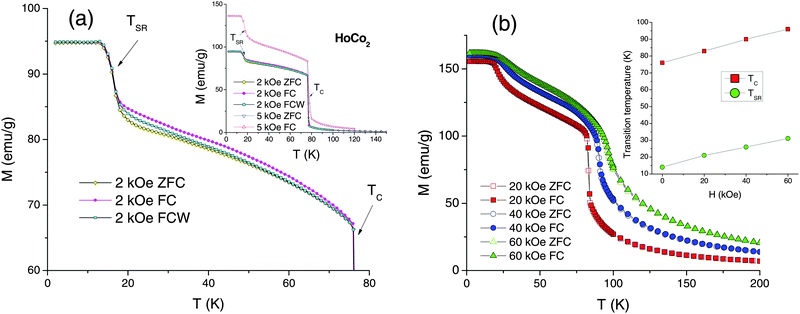
The dc magnetization, measured as a function of temperature, M(T), during warming of zero-field-cooled (ZFC) sample, in-field cooling (FC), and warming of in-field cooled sample (FCW) regimes in a H = 100 Oe applied magnetic field, shows a sharp first-order type magnetic ordering transition at TC = 76 K (Fig. 1). The spin-reorientation transition, manifested as a local maximum on the low-field M(T) curves and as a step on the high-field M(T) curves (see Fig. 2), occurs at TSR = 14 K. Contrary to the earlier report20 the transition at TC is non-hysteretic despite its distinct first-order nature. At the same time, substantial thermomagnetic irreversibility occurs at TSR < T < TC between all three (ZFC, FC, and FCW) measurements. Below TSR the FC and FCW curves coincide, while the ZFC magnetization is lower, most likely due to domain wall pinning (“freezing”) effect. The irreversibility at TSR < T < TC, however, is harder to explain by a trivial domain effect as FC and FCW dependencies significantly separate from each other above TSR; furthermore, there is an apparent crossover between FC and FCW curves in the region of the spin-reorientation transition. Such separation usually indicates sizeable magnetic frustrations in the system. Moreover, an additional magnetic anomaly is seen above TSR indicating that the thermal evolution of magnetic properties below TC in HoCo2 involves more than a single-step reorientation of EMA from 〈100〉 to 〈110〉 direction at TSR.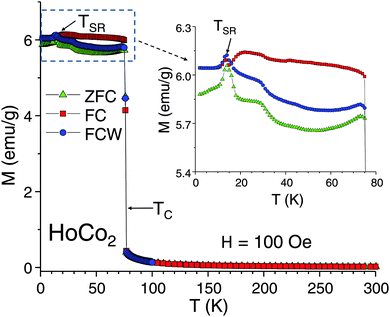 | ||
| Fig. 1 The low-field dc magnetization of HoCo2 measured as a function of temperature at H = 100 Oe. The inset magnifies the temperature range below 76 K where HoCo2 is magnetically ordered. | ||
Reciprocal magnetic susceptibility of HoCo2 measured in 100 Oe magnetic field shows that in the paramagnetic region HoCo2 follows the Curie–Weiss law (Fig. S3, ESI†). Minor but interesting differences between as cast and annealed samples are observed, even though the X-ray patterns of both samples are practically identical and indicate a single phase material. For the as cast sample, a weak negative deviation from linearity is seen in the TC < T < 150 K temperature range (Fig. S3a, ESI†), which agrees with the earlier reported magnetic anomaly.25 Heat-treatment completely removes this anomaly (Fig. S3b, ESI†). The important conclusion here is that the short-range order effects and/or the parimagnetism reported in ref. 25, 29 and 30 may not be intrinsic to HoCo2; they are indeed sample dependent, and the phase purity of materials plays a significant role.
The effective moment calculated from the Curie–Weiss law is 10.51 μB per f.u. – in good agreement with the calculated gJ[J(J + 1)]1/2 = 10.61 μB per Ho3+, and the Weiss temperature is 64 K, which is slightly lower than TC = 76 K.
The M(T) measurements preformed in magnetic fields 2, 5, 20, 40, and 60 kOe are shown in Fig. 2. Weak magnetic irreversibility between TSR and TC persists in 2 kOe applied field (Fig. 2a), but the magnetization becomes reversible at H ≥ 5 kOe (inset of Fig. 2a and b). The transition at TSR is clearly seen in high magnetic fields, including 60 kOe data, but minor M(T) anomalies observed in 100 Oe field (Fig. 1) are suppressed at 2 kOe and above. Magnetization jump at TSR is most pronounced in 1 kOe ≤ H ≤ 5 kOe magnetic fields. Both TSR and TC (defined as minima of dM/dT) increase with the application of magnetic field with dTC/dH = 0.33 K kOe−1 being slightly higher than dTSR/dH = 0.28 K kOe−1 (inset of Fig. 2b). The sharp first-order character of the magnetic ordering transition is notably suppressed by the magnetic field – the paramagnetic–ferrimagnetic (PM–FIM) transition at 60 kOe visually appears as a typical second-order phenomenon.
The magnetization as a function of applied magnetic field was measured at 5, 50, 80, and 100 K, see Fig. S4 (ESI†). No magnetic hysteresis/coercivity was observed in 5 K data indicating distinctively soft nature of polycrystalline HoCo2 at this temperature. The saturated magnetic moment obtained from extrapolation of M(H) data in M vs. 1/H plot is equal to 8.4 μB per f.u. Assuming that the holmium moment is equal to gJ = 10 μB per Ho3+ and considering antiparallel alignment of Ho and Co atoms, the Co moment is 0.8 μB per Co, which basically agrees with earlier reports.20,26,27 It is noted that all of the neutron diffraction studies reported Ho moment lower than 10 μB, generally ∼9.5 μB (the reduction of the Ho moment is probably due to CEF splitting), which means that the true Co moment in our HoCo2 at 5 K may be lower, i.e. ∼0.5–0.6 μB (this will be further discussed in the theory section). The M(H) isotherms at 50 and 100 K are characteristic for the ferrimagnetic and paramagnetic states, respectively. The observed reversible metamagnetic behaviour and magnetic hysteresis at 80 K are typical for the magnetic-field-induced PM–FIM magnetostructural transformation due to Co IEM behaviour which is set up by the emerging internal magnetic field of the Ho sublattice.
A sudden increase of magnetization observed during cooling of HoCo2 in moderate magnetic fields at TSR (Fig. 2a) is by itself an interesting yet rarely discussed phenomenon. It has been observed not only in HoCo2 but also in mixed rare-earth alloys like Ho0.7Y0.3Co2,47 and even though the size of this anomaly decreases with increasing magnetic field strength it is present in 60 kOe field as well (Fig. 2b). The possible explanations for such an increase are (1) a transition from a non-collinear (canted) magnetic structure of Ho sublattice to a collinear one at TSR; (2) strong texture present in polycrystalline HoCo2; (3) a decrease of Co moment caused by the changes in the electronic structure due to the structural distortion. The first hypothesis is unlikely because it assumes that Ho and Co moments are not antiparallel below TC (canted magnetic structure) meaning that there is a ferromagnetic component in the HoCo2. The second scenario is based on the study of the HoCo2 single crystal by Gignoux et al.,20 which shows that along the [110] direction the magnetization saturates quickly at 14.4 K (below TSR) but requires strong magnetic field on the order of ∼50 kOe for the saturation at 25 K (above TSR). The main caveat here is that there is no reason why the cubic HoCo2 should develop strong texture along [110] direction during solidification. Moreover, the results of the M(T) measurements performed using the HoCo2 powder (not shown) are similar to the results of the bulk sample measurements shown in the Fig. 2.
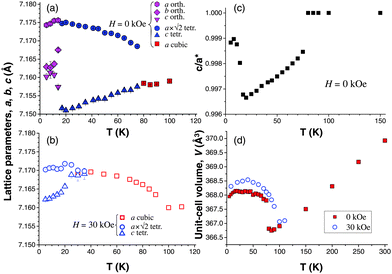
The third possibility suggests that Co moment changes as a result of cubic–tetragonal distortion in response to the change of lattice parameters and symmetry. The X-ray powder diffraction data (discussed in detail below) indicate (1) shallow but steady decrease of the unit-cell volume below TSR and (2) a tendency toward restoring the original cubic structure as the “c/a” ratio moves closer to 1 below TSR, see Fig. 8c, below. According to the pressure-dependent study by Burzo et al.,47 volume contraction in the magnetically ordered state leads to a smaller Co moment, which agrees with the fact that the increase in the net magnetization coincides with the decrease of the unit-cell volume at TSR. The change of the c/a ratio can also affect the magnetic moment.47 Our own theoretical investigation presented below clearly confirms that the structural transformation is the primary reason for the reduction of Co moment below TSR.
The AC susceptibility was employed to study magnetic anomalies reported above the magnetic ordering temperature (ref. 25) as well as those observed below the TC (seen in the low-field M(T) data of Fig. 1, and in the χAC(T) data of ref. 24,25). The χAC(T) measurements were performed at AC field frequencies f = 1, 100, and 1000 Hz (Fig. 3). The data show that: (1) there is a strong frequency dependence of the AC magnetic susceptibility in the magnetically ordered HoCo2, especially in the imaginary component; (2) there are no magnetic anomalies in the 1/χAC′ vs. T plot above TC; (3) regions where dχ′/df ≠ 0 alternate with regions where there is no frequency dependence. The strongest frequency dependence, which is commonly associated with sizeable magnetic frustrations and spin-glass-like behaviour, occurs between ∼25 and ∼65 K. Unlike χ′′, whose dependence upon f extends to all temperatures below TC, the dχ′/df = 0 near the magnetostructural transitions (TSR and TC). One can safely rule out the presence of spin-glass state in HoCo2 because the long-range magnetic order is well established below TC. One possible explanation is that because the magnetic structure with 〈100〉 EMA is not the stable ground state, energetically close magnetic structures (with EMA 〈100〉 and EMA 〈110〉) are competing with each other between TC and TSR until the ground state structure with EMA 〈110〉 is established at TSR. This means that the magnetic frustrations in HoCo2 originate from the random magnetic anisotropy effect most likely related to the single-ion random anisotropy48 of Ho moments. This effect is similar to frustrations caused by a competition between fourth-order anisotropy terms of Er and Dy in Er0.75Dy0.25Al249 and different from the one occurring in the amorphous random anisotropy magnets, such as NdGdFe thin films.50 The interesting question here is whether this frustration is related to the theoretically established competition between 4f and IEM magnetism (discussed below in the Theory section).
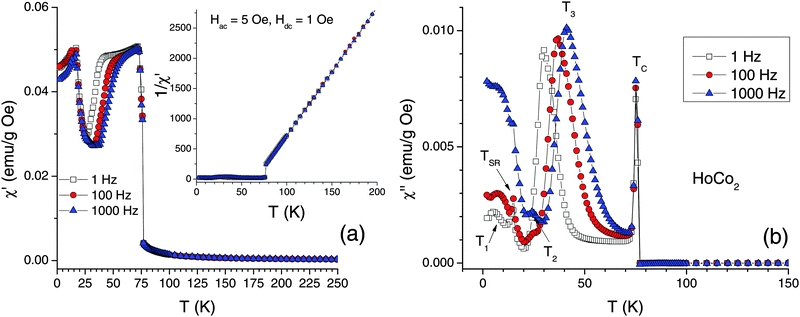 | ||
| Fig. 3 The AC magnetic susceptibility of HoCo2 measured as a function of temperature: (a) the real part (the inset shows the reciprocal susceptibility); (b) the imaginary part. | ||
Another interesting problem is the sudden loss of the frequency dependence in χ′(T) between the TSR and a local susceptibility minimum at ∼25 K. The energy losses reflected in χ′′(T) below TSR, especially for the high-frequency data, are associated with the domain-wall-pinning effects, which essentially disappear above TSR. It would be interesting to compare AC susceptibility behaviour of HoCo2 with that of other RCo2 systems (namely ErCo2 and DyCo2) that do not have the second structural transition at TSR, but have a first order transition at TC.
Heat capacity
The heat-capacity investigation was performed in the three separate experiments. At first, the heat capacity of a large bulk polycrystalline sample (∼1 g) was measured from 2 K to room temperature in magnetic fields ranging from 0 to 100 kOe using a semi-adiabatic calorimeter. The results of these measurements agree very well with those previously reported in ref. 23 and, therefore, are not shown here. In agreement with ref. 23 a sharp first-order type peak is observed in zero-field data at TC, and a second, much weaker anomaly occurs at TSR. No other anomalies are observed in this temperature range. Application of magnetic field progressively decreases the sharpness of the peak at the first-order transition. Compared to some other first-order transitions that remain almost as sharp at 100 kOe as at 0 kOe (e.g. some Gd5Ge4-based alloys, see Fig. 3 in ref. 51 and Fig. 9 in ref. 52), the magnetic ordering transition in HoCo2 gradually changes from clearly discontinuous at H = 0 kOe to nearly continuous in high magnetic fields. According to a previous calorimetric investigation39 the transition at TC in HoCo2 is first-order at 50 kOe, but higher magnetic fields were not studied. It is difficult to say unequivocally if the certain order (first or second) of the transition can be assigned to HoCo2 in a 100 kOe applied magnetic field. However, taking into account the influence of the magnetic field on the structural transition (see below), particularly the magnetic-field-induced suppression of the discontinuous volume change, we believe that at sufficiently high magnetic fields the nature of the order of the transformation in HoCo2 changes from first order to second order.The second series of measurements was performed in a Quantum Design PPMS using the standard heat-capacity option. The measurements were focused on the heat-capacity behaviour in the vicinity of TSR, because it has not been studied before in any detail. The zero-field heat capacity data show the λ-type specific heat anomaly at 16 K (Fig. 4), which generally agrees with the TSR = 14 K determined from magnetization measurements (Fig. 1). The application of magnetic field has little effect at H = 5 kOe, but at H ≥ 10 kOe the transition becomes significantly broader and moves towards higher temperatures. Considering all of the above, the transformation at TSR appears to be a second-order one.
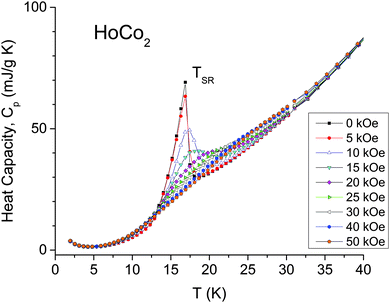 | ||
| Fig. 4 Temperature dependence of the heat capacity of HoCo2 in the vicinity of the spin-reorientation transition measured in magnetic fields ranging from 0 to 50 kOe. | ||
In addition to the anomaly at TSR, Fig. 4 shows a weak but clear upturn of Cp below ∼4 K, which arises due to a strong hyperfine field at the nuclei created by orbital and spin angular momenta of the lanthanide ions.53 Earlier studies reported that Pr, Tb and Ho metals show enhanced heat capacity at T < 2 K.54 Because a study of Cp at T < 2 K has not been performed for HoCo2, Cp was explored down to 0.4 K in magnetic fields up to 140 kOe using PPMS Quantum Design 3He option. Fig. 5 shows that Cp increases rapidly below 2 K and reaches ∼7370 mJ mol−1 K−1 at T = 0.4 K and H = 0 kOe, which is similar to pure Ho metal, 7000 mJ mol−1 K−1.54 For Cp measurement in 140 kOe field our lowest temperature was 0.8 K; the starting temperatures for measurements in intermediate magnetic fields were between 0.4 and 0.8 K. For the sake of consistency, Cp was fitted for the 0.8 ≤ T ≤ 2 K region as:
| Cp = γT + βT3 + CNT−2 | (1) |
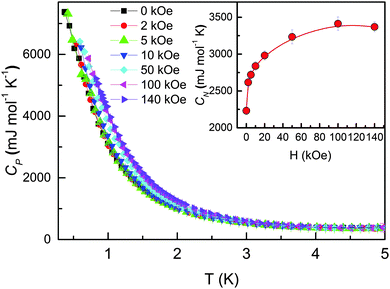 | ||
| Fig. 5 The heat capacity of HoCo2 measured below 5 K in various magnetic fields. Inset shows the nuclear specific heat coefficient CN [obtained from the fits of data for 0.8 K ≤ T ≤ 2 K to eqn (1)] as a function of magnetic field. | ||
X-ray powder diffraction
It is well-established that HoCo2 compound undergoes a first-order cubic-to-tetragonal transformation at TC, and then tetragonal-to-orthorhombic deformation at TSR, which appears to be the second-order transformation.7,8,11 This sequence of phase transitions was confirmed in our investigation and it agrees well with the magnetic and heat capacity measurements. The room temperature cubic lattice (space group Fd![[3 with combining macron]](https://www.rsc.org/images/entities/char_0033_0304.gif) m) transforms into the tetragonal one (I41/amd) at TC, which, in turn, becomes orthorhombic (Fddd) below TSR.
m) transforms into the tetragonal one (I41/amd) at TC, which, in turn, becomes orthorhombic (Fddd) below TSR.
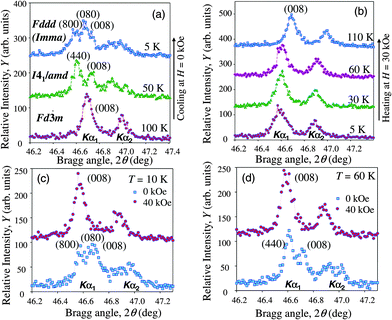
In addition to the full-profile Rietveld refinement that was performed for all collected patterns and used for lattice parameters calculation, we monitored the lattice deformations of Laves phase structures using selected high-angle Bragg peaks. In case of the tetragonal deformation, any of the cubic (00l) reflections can be used. Fig. 6a shows that the (008) Bragg peak of the cubic structure splits into the (440) and (008) peaks when cooled below the TC. Since the Bragg angle of the more intense peak (440) is lower than the Bragg angle of (008) peak, and according to the Rietveld refinement, the c lattice parameter contracts while the normalized to the non-distorted cubic structure values of the lattice parameters a = b expand compared to the parent cubic structure. Therefore, our data confirm the results of ref. 7 and 47, but disagree with ref. 8 and 11, who reported the expansion of the c-axis during the tetragonal deformation.
As the sample is cooled below TSR, the (440) peak of the tetragonal phase further splits into two peaks of nearly even intensity indicating a distortion in the ab-plane, which results in the orthorhombic crystal structure of HoCo2 as its ground state. The known challenge here is to determine the symmetry of this crystal structure because two space groups, Fddd and Imma, provide nearly identical quality of fit during the refinement of the orthorhombic crystal structure.19 The notable difference between the two models is that the structure within the Fddd space group has a single Co position, while the Imma crystal structure has two symmetrically independent Co atoms. An early Mössbauer study indicated multiple Co sites in HoCo2 below TSR56 but the sample in that study was prepared with a significant amount of 57Fe (its TC was 90 K) and it may not be used as a reliable reference point.
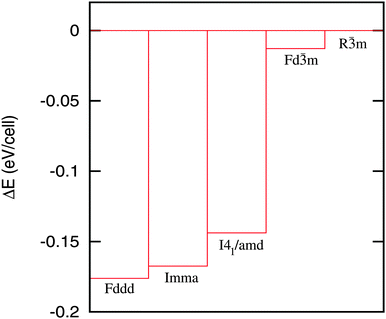
We performed first-principle calculations using both Fddd and Imma crystal structures (using crystallographic parameters determined at 10 K), and it was found that the Fddd structure has lower total energy compared to the Imma structure. Therefore, the former should be considered as a stable ground state of HoCo2. Thus, in our work we will use the Fddd model to represent the orthorhombic crystal structure of HoCo2. However, at this point there is no overwhelming experimental evidence to choose one structure over the other and given the small energy difference between Fddd and Imma configurations it is possible that small changes in composition (such as the use of low-purity holmium metal in the synthesis of HoCo2 or the addition of Fe) may lead to Imma structure being the stable crystal structure below TSR.
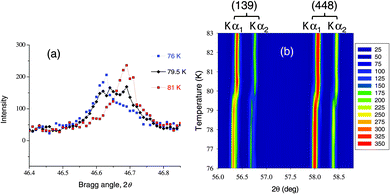
As seen in Fig. 1, the transition at TC is sharp with no thermal hysteresis. However, because it is a first-order transition a phase separated state is expected to exist at the transition, even if over a narrow range of temperatures. Since there are no prior reports of phase co-existence in RCo2 compounds during transitions at TC, a detailed X-ray powder diffraction study of the temperature range from 76 to 83 K was performed. Fig. 7 shows that we were able to observe a co-existence of both high and low-temperature phases at 79.5 K. This temperature is slightly different than the TC = 76 K value obtained from magnetic measurements, but such difference in transition temperature between bulk polycrystalline sample and a varnish-bonded powder sample is common, and was observed previously.49,57
The temperature dependence of the lattice parameters and the unit-cell volume is shown in Fig. 8 (determined with 5 K steps below 90 K). A comparison of the zero-field temperature dependence with the 30 kOe data shows substantial changes in the degree of structural distortion. There is a sharp volume discontinuity at TC at H = 0 caused by a rapid expansion of the lattice constants in the ab plane, while the c lattice constant follows the normal thermal contraction trend of the cubic phase. Essentially it means a rapid c/a contraction as ferrimagnetic order sets in with EMA oriented along the 〈100〉 direction. The change of the EMA to 〈110〉 at TSR brings, somewhat surprisingly, the value of the c lattice parameter closer to the values of the in-plane parameters – in fact, the value of the b-parameter is closer to the c-, than to the a-parameter. The c/a* ratio for the orthorhombic phase, where a* = √(a × b), sharply increases at TSR approaching unity. The change of lattice parameters at TSR is rapid but not discontinuous. Neither the unit-cell volume (Fig. 8d) nor the entropy (calculated from the heat-capacity data, Fig. S5, ESI†) show clear discontinuities at TSR, while both change discontinuously at TC, thus confirming the second-order type of the transition at TSR and the first-order type of the phase transition at TC.
Application of magnetic field significantly affects crystallographic behaviour of HoCo2. It is noted that the analysis of field-dependent X-ray powder diffraction measurements of magnetically anisotropic materials has quantitative limitations due to the fact that the powder particles may respond to magnetic field differently depending on their orientation with respect to the vector of applied magnetic field.57 However, qualitative changes brought by magnetic field can be analysed and valuable information about structural response to applied magnetic field can be obtained.
For example, the extent of crystallographic distortion is suppressed when magnetic field of H ≥ 30 kOe is applied to the system (compare Fig. 6a and b). The splitting of the (008) peak is no longer observed, although the peak shape is slightly different below and above the temperature of the structural transition. At lower temperatures (<30 K) the peak becomes broader and a better quality of Rietveld refinement fit is obtained when tetragonal model is used instead of cubic but the refinement of the orthorhombic model in 30 kOe field becomes unstable. This observation may explain why the magnetization step at TSR becomes weaker in high magnetic fields. The suppression of structural distortion is further evidenced when the magnetic field is applied isothermally, for example at 10 K (Fig. 6c) and 60 K (Fig. 6d). In both cases a single (008) Bragg peak is observed in 40 kOe field as opposed to the multiple peaks seen in a zero field.
The volume discontinuity at TC extends over a large temperature range and is smaller overall in H = 30 kOe compared to the one at H = 0 (Fig. 8). This observation corroborates the high-field magnetization (Fig. 2b) and heat-capacity data, which show diminishing first-order character of the magnetic ordering transition with the increasing magnetic field strength. It is reasonable to expect that the volume discontinuity at TC will completely disappear at a certain critical value of the applied magnetic field.
Theoretical investigations
The local spin density approximation including the onsite electron-correlation (LSDA+U)58 approach has been employed to investigate the electronic structure, magnetic properties, and magnetostructural transformations of HoCo2. Calculations have been performed using the scalar relativistic version of the LSDA+U method implemented in the tight binding linear muffin tin orbital (TB-LMTO)59 and full potential linear augmented plane wave (FP-LAPW)60 methods. The orbital dependent Coulomb and exchange interactions in LSDA+U remove the degeneracy, and the 4f states split into different energy locations as prescribed by the site symmetry of Ho and Co atoms, and the number of partially filled orbitals in both spin channels obeying the Hund’s spin and orbital rules in the Laves phase structures of HoCo2. Here, the spin orbit coupling of the 4f states (J = L + S, for Ho atoms) follows Hund’s rule. The calculations performed with different values of Hubbard U ranging from 1 eV to 7 eV indicate that with the higher values of the U, the occupied 4f states are shifted to the lower energy while the unoccupied 4f states are shifted to the higher energy, as expected. The k-space integrations have been performed with 16 × 16 × 16 Brillouin zone mesh, which was sufficient for the convergence of total energies, magnetic moments, and 4f and d splitting.In the paramagnetic (PM) state, localized Ho-4f moments are randomly oriented and the net moment is zero. Considering that the experimentally observed effective magnetic moment (10.5 μB per f.u., see Fig. S3, ESI†) is close to the expected gJ[J(J + 1)]1/2 = 10.61 μB of non-interacting Ho3+ ions and taking into account the itinerant character of Co 3d electrons, magnetic moments of Co ions are nearly negligible in the PM state. At TC, Ho sublattice orders magnetically via indirect 4f–5d–4f exchange interactions. As a result, the 5d PM DOS peak close to the Fermi level splits into the spin up and spin down DOS peaks (Fig. 9c) resulting in ∼0.3 eV Ho-5d exchange splitting and 0.29 μB Ho-5d magnetic moment. Consequently, the Ho-5d/Co-3d hybridization in both spin up and spin down states promotes 4f–3d exchange leading to antiparallel Ho-4f (3.97 μB) and Co-3d (−1.18 μB) spin moments and a substantial Co-3d exchange splitting (∼1.15 eV) (see Fig. 9a). This scenario is typical of an itinerant electron metamagnetic (IEM) transformation in which isotropic non-magnetic PM state with cubic structure may abruptly distort into anisotropic ferrimagnetic (FIM) state with a tetragonal structure.
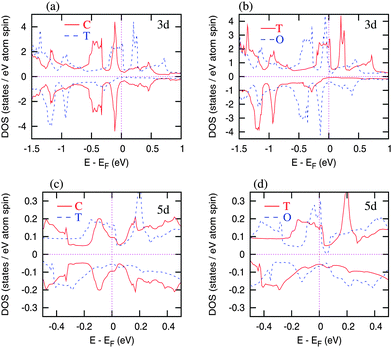 | ||
| Fig. 9 3d and 5d DOS for the cubic (C), tetragonal (T), and orthorhombic (O – Fddd) structures of HoCo2. | ||
Total energy landscape (Fig. 10) indicates FIM orthorhombic Fddd structure (with −0.07 μB Co magnetic moment) as the lowest energy (ground state) structure. The total energy of the FIM orthorhombic Imma structure (which has two split Co sites and −0.07/Co μB on the Co atoms) is higher by ∼4.5 meV per cell compared to the Fddd structure. Hence, the orthorhombic distortion in HoCo2 is not likely to be driven by the Co site splitting. The total energy of the FIM tetragonal structure is only slightly higher than that of both orthorhombic structures and substantially lower compared to PM cubic HoCo2. A substantial drop in the total energy during the PM cubic to the FIM tetragonal transformation and a minor reduction during the FIM tetragonal to FIM orthorhombic transformation are in line with experimentally observed discontinuous PM cubic to the FIM tetragonal and continuous FIM tetragonal to FIM orthorhombic transformations. Further, the exchange splitting of Co-3d states is weak in both orthorhombic (Fddd and Imma) structures leading to a small Co moment (−0.07 μB per Co) in contrast with a much larger Co moment (−1.15 μB per Co) obtained for the tetragonal structure. The diminishing Co moment is connected to the change of lattice parameters when the tetragonal structure transforms to the orthorhombic (Fig. 8). In the tetragonal structure the lattice parameter a increases while the lattice parameter c decreases (c/a < 1) following a sharp basal plane expansion at TC. At the tetragonal to orthorhombic transition (at TSR) the lattice parameters of the emergent orthorhombic structure change in such a way that the lattice distortion is reduced (the values of c and a and b lattice parameters become closer to one another) essentially approaching the parent cubic structure as the temperature approaches zero.
The Hund’s rule Ho-4f moment in both the orthorhombic and the tetragonal structures is 10 μB per Ho (4 μB per Ho contributed from 4f spins and 6 μB per Ho from 4f orbitals). The experimentally observed total moment is 8.4 μB per f.u. in the orthorhombic structure where the Co moment is nearly diminished. The decrease in Ho 4f moment is due to the 4f splitting (shown in Fig. 11), which is caused by the crystalline environment (tetrahedral arrangement) of Ho atoms in the C15 structure, and leads to the partial quenching of 4f orbital moment in this compound. Essentially, Ho moment is affected by the crystalline electric field splitting as has been shown before.17,18,20 The spin up 4f states split into three energy locations and the 4f spin down states, both occupied and unoccupied, each are split into two energy locations. These split states rigidly move towards the high energies in the orthorhombic structure compared to the tetragonal structure. Consequently, the spin up Co-3d DOS shifts to the lower energy and the spin down Co-3d DOS shifts to the higher energy (Fig. 9b) resulting in almost negligible Co-3d exchange splitting that gives rise to just −0.07 μB Co moment in the orthorhombic HoCo2. The Ho-5d DOS features also get rearranged (Fig. 9d) and the spin polarized 5d moment in the orthorhombic symmetry is reduced to 0.1 μB per Ho. This indicates that the 4f–4f and 4f–5d interactions are weaker in the orthorhombic structure, leading to the reduced 4f–3d interactions, and, consequently, to smaller Co moment below TSR. Since there is a reduction of Co moment in the orthorhombic structure, the total magnetic moment of HoCo2 with this structure is higher compared to the tetragonal structure (in which Ho and Co moments are antiparallel) as is observed experimentally (Fig. 2). The reduced but not extinct 5d moment (from 4f–5d interaction) still holds the Ho moments ferromagnetically aligned. Furthermore, with no significant Co magnetic moment, the IEM state (i.e., the FIM tetragonal structure) becomes unstable, and the system adopts a different structure (orthorhombic), where Ho becomes the primary source of magnetism.
Interestingly, a closely related Laves phase compound formed with non-magnetic aluminum instead of Co, i.e. HoAl2, has FM orthorhombic (Fddd) ground state. HoAl2 exhibits a magnetic only transition (PM cubic to FM cubic) at ∼28 K and then undergoes a first order spin reorientation transformation during the orthorhombic (Fddd) distortion below ∼20 K. This structural anomaly is due to exchange splitting (∼0.25 eV) opposed by the crystal field energy (∼0.32 eV) of Ho-5d.61 On the other hand, as noted above, HoCo2 practically loses Co magnetic moment in the orthorhombic ground state and the FIM (nearly FM) state here is due to the 4f–4f exchange mediated by the 4f–5d interactions. The Ho-5d DOS in HoCo2 does not show crystal field splitting that was significant in HoAl2. Even though in the rare earth Laves phase compounds the underlying mechanisms for the low temperature magnetism and magnetostructural transformations may be different, they remain primarily driven by the magnetism of the R atoms.
Conclusions
Detailed experimental and first-principles study of HoCo2 explains the unusual low-temperature polymorphic transformation in terms of competition between the itinerant ferrimagnetic and the low-temperature state, where the Co magnetism is diminished, and both the magnetic and crystal structures are mainly defined by the magnetism of Ho. Three crystal structures, each associated with a distinctly different magnetic state of the compound, exist in three different temperature regions: (1) the high-temperature cubic structure, associated with the paramagnetic state, (2) the intermediate temperature tetragonal phase with the previously established IEM ferrimagnetic order, and (3) the low-temperature orthorhombic phase with the dominant ferromagnetism of Ho sub-lattice and the much reduced Co magnetism. First-principles calculations show that the ground state orthorhombic structure is expected to adopt the Fddd space group.The title compound responds strongly to the varying external magnetic field, including suppression of the structural distortions both at TC and TSR, limiting the stability region of the tetragonal HoCo2, changing the nature of the transition at TC from first order to second, and the enhancement of the low-temperature Schottky anomaly, possibly, via the field-induced modification of low-temperature crystal structure. The rapid increase of HoCo2 heat capacity below 1 K makes it a promising passive regenerator material for the ultra-low temperature cryocooler applications.
Acknowledgements
The Ames Laboratory is operated for the U. S. Department of Energy by Iowa State University of Science and Technology under contract No. DE-AC02-07CH11358. This work was supported by the Department of Energy, Office of Basic Energy Sciences, Materials Sciences Division. The authors thank Mr Prathamesh Patil for taking SEM images.References
- M. Sagawa, et al. , IEEE Trans. Magn., 1984, 20, 1584 CrossRef CAS; J. F. Herbst, Rev. Mod. Phys., 1991, 63, 819 CrossRef; R. Skomski and J. M. D. Coey, Phys. Rev. B, 1993, 48, 15812 CrossRef.
- K. H. J. Buschow, P. A. Naastepad and F. F. Westendorp, J. Appl. Phys., 1969, 40, 4029 CrossRef CAS.
- N. C. Koon, C. M. Williams and B. N. Das, J. Magn. Magn. Mater., 1991, 100, 173 CrossRef CAS; A. E. Clark and H. S. Belson, Phys. Rev. B, 1972, 5, 3642 CrossRef.
- O. Gutfliesch, M. A. Willard, E. Bruck, C. H. Chen, S. G. Shankar and J. P. Liu, Adv. Mater., 2011, 23, 821 CrossRef PubMed.
- V. K. Pecharsky, K. A. Gschneidner, Jr., Y. Mudryk and D. Paudyal, J. Magn. Magn. Mater., 2009, 321, 3541 CrossRef CAS.
- F. H. Spedding and A. H. Daane, J. Metals, 1954, 6, 504 CAS.
- E. Gratz, Solid State Commun., 1983, 48, 825 CrossRef CAS.
- A. S. Markosyan, Soviet Physics – Solid State, 1981, 23, 965 Search PubMed.
- K. A. Gschneidner, Jr. and V. K. Pecharsky, Z. Kristallogr., 2006, 221, 375 Search PubMed.
- V. V. Aleksandryan, R. Z. Levitin, A. S. Markosyan, V. V. Snegirev and A. D. Shchurova, Soviet Physics – JETP, 1987, 65, 502 Search PubMed.
- R. Z. Levitin and A. S. Markosyan, J. Magn. Magn. Mater., 1990, 84, 247 CrossRef CAS.
- E. Gratz, A. Lindbaum, A. S. Markosyan, H. Mueller and A. Yu. Sokolov, J. Phys.: Condens. Matter, 1994, 6, 6699 CrossRef CAS.
- S. Khmelevskyi and P. Mohn, J. Phys.: Condens. Matter, 2000, 12, 9453 CrossRef CAS.
- H. R. Kirchmayr and C. A. Poldy, J. Magn. Magn. Mater., 1978, 8, 1 CrossRef CAS.
- P. J. Brown, B. Ouladdiaf, R. Ballou, J. Deportes and A. S. Markosyan, J. Phys.: Condens. Matter, 1992, 4, 1103 CrossRef CAS.
- T. Goto, T. Sakakibara, K. Murata, H. Komatsu and K. Fukamichi, J. Magn. Magn. Mater., 1990, 90, 700 CrossRef.
- A. Castets, D. Gignoux and B. Hennion, J. Magn. Magn. Mater., 1980, 15–18, 375 CrossRef CAS.
- E. W. Lee and P. Hendy, Physica, 1977, 86–88B, 163 Search PubMed.
- Y. G. Xiao, Q. Huang, Z. W. Ouyang, J. W. Lynn, J. K. Liang and G. H. Rao, J. Alloys Compd., 2006, 420, 29 CrossRef CAS.
- D. Gignoux, F. Givord and R. Lemaire, Phys. Rev. B, 1975, 12, 3878 CrossRef CAS.
- J. Voiron, A. Berton and J. Chaussy, Phys. Lett., 1974, 50A, 17 CrossRef CAS.
- G. Aubert, D. Gignoux, F. Givord, R. Lemaire and B. Michelutti, Solid State Commun., 1978, 25, 85 CrossRef CAS.
- V. Sechovsky, D. Vasylyev and J. Prokleska, Z. Naturforsch., 2007, 62b, 965 Search PubMed.
- T. D. Cuong, L. Havela, V. Sechovsky, A. V. Andreev, Z. Arnold, J. Kamarad and N. H. Duc, J. Alloys Compd., 1997, 262–263, 141 CrossRef CAS.
- C. M. Bonilla, J. Herrero-Albillos, A. I. Figueroa, C. Castan-Guerrero, J. Bartolome, I. Calvo-Almazan, D. Schmitz, E. Weschke, L. M. Garcia and F. Bartolome, J. Phys.: Condens. Matter, 2014, 26, 156001 CrossRef CAS PubMed.
- R. M. Moon, W. C. Koehler and J. Farrell, J. Appl. Phys., 1965, 36, 978 CrossRef CAS.
- M. Rubinstein, P. Lubitz and N. C. Koon, J. Magn. Magn. Mater., 1981, 24, 288 CrossRef CAS.
- E. Gratz, R. Resel, A. T. Burkov, E. Bauer, A. S. Markosyan and A. Galatanu, J. Phys.: Condens. Matter, 1995, 7, 6687 CrossRef CAS.
- F. Garcia, L. C. Sampaio, A. Y. Takeuchi, H. Tolentino and A. Fontaine, J. Appl. Phys., 2000, 87, 5881 CrossRef CAS.
- D. Gignoux, F. Givord and W. C. Koehler, Physica, 1977, 86–88B, 165 Search PubMed.
- F. Bartolome, C. M. Bonilla, J. Herrero-Albillos, I. Calvo-Almazan, C. Castan, E. Weschke, D. Schmitz, D. Paudyal, Y. Mudryk, V. Pecharsky, K. A. Gschneidner, Jr., A. Stunault and L. M. Garcia, Eur. Phys. J. B, 2013, 86, 489 CrossRef.
- J. Herrero-Albillos, F. Bartolome, L. M. Garcia, A. T. Young, T. Funk, J. Campo and G. J. Cuello, Phys. Rev. B, 2007, 76, 094409 CrossRef.
- C. M. Bonilla, I. Calvo, J. Herrero-Albillos, A. I. Figueroa, C. Castan-Guerrero, J. Bartolome, J. A. Rodriguez-Velamazan, D. Schmitz, E. Weschke, D. Paudyal, V. K. Pecharsky, K. A. Gschneidner, Jr., F. Bartolome and L. M. Garcia, J. Appl. Phys., 2012, 111, 07E315 CrossRef.
- C. M. Bonilla, D. Paudyal, J. Herrero-Albillos, V. K. Pecharsky, K. A. Gschneidner, Jr., L. M. Garcia and F. Bartolome, IEEE Trans. Magn., 2014, 50, 1700204 CrossRef.
- W. Steiner, E. Gratz, H. Ortbauer and H. W. Camen, J. Phys. F: Met. Phys., 1978, 8, 1525 CrossRef CAS.
- O. Syshchenko, T. Fujita, V. Sechovsky, M. Divis and H. Fujii, J. Alloys Compd., 2001, 317–318, 438 CrossRef CAS.
- R. Hauser, E. Bauer and E. Gratz, Phys. Rev. B, 1998, 57, 2904 CrossRef CAS.
- O. Syshchenko, V. Sechovsky, M. Divis, T. Fujita, R. Hauser and H. Fujii, J. Appl. Phys., 2001, 89, 7323 CrossRef CAS.
- J. Herrero-Albillos, F. Bartolome, L. M. Garcia, F. Casanova, A. Labarta and X. Batlle, Phys. Rev. B, 2006, 73, 134410 CrossRef.
- E. W. Lee and F. Pourarian, Phys. Status Solidi A, 1976, 33, 483 CrossRef CAS.
- N. V. Baranov and A. I. Kozlov, J. Alloys Compd., 1992, 190, 83 CrossRef CAS.
- S. A. Nikitin and A. M. Tishin, Cryogenics, 1991, 31, 166 CrossRef CAS.
- N. A. de Oliveira, J. Phys.: Condens. Mater, 2008, 20, 175209 CrossRef.
- Materials Preparation Center, Ames Laboratory of US DOE, Ames, IA, USA, http://www.mpc.ameslab.gov.
- V. K. Pecharsky, J. O. Moorman and K. A. Gschneidner, Jr., Rev. Sci. Instrum., 1997, 68, 4196 CrossRef CAS.
- A. P. Holm, V. K. Pecharsky, K. A. Gschneidner, Jr., R. Rink and M. N. Jirmanus, Rev. Sci. Instrum., 2004, 75, 1081 CrossRef CAS.
- E. Burzo, P. Vlaic, D. P. Kozlenko, S. E. Kichanov, N. T. Dang, A. V. Rutkauskas and B. N. Savenko, J. Alloys Compd., 2014, 584, 393 CrossRef CAS.
- E. M. Chudnovsky, W. M. Saslow and R. A. Serota, Phys. Rev. B, 1986, 33, 251 CrossRef.
- R. Nirmala, Y. Mudryk, V. K. Pecharsky and K. A. Gschneidner, Jr., Phys. Rev. B, 2007, 76, 014407 CrossRef.
- T. Saito and K. Hanashima, J. Magn. Magn. Mater., 2007, 310, 1540 CrossRef CAS.
- A. S. Chernyshov, Y. Mudryk, D. Paudyal, V. K. Pecharsky, K. A. Gschneidner, Jr., D. L. Schlagel and T. A. Lograsso, Phys. Rev. B, 2009, 80, 184416 CrossRef.
- K. A. Gschneidner, Jr. and V. K. Pecharsky, Mater. Sci. Eng., 2000, A287, 301 CrossRef.
- L. J. Sundström, in Handbook on the Physics and Chemistry of Rare Earths, ed. K. A. Gschneider, Jr. and L. Eyring, 1978, ch. 5, vol. 1, p. 379 Search PubMed.
- O. V. Lounasmaa, Phys. Rev., 1964, 133, A211 CrossRef CAS; O. V. Lounasmaa, Phys. Rev., 1962, 128, 622 CrossRef; O. V. Lounasmaa, Phys. Rev., 1963, 129, 2460 CrossRef; O. V. Lounasmaa, Phys. Rev., 1962, 128, 1136 CrossRef.
- A. K. Pathak, D. Paudyal, Y. Mudryk, K. A. Gschneidner, Jr. and V. K. Pecharsky, Phys. Rev. Lett., 2013, 110, 186405 CrossRef PubMed.
- U. Atzmony, M. P. Dariel and G. Dublon, Phys. Rev. B, 1976, 14, 3713 CrossRef CAS.
- M. Zou, Y. Mudryk, V. K. Pecharsky, K. A. Gschneidner, Jr., D. L. Schlagel and T. A. Lograsso, Phys. Rev. B, 2007, 75, 024418 CrossRef.
- V. I. Anisimov, F. Aryasetiawan and A. I. Lichtenstein, J. Phys.: Condens. Matter, 1997, 9, 767 CrossRef CAS.
- O. K. Andersen and O. Jepsen, Phys. Rev. Lett., 1984, 53, 2571 CrossRef CAS.
- P. Blaha, K. Schwarz, G. Madsen, D. Kvasnicka and J. Luitz, WIEN2k, An Augmented Plane Wave+Local Orbitals Program for Calculating Crystal Properties, Karlheinz Schwarz, Techn. Universität Wien, Austria, 2001, ISBN 3-9501031-1-2 Search PubMed.
- D. Paudyal, A. K. Pathak, V. K. Pecharsky and K. A. Gschneidner, Jr., J. Phys.: Condens. Matter, 2013, 25, 396002 CrossRef PubMed.
Footnote |
| † Electronic supplementary information (ESI) available: Includes analysis of sample purity and basic magnetic characterization data. See DOI: 10.1039/c6tc00867d |
| This journal is © The Royal Society of Chemistry 2016 |

