
 Open Access Article
 This Open Access Article is licensed under a Creative Commons Attribution-Non Commercial 3.0 Unported Licence
Silver-induced reconstruction of an adeninate-based metal–organic framework for encapsulation of luminescent adenine-stabilized silver clusters†
Dries
Jonckheere
a,
Eduardo
Coutino-Gonzalez
b,
Wouter
Baekelant
b,
Bart
Bueken
a,
Helge
Reinsch‡
a,
Ivo
Stassen
a,
Oliver
Fenwick§
c,
Fanny
Richard
c,
Paolo
Samorì
c,
Rob
Ameloot
a,
Johan
Hofkens
b,
Maarten B. J.
Roeffaers
*a and
Dirk E.
De Vos
*a
aKU Leuven, Leuven Chem&Tech: Centre for Surface Chemistry and Catalysis (COK), Celestijnenlaan 200F post box 2461, 3001 Leuven, Belgium. E-mail: maarten.roeffaers@biw.kuleuven.be; dirk.devos@biw.kuleuven.be
bKU Leuven, Leuven Chem&Tech: Molecular Imaging and Photonics (MIP), Celestijnenlaan 200F post box 2404, 3001 Leuven, Belgium
cISIS & icFRC, Université de Strasbourg & CNRS, 8 allée Gaspard Monge, 67000 Strasbourg, France
First published on 29th March 2016
Abstract
Bright luminescent silver-adenine species were successfully stabilized in the pores of the MOF-69A (zinc biphenyldicarboxylate) metal–organic framework, starting from the intrinsically blue luminescent bio-MOF-1 (zinc adeninate 4,4′-biphenyldicarboxylate). Bio-MOF-1 is transformed to the MOF-69A framework by selectively leaching structural adenine linkers from the original framework using silver nitrate solutions in aqueous ethanol. Simultaneously, bright blue-green luminescent silver-adenine clusters are formed inside the pores of the recrystallized MOF-69A matrix in high local concentrations. The structural transition and concurrent changes in optical properties were characterized using a range of structural, physicochemical and spectroscopic techniques (steady-state and time-resolved luminescence, quantum yield determination, fluorescence microscopy). The presented results open new avenues for exploring the use of MOFs containing luminescent silver clusters for solid-state lighting and sensor applications.
Introduction
The electronic and optical properties of silver are heavily influenced by the number of silver atoms in the aggregate, ranging from single ions, over clusters of a few atoms and larger nanoparticles, to the bulk material.1 The typical band structure of bulk silver with freely moving electrons results in good electrical conduction and ensures reflective optical properties. Reducing the physical size of silver to nanoparticles considerably alters its catalytic, chemical, electrical, optical and magnetic properties, which are all size and shape dependent.2 For instance, the collective light-responsive oscillation of the conduction band electrons, known as surface plasmon resonance (SPR), endows silver nanoparticles with bright colours.3 Sub-nanometre sized silver clusters exhibit an electronic structure fragmented into discrete energy levels. Clusters of a few to up to ten silver atoms have a size in the range of the Fermi wavelength of electrons, which is approximately 0.5 nm for silver. These discrete energy levels allow molecular-like electronic transitions stimulated by light, generally in the UV-vis region with subsequent luminescence.1 Because of these discrete energy levels and luminescence, small metal clusters are of considerable importance as their electronic behaviour and properties bridge ionic and nanoparticle/metallic behaviour.1,3–6 Their luminescent properties enable interesting applications, e.g. as fluorescent markers for biological imaging2 or secondary light sources in fluorescent lamps.7 Beside their luminescent properties, these silver nanoclusters also feature unique catalytic properties.8,9 The catalytic properties of such low-atomicity metal clusters are enhanced compared to metal nanoparticles because more atoms are exposed and available for adsorption and catalysis.10The inherent tendency of small metal clusters to aggregate to non-luminescent metallic silver nanostructures and nanoparticles has led to the development of strategies to stabilize them. The two most popular strategies are (i) to exploit the large affinity of silver for nitrogen-containing DNA bases in short single stranded oligonucleotides (ssDNA) and to subsequently reduce the silver ions with NaBH4,11–17 and (ii) the use of microporous host materials allowing confinement of the clusters, e.g. in the sodalite cages of zeolites. In the latter case, the reduction is performed either thermally or by UV or X-ray irradiation.7,18–25 Other, less frequently used stabilizing materials employed for luminescent silver cluster entrapment are cryogenic noble gas matrices,26,27 inorganic glasses,28,29 silver oxide films13 and dendrimers.30
Another class of porous materials called metal–organic frameworks (MOFs) has emerged recently as suitable hosts for the stabilization of luminescent silver clusters.31 The confinement approach in microporous materials (MOFs and zeolites) limits the cluster size to the pore/cage size of the material, i.e. one nanometer or less. MOFs consist of metal ion nodes and multitopic organic linkers which assemble into porous, three-dimensional architectures. Because of their high surface area and highly functionalisable porous structure,32–34 research on MOFs has strongly expanded35 with the discovery of many new structures and more recently the search for innovative applications.32,34,36 These comprise gas storage37 and separations,38 liquid phase separations of hydrocarbons and key molecules39–41 for (bio-)chemical industry, catalysis,42–46 inherent framework luminescence for sensing47–49 and drug delivery,50 among others.
MOFs are also known to stabilize luminescent species, like CdSe quantum dots.51 However, so far, the luminescence of oligo-atomic silver clusters confined in metal–organic frameworks has not yet been studied. In this paper, the large affinity of ionic silver for adenine and the rigid confining scaffold of a MOF framework are exploited to stabilize luminescent silver-adenine clusters in MOF pores. Our approach differs from previous studies in which only non-luminescent metal nanoparticles31,52–56 and metallic microstructures57 have been reported.
Results and discussion
Exploration of water-stable MOFs and selecting nucleobase MOFs
Aqueous conditions are preferred for loading silver ions onto porous materials like MOFs, since water is an excellent solvent for most ionic silver sources like silver nitrate. Among the large number of MOF structures, only few are truly water stable. The best known water-stable MOFs are zirconium-based (e.g. UiO-66, MIL-140C and MOF-808) with strong hydrolysis-resistant Zr-carboxylate bonds. Other water-stable MOFs are aluminium-based (e.g. MIL-53, MIL-68 and MIL-96) and the zinc-imidazolate, zeolitic ZIF-8 framework.Typical reducing treatments for generating silver clusters are chemical reduction with NaBH4 or H2, thermal activation or reduction by electromagnetic radiation (gamma rays, X-rays and UV light). Thermal reduction as performed in zeolites is not suitable for MOFs, since in general the thermal stability of MOFs is limited to 300–400 °C, with only few exceptions (e.g. UiO-66, MIL-140). Therefore, we attempted to create luminescent silver clusters by introducing silver ions from mixtures of water and ethanol to generate a mildly reducing environment. However, during the preliminary screening, these conditions did not result in the formation of luminescent silver clusters on any of the tested materials. Even thermal treatments at 300–450 °C, as for zeolites,19 of silver-loaded and thermally stable materials (e.g. UiO-66 or MIL-140C) yielded no luminescent silver clusters. Therefore, our attention turned towards another group of potentially water stable MOFs, namely the bio-MOFs. These materials contain the DNA nucleobase adenine as one of the linkers in the framework, in combination with dicarboxylates50,58–64 or tricarboxylates,65,66 and various metal ions (Zn2+, Co2+ and Cu2+). Of the wide range of adenine-containing MOFs,67–72 only bio-MOF-14 and bio-MOF-1 have confirmed water stability.50,59
Exploratory experiments with the nucleobase-containing framework bio-MOF-1 resulted in immediate formation of a luminescent silver phase when the material was loaded with silver using AgNO3 solutions with intermediate ethanol–water ratios. This result sharply contrasts to all other water-stable MOFs and the related ZJU-48 (a Zn adeninate 4,4′-trans-stilbenedicarboxylate), tested under the same circumstances. A detailed description of the structure of the two tested adeninate MOF structures, bio-MOF-150 and ZJU-48,61 is given in Fig. S1 (ESI†). Basically, in these structures adenine occupies the major part of the coordination sphere of Zn2+, while the carboxylates are used to space the zinc-adeninate building units. This results in adenine moieties at well-defined positions at the corners of large square, one-dimensional pores with a diameter of about 1 nm. The pore walls consist of the organic carboxylate linkers. An important property of bio-MOF-1 is cation exchange capacity.50,61 Typically, N,N-dimethyl ammonium (DMA+), a by-product of the DMF synthesis resides in the pores of bio-MOF-1 for charge compensation. This DMA+ can be exchanged for many other organic50,62,73,74 or inorganic75–77 cations. In principle, this ion exchange should also be possible with silver ions. Stabilization of formed cationic or metallic luminescent silver clusters in this case would therefore be enabled by two possible mechanisms: (i) interaction of silver, either in its ionic or in partially reduced state with adenine, or (ii) ionic interactions stabilize these cationic silver clusters in the anionic framework, as in the case of silver-containing zeolites.
Structural transformation of bio-MOF-1 to MOF-69A
Even though bio-MOF-1 is stable in pure water, its structure fully degrades when exposed to aqueous solutions of silver nitrate (40 mM) at a 1–1 ratio of silver to adenine. Bio-MOF-1 is transformed into another crystalline material, as evidenced by the X-ray diffraction pattern in Fig. 1a. In contrast, ZJU-48 undergoes a transformation to a nonporous, poorly crystalline silver adeninate phase upon contact with silver ions as shown in Fig. S2 (ESI†). This instability of both adeninate MOFs is most likely due to the strong interactions between silver ions and the nitrogen atoms of the adeninate linkers. PXRD patterns of bio-MOF-1 samples with silver–adenine ratios lower than 1 contain the original reflections of bio-MOF-1 but also new emerging reflections, originating from the transformed phase, as shown in Fig. S3 (ESI†). These strong interactions can be understood in the light of the Pearson hard/soft acid/base (HSAB) theory,78 which states that a soft Lewis acid (e.g. Ag+) will preferably interact with bases of an intermediately soft nature (e.g. adeninate) rather than with hard bases (e.g. carboxylates). The new crystalline phase that remains after the transformation of bio-MOF-1 could either be a crystalline framework built from silver and adenine, or from the two other building blocks of bio-MOF-1, viz. Zn2+ and 4,4′-BPDA. | ||
| Fig. 1 (a) Powder X-ray diffractograms: (1) theoretical pattern of bio-MOF-1, (2) as synthesized bio-MOF-1, (3) bio-MOF-1 after Ag-induced structural transformation, and (4) theoretical MOF-69A pattern; (b) Pawley fit of the MOF-69A material obtained by Ag-induced transformation of bio-MOF-1; (c) calculated cell parameters and literature values for MOF-69A. | ||
It seems unlikely that the newly formed crystalline phase is a silver-adeninate, since the gel formed from an equimolar aqueous mixture of silver nitrate and adenine has PXRD reflections above 10° 2θ after drying. The resulting pattern is very different from the diffractogram obtained for the silver- transformed bio-MOF-1. Therefore, more plausible candidate structures for the new crystalline phase are zinc carboxylates like IRMOF-10, the 4,4′-BPDA isostructural form of MOF-5, or MOF-69A,79 the 4,4′-BPDA isostructural form of MOF-69C. The latter material contains rods of tetrahedral and octahedral Zn2+ ions interconnected with a dicarboxylic acid to form unidimensional diamond-shaped channels. Since it is known that MOF-5 converts to MOF-69C in excess of water,80,81 MOF-69A seems to be the most likely structure of these Zn2+-carboxylate frameworks. To investigate this, a Pawley refinement of the experimental diffraction pattern of the transformed phase was undertaken in the monoclinic space group, with cell parameters corresponding to those of MOF-69A.79 Overall, a good fit to the data is obtained (Rwp = 5.83%; GoF = 3.67), as shown in Fig. 1b. The deviation of non-matching intensities compared to literature values can be explained by the presence of residual silver-adenine guests in the silver-transformed bio-MOF-1 material, which distorts the MOF-69A host framework. For the sake of comparison, attempts were made to directly prepare MOF-69A and load this material with such silver clusters. However no phase-pure MOF-69A powder could be synthesized when following literature procedures.79,82,83
This silver-induced MOF-to-MOF transformation was also performed using different ethanol to water ratios. These solvent ratios had only a minor influence on the transformation or on the crystallinity of the formed MOF-69A product, as shown by the XRD patterns (Fig. S4, ESI†). Nevertheless, as will be demonstrated below, an appropriate solvent ratio is essential to generate luminescent silver clusters.
For the silver-transformed bio-MOF-1, no reflections of Ag0 nanoparticles were observed in PXRD at the typical diffraction angles of 38.1° and 44.3° 2θ.19 This was further confirmed by Auger spectra of silver obtained by XPS (Fig. S5, ESI†) which do not show any evidence of the typical peaks associated with Ag0 nanoparticles or metal. Furthermore the so-called modified Auger parameters84 calculated from the XPS data are characteristic of small silver clusters.85,86 Photoelectron spectroscopy in air (PESA) showed ionisation energies of the silver-transformed MOFs of 5.62 ± 0.05 eV and 5.52 ± 0.11 eV, with these values probably coming from the MOF framework itself (5.30 ± 0.04 eV before transformation) or possibly the silver clusters, but certainly not from metallic silver whose work function is about 4.3 eV.87
While Zn2+ and 4,4′-BPDA both end up in the MOF-69A framework, the fate of the adenine needs additional clarification. As mentioned above, mixing equimolar solutions of adenine and silver nitrate in aqueous conditions results in precipitation of a white gel, which indicates that adenine complexes with silver nitrate are poorly soluble. Therefore, it is unlikely that silver extracts adenine to the aqueous solution during the silver-induced transformation of bio-MOF-1. Rather all adenine is expected to remain occluded in the pores during the MOF-to-MOF transformation. Via1H-NMR analysis of (transformed) bio-MOF-1 samples digested with HF (Fig. 2), it was confirmed that there was no significant adenine loss from the solid material during the silver-induced transformation of bio-MOF-1. The spectrum obtained after digestion of as-synthesized bio-MOF-1 (Fig. 2a) shows the two doublets of 4,4′-BPDA (8.05, 7.85 ppm; 8 H), while the signals of the two ring protons of adenine coincide at 8.32 ppm. As expected, based on the structural formula of bio-MOF-1 ([Zn8(ad)4(BPDC)6O 2 Me2NH2+]), the ratio of adenine to 4,4′-BPDA is 2 to 3. After silver-induced transformation to MOF-69A (Fig. 2b) this ratio remains identical, proving that no adenine has been leached to the aqueous solution containing silver. However, the adeninate signals have shifted significantly downfield and are split (8.36 and 8.38 ppm), possibly pointing to a stable complex of adenine with silver, even after digestion with HF.
 | ||
| Fig. 2 1H-NMR spectra (aromatic region) for (a) as-synthesized bio-MOF-1 and (b) the same material after silver-induced transformation in 4–1 EtOH–H2O. | ||
When starting from the analogous 4,4′-trans-SBDA containing ZJU-48, there is no crystal structure transformation. Instead, a poorly crystalline product is observed, as shown in Fig. S2 (ESI†). This contrast with the case of bio-MOF-1 can be explained by the fact that there are no IRMOF or MOF-69 structures known in literature with the 4,4′-trans-SBDA linker, since this dicarboxylate linker has a slightly different geometry compared to uniaxial linkers like 4,4′-BPDA. Hence, recrystallization to a MOF-69 type material with 4,4′-trans-SBDA seems less plausible from crystallographic point of view.
Physicochemical characterisation of silver-transformed bio-MOF-1
The metal content of the silver-transformed bio-MOF-1 materials was determined using both ICP for the bulk composition and XPS for the surface composition of selected samples. Table 1 shows bulk and surface metal contents for pristine bio-MOF-1 and silver-transformed MOF-69A samples from various EtOH–H2O ratios. Comparing the bulk metal and surface metal content demonstrates that silver is slightly enriched in the outer layers of the crystals. The drastically lowered BET surface areas after silver-induced transformation, also indicated in Table 1, are likely due to filling of the pores of the newly crystallized MOF-69A with poorly soluble silver-adenine species, which strongly reduce available pore volume.| Ag/Zn (ICP) (wt%/wt%) | Ag/Zn (XPS) (wt%/wt%) | BET surface area (m2 g−1) | QY (%) λexc = 330 nm | QY (%) λexc = 366 nm | |
|---|---|---|---|---|---|
| a These weight percentages do not include hydrogen in the calculations, as hydrogen cannot be detected by XPS. This will cause the presented values to be slightly lower, but retaining the observation of increased silver contents at the surface. | |||||
| Bio-MOF-1 | 0/14.8 | 0/25.6 | 815.4 | 0 | 8.3 |
| Adenine | 0 | 2.0 | |||
| 4,4′-BPDA | 20.6 | 21.4 | |||
| After Ag-induced transformation | |||||
| From H2O | 9.6/11.9 | 37.2 | 4.1 | 7.2 | |
| From 1–7 EtOH–H2O | 9.2/11.9 | 98.1 | 3.0 | 12.3 | |
| From 1–4 EtOH–H2O | 9.4/11.9 | 87.1 | 2.8 | 9.2 | |
| From 1–2 EtOH–H2O | 8.9/12.0 | 88.1 | 0 | 10.3 | |
| From 1–1 EtOH–H2O | 8.8/11.9 | 101.6 | 0 | 18.8 | |
| From 2–1 EtOH–H2O | 9.2/11.7 | 62.9 | 0 | 17.2 | |
| From 4–1 EtOH–H2O | 12.2/11.3 | 45.7 | <1 | 15.0 | |
| From 5–1 EtOH–H2O | 8.2/13.9 | 19.2/14.5a | 23.5 | 2.1 | 14.5 |
| From 7–1 EtOH–H2O | 9.9/11.6 | 33.0 | 4.8 | 18.0 | |
| From 9–1 EtOH–H2O | 9.9/14.0 | 22.2/11.3a | 124.0 | 11.1 | 24.7 |
| From EtOH | 12.4/11.8 | 171.5 | 20.1 | 33.0 | |
FT-IR measurements were performed to monitor the interactions between silver and adenine after the structural MOF-to-MOF transformation. These spectra reveal that adenine in bio-MOF-1 has a free amine function, as demonstrated by the distinct N–H stretching vibration signals (3330 and 3185 cm−1); therefore, the zinc must be bound to the nitrogen atoms in the heterocycle, as also shown in Fig. S1a (ESI†). The N–H stretching signals are also retained after the silver-induced bio-MOF-1 transformation, giving a qualitative indication that adenine is still present and is not bound to silver through its free –NH2 group (Fig. 3). Moreover, an additional, sharp O–H stretching vibration band of the hydroxyl groups on Zn2+ in the formed MOF-69A79 is visible at 3544 cm−1 (Fig. 3). On the other hand, after the silver-induced transformation of ZJU-48, the FT-IR signals are more similar to those of free adenine, independently of the used solvent ratios for silver loading (Fig. S6, ESI†). In contrast to the transformation of bio-MOF-1, there is no sharp O–H stretch for the silver-transformed ZJU-48. It is therefore likely that the well-defined O–H stretching vibration at 3544 cm−1 in the silver-transformed bio-MOF-1 is due to the vibrations of the structural (Zn)–OH groups in MOF-69A, rather than to amorphous zinc hydroxide. Differential thermogravimetric analysis (TGA) (Fig. S7, ESI†) shows that the two organic linkers in the as-synthesized bio-MOF-1 degrade separately with maxima around 400 °C and 500 °C. In the following analysis, we only consider weight losses above 200 °C, at which temperature solvent molecules like DMF and water have been removed from the structure.
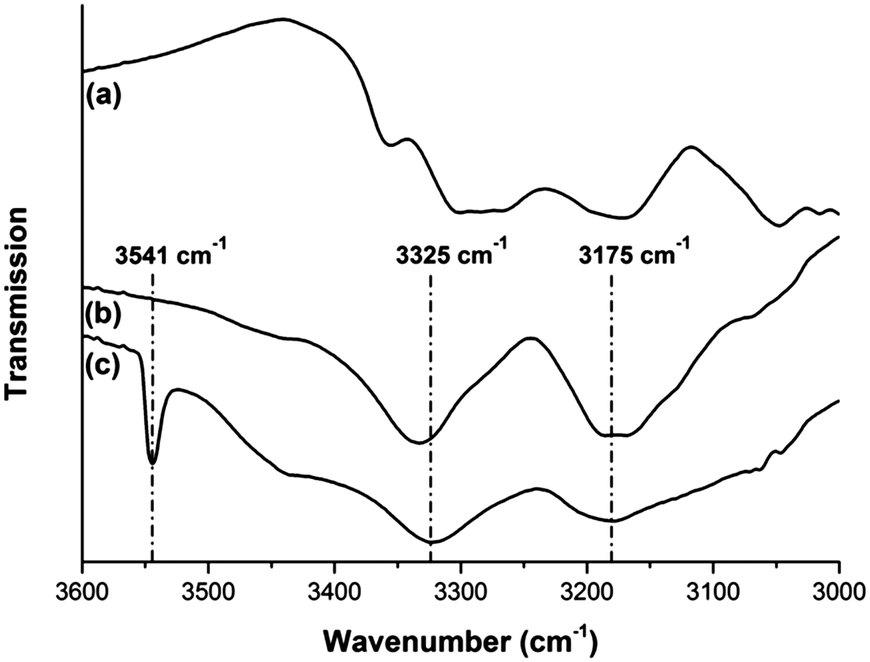 | ||
| Fig. 3 FT-IR spectra of (a) adenine, (b) bio-MOF-1 and (c) MOF-69A obtained by silver-induced transformation of bio-MOF-1. The bands at 3175 and 3325 cm−1 in (c) prove that the adeninate remains present in the transformed material; the O–H stretching vibration at 3544 cm−1 originates from the structural hydroxyl groups (Zn(O–H)) in MOF-69A. | ||
Based on the structural formula of bio-MOF-1, [Zn8(ad)4O(BPDA)6·(DMA+)2], the weight losses in TGA can be assigned to 4,4′-BPDA (400 °C; 53.4 wt% in TGA) and to adenine (500 °C; 17.7 wt% in TGA); the total loss of linker (71.1 wt%) corresponds well with the theoretically expected weight loss upon conversion of the desolvated MOF to ZnO (71.7 wt%). Note that in contrast to the free ligands, adenine in bio-MOF-1 degrades at a higher temperature than 4,4′-BPDA. The residue of 25.2 wt% of ZnO is in agreement with the theoretical Zn2+ content of the framework (theoretical: 24.9 wt%). After the silver-induced transformation, the weight loss of the sample is reduced to a single step, at a temperature corresponding to 4,4′-BPDA loss in the original material. It is likely that both structural 4,4′-BDPA and intraporous residual adenine are lost simultaneously in this single step. This may indicate that the adenine is less strongly encapsulated in MOF-69A than in the original bio-MOF-1 framework; alternatively, the contained silver may act as an oxidation catalyst for combustion of both linkers during analysis. Obviously, the inorganic residue after silver-loading is increased, in line with the ICP data of Table 1. Taking into account the ZnO content of the inorganic residue for the respective samples, the organic linker content with respect to ZnO can again be determined after Ag-induced transformation. Analysis of the data in Fig. S7 (ESI†) shows that there is no perceptible loss of organic linkers caused by the exposure to silver, which confirms the 1H-NMR data of Fig. 2. Remarkably, the small weight loss of exchanged DMA+, observed at 240 °C in the starting bio-MOF-1, is absent in the silver-loaded materials. This shows that DMA+ can initially have been exchanged for Ag+. Also note that after the structural transition, the MOF-69A no longer possesses such cation exchange capacity.
In the adopted synthesis conditions, bio-MOF-1 crystallizes as 20–100 μm sized tetragonal prisms capped with tetragonal pyramids on both sides. These crystals are often large single crystals (Fig. S8, ESI†). Scanning electron microscopy (SEM) studies show that the morphology is largely retained after the silver-induced MOF-to-MOF transformation, but large fractures are visible perpendicular to the c axis of the crystals. This can be the result of the severe stress that arises due to silver-induced adenine extraction from the original bio-MOF-1 (Fig. 4). Again, the influence of the used solvent ratios was very drastic: the crystal habitus is generally best preserved in intermediate EtOH–water mixtures (Fig. S8, ESI†), mostly in the range of 4–1 and 5–1 EtOH–H2O.
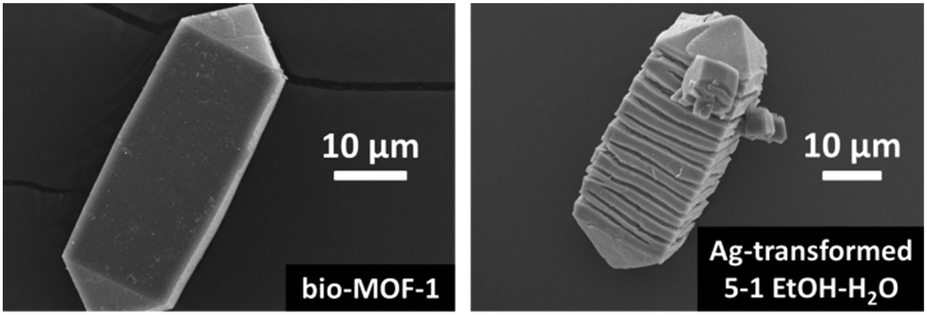 | ||
| Fig. 4 SEM pictures of pristine bio-MOF-1 and silver-transformed material from 5–1 EtOH–H2O. | ||
Optical characterisation
For metal cations with closed shell electron configurations, like alkali(ne earth) and d0 or d10 transition metals (e.g. Zn2+ in bio-MOF-1), the linker-centred luminescence is often hardly altered after incorporation of luminescent linkers in crystalline MOF structures.47–49 Since two different organic linkers are present in the structure of bio-MOF-1, they can both contribute to the absorption and emission properties. This is indeed the case: the UV-vis absorption spectrum of the parent bio-MOF-1 contains the spectral signatures of both linkers. The DRS spectrum (Fig. S10, ESI†) is dominated by the UV absorption of adenine between 250 and 300 nm and further shows a shoulder between 300 and 330 nm from 4,4′-BPDA. Based on the spectral similarity, the emission profile of bio-MOF-1 can largely be attributed to adenine luminescence (Fig. S11, ESI†). The strong 4,4′-BPDA luminescence observed in the solid state (see Table 1) possibly becomes quenched when 4,4′-BPDA is integrated into the bio-MOF-1 structure, as quenching and emission shifts for similar dicarboxylates are known from literature.88,89 However, after the structural transformation to MOF-69A the main luminescence in many cases still stems from 4,4-BPDA (ESI,† Fig. S11 and S12).After the transformation of bio-MOF-1 to MOF-69A the optical properties change drastically. The composition (EtOH–H2O ratio) of the silver nitrate solution has an important impact on the reduced Ag species formed (Fig. S12, ESI†). At either low or high EtOH–H2O ratios, only the luminescence of 4,4′-BPDA in the formed MOF-69A is discerned, indicating the transformation of bio-MOF-1 without formation of luminescent silver clusters. Only at intermediate EtOH–H2O ratios (1–1 to 4–1), a new, very strong blue-green emission emerges (λem 455–530 nm, λmax at 485 nm) using excitation in the UV between 340 and 390 nm (Fig. 5). This emission cannot be attributed to the original linkers (Fig. S11 and S12, ESI†), nor to the zinc oxide nodes or possibly formed ZnO nanoparticles.90 The latter typically have a maximum, usually narrow emission at 530 nm. The spectral properties, including the larger Stokes shift, show a large similarity to those observed for luminescent silver clusters stabilized by ssDNA14,17 but even more similarities compared to luminescent Ag-zeolites, as previously reported by our group.24 See also Fig. S13 (ESI†) for a comparison of the Ag-transformed MOF from 4–1 EtOH–H2O with Ag-zeolites. Clearly, during the transformation to MOF-69A, these blue-green luminescent silver-cluster species can only be formed under well-defined, moderately reducing conditions. The formed silver clusters are successfully stabilized by the adenine released from the original bio-MOF-1 structure during the MOF-to-MOF transformation. In contrast, the absorption-emission spectra of ssDNA-stabilized silver clusters in solution12 continuously change over time due to non-specific formation of different emissive silver clusters,91 gradual additional reduction and cluster aggregation12 because the DNA strands are too flexible. Our proposed luminescent system is more stable over time, as the silver clusters are contained by adenine in the pores of the MOF-69A framework, much like silver clusters in zeolites.20,22,23 In zeolites A and Y, the smallest reported emissive clusters, most probably Ag3+, also display the most blue-shifted emission. Based on these analogies, we propose that the blue-green luminescent adenine-stabilized clusters formed in MOF-69A are no larger than four silver atoms. However, based on theoretical studies of silver cluster in zeolites,25 it was found that the optical properties of the clusters is highly dependent on nuclearity, oxidation state and hydration level, which all determine the electronic properties of the metal clusters. For the Ag-loaded MOF samples, similar processes can be expected, but nevertheless this is subject to further research beyond the scope of this work.
 | ||
| Fig. 5 Spectroscopic study of bio-MOF-1 (left) and of the same material after Ag-induced transformation to MOF-69A (right): steady-state (top) and time-resolved (bottom) luminescence characterization at λex = 375 nm show the appearance of a strong and long-lived luminescent feature upon silver loading. | ||
Based on the excitation–emission profiles of our samples, the quantum yields were determined at two different wavelengths to discriminate between luminescence of the adenine-stabilized silver cluster species (λexc = 366 nm) and of the 4,4′-BPDA linker (λexc = 330 nm), as shown in Table 1. The parent bio-MOF-1 structure has a quantum yield (QY) of 8.3% (λexc = 366 nm), which is much lower than the quantum yield of up to 18.8% for the new blue-green luminescence (λexc = 366 nm) that appears after the MOF-to-MOF transformation from 1–1 EtOH–H2O. For samples prepared in ethanol-rich conditions, this green-blue luminescent species is overpowered by the blue luminescence of the 4,4′-BPDA linker, which causes the general quantum yield to rise for both tested excitation wavelengths. This is also clear from the excitation–emission profiles in Fig. S12 (ESI†). The UV-vis absorption properties of all silver-transformed bio-MOF-1 samples are still mainly determined by the organic linkers, originally present in bio- MOF-1 (Fig. S10, ESI†).
The emission differences between the starting bio-MOF-1 samples and the silver-transformed samples (4–1 ethanol–H2O) are clearly visible by eye under a standard laboratory UV lamp (Fig. S14, ESI†). Using wide-field and confocal fluorescence microscopy, not only the spectroscopic changes of single MOF crystals but also the structural transformation can be followed (Fig. 6). When scanning across the entire crystal depth of pristine bio-MOF-1 crystals, the blue luminescence appears homogeneously throughout the crystals, using the 430–470 nm emission detection channel (Fig. 6d). In contrast, for bio-MOF-1 crystals after the silver-induced transformation from 4–1 ethanol–water there appears to be an enrichment of the luminescent silver cluster species (λem = 485 nm) towards the outer rim of the crystals, but some luminescence is also clearly detected inside the crystals using a 505–540 nm emission detection window (Fig. 6h). This detection window was applied to properly discriminate between the blue-green luminescent Ag species and the background luminescence of 4,4′-BPDA. This observation also lines up with the differences in outer-surface and bulk silver contents shown in Table 1.
 | ||
| Fig. 6 Microscopy images of bio-MOF-1: (a and b) transmission and wide-field fluorescence, (c and d) transmission and confocal fluorescence microscopy (detection channel 430–470 nm for d); after silver-induced transformation from 4–1 EtOH–H2O: (e and f) transmission and wide-field fluorescence, (g and h) transmission and confocal fluorescence microscopy (detection channel 505–540 nm for h). | ||
From time-resolved fluorescence measurements (λex = 375 nm) for bio-MOF-1 and the Ag-transformed sample (4–1 EtOH–H2O), it is clear that the fluorescence lifetimes in both materials are different (Fig. 5). The fluorescence decay curves were fitted with a multi-exponential function; see Fig. S15 (ESI†) for residual signals. The decays in both samples at λem = 415 nm are very similar, which possibly means they originate from the same molecule. Presumably, this molecule is adenine, based on the spectral information in Fig. 5 and Fig. S11 (ESI†). When specifically looking at the emission wavelengths of the adenine-stabilized silver clusters (λem = 485 nm), a much slower fluorescence decay of about 20 ns is recorded for the MOF after transformation, while for the original bio-MOF-1 the lifetime is only a few nanoseconds. This long lifetime component involves up to 97% of emitted photons′ lifetime, as illustrated in Fig. 5. However, this 20 ns lifetime is much longer than the sub-10 ns lifetimes usually reported for most Ag-ssDNA materials.17 This long lifetime is possibly caused by excited state processes that delay the fluorescence, such as charge transfers and electron recombination, as described in MOFs92 and related silver cluster materials.93,94
Conclusions
In this work, the adeninate framework bio-MOF-1 was investigated for its ability to stabilize luminescent silver clusters. A novel method for generating such clusters was developed by applying a well-adjusted reducing power using various EtOH–H2O ratios in the silver-containing solution. Among the large number of tested water-stable MOFs, only bio-MOF-1 appeared capable of producing new luminescent silver species. During the silver loading of bio-MOF-1, the framework reorganizes to MOF-69A due to the strong affinity of the silver ions for the adenine linkers. In this way, silver-adenine cluster species were generated in very high local concentrations in the pores of the formed MOF-69A. Adenine does not leave the system during this transformation, as confirmed by 1H-NMR, TGA and DRS. These formed silver clusters possess a peculiar blue-green luminescence (λem![[thin space (1/6-em)]](https://www.rsc.org/images/entities/char_2009.gif) max = 485 nm) with long lifetimes and high quantum yield compared to the parent bio-MOF-1 material and silver clusters stabilized in ssDNA. This work is the proof-of-principle that metal–organic frameworks are potential hosts, under the correct conditions, for the stabilization of luminescent silver clusters, by using the versatility of these materials and a confinement scaffold approach similar to that used to stabilize silver clusters in zeolites. Probing this new type of host materials can yield additional, deeper insights in the photophysical processes occurring for luminescent silver clusters in the large variety of researched host materials. This proof-of-principle study opens opportunities for application of luminescent MOFs in lighting applications and sensor devices.
max = 485 nm) with long lifetimes and high quantum yield compared to the parent bio-MOF-1 material and silver clusters stabilized in ssDNA. This work is the proof-of-principle that metal–organic frameworks are potential hosts, under the correct conditions, for the stabilization of luminescent silver clusters, by using the versatility of these materials and a confinement scaffold approach similar to that used to stabilize silver clusters in zeolites. Probing this new type of host materials can yield additional, deeper insights in the photophysical processes occurring for luminescent silver clusters in the large variety of researched host materials. This proof-of-principle study opens opportunities for application of luminescent MOFs in lighting applications and sensor devices.
Acknowledgements
Research funding is acknowledged from the EU-FP7 SACS project (Self-Assembly in Confined Space) (FP7/2007-2013) under grant agreement no. 310651 and the IAP-7 program of the Belgian Federal Government (BELSPO). B. B. and I. S. acknowledges the Research Foundation Flanders (FWO) for an Aspirant grant. DDV is grateful to FWO for supporting MOF-related projects. The authors like to acknowledge Bjorn Dieu for the technical support during optical characterization, Alexey Kubarev and Jordi Van Loon for the help with confocal fluorescence microscopy imaging, Iris Cuppens for ICP measurements and Jasper Verduyckt for performing liquid-phase 1H-NMR. O. F. acknowledges funding from the EU-FP7 project, MULTITUTDES (grant agreement no. PIEF-GA-2012-326666). O. F. is a Royal Society University Research Fellow. P. S. acknowledges financial support from the Agence Nationale de la Recherche through the LabEx project Chemistry of Complex Systems (ANR-10-LABX-0026_CSC), and the International Center for Frontier Research in Chemistry (icFRC).References
- J. Zheng, P. R. Nicovich and R. M. Dickson, Annu. Rev. Phys. Chem., 2007, 58, 409–431 CrossRef CAS PubMed.
- I. Díez and R. A. Ras, in Advanced Fluorescence Reporters in Chemistry and Biology II, ed. A. P. Demchenko, Springer, Berlin, Heidelberg, 2010, vol. 9, ch. 10, pp. 307–332 Search PubMed.
- I. Diez and R. H. A. Ras, Nanoscale, 2011, 3, 1963–1970 RSC.
- H. Xu and K. S. Suslick, Adv. Mater., 2010, 22, 1078–1082 CrossRef CAS PubMed.
- J. P. Wilcoxon and B. L. Abrams, Chem. Soc. Rev., 2006, 35, 1162–1194 RSC.
- Y. Lu and W. Chen, Chem. Soc. Rev., 2012, 41, 3594–3623 RSC.
- G. De Cremer, Y. Antoku, M. B. J. Roeffaers, M. Sliwa, J. Van Noyen, S. Smout, J. Hofkens, D. E. De Vos, B. F. Sels and T. Vosch, Angew. Chem., Int. Ed., 2008, 47, 2813–2816 CrossRef CAS PubMed.
- T. Baba, Y. Iwase, K. Inazu, D. Masih and A. Matsumoto, Microporous Mesoporous Mater., 2007, 101, 142–147 CrossRef CAS.
- J. A. Martens, A. Cauvel, A. Francis, C. Hermans, F. Jayat, M. Remy, M. Keung, J. Lievens and P. A. Jacobs, Angew. Chem., Int. Ed., 1998, 37, 1901–1903 CrossRef CAS.
- A. Corma, P. Concepción, M. Boronat, M. J. Sabater, J. Navas, M. J. Yacaman, E. Larios, A. Posadas, M. A. López-Quintela, D. Buceta, E. Mendoza, G. Guilera and A. Mayoral, Nat. Chem., 2013, 5, 775–781 CrossRef CAS PubMed.
- J. T. Petty, C. Fan, S. P. Story, B. Sengupta, A. St. John Iyer, Z. Prudowsky and R. M. Dickson, J. Phys. Chem. Lett., 2010, 1, 2524–2529 CrossRef CAS PubMed.
- J. T. Petty, J. Zheng, N. V. Hud and R. M. Dickson, J. Am. Chem. Soc., 2004, 126, 5207–5212 CrossRef CAS PubMed.
- L. A. Peyser, A. E. Vinson, A. P. Bartko and R. M. Dickson, Science, 2001, 291, 103–106 CrossRef CAS PubMed.
- C. I. Richards, S. Choi, J.-C. Hsiang, Y. Antoku, T. Vosch, A. Bongiorno, Y.-L. Tzeng and R. M. Dickson, J. Am. Chem. Soc., 2008, 130, 5038–5039 CrossRef CAS PubMed.
- T. Vosch, Y. Antoku, J.-C. Hsiang, C. I. Richards, J. I. Gonzalez and R. M. Dickson, Proc. Natl. Acad. Sci. U. S. A., 2007, 104, 12616–12621 CrossRef CAS PubMed.
- S. M. Copp, D. Schultz, S. Swasey, J. Pavlovich, M. Debord, A. Chiu, K. Olsson and E. Gwinn, J. Phys. Chem. Lett., 2014, 5, 959–963 CrossRef CAS PubMed.
- S. Choi, R. M. Dickson and J. Yu, Chem. Soc. Rev., 2012, 41, 1867–1891 RSC.
- T. Sun and K. Seff, Chem. Rev., 1994, 94, 857–870 CrossRef CAS.
- G. De Cremer, E. Coutiño-Gonzalez, M. B. Roeffaers, B. Moens, J. Ollevier, M. Van der Auweraer, R. Schoonheydt, P. A. Jacobs, F. C. De Schryver, J. Hofkens, D. E. De Vos, B. F. Sels and T. Vosch, J. Am. Chem. Soc., 2009, 131, 3049–3056 CrossRef CAS PubMed.
- G. De Cremer, E. Coutiño-Gonzalez, M. B. J. Roeffaers, D. E. De Vos, J. Hofkens, T. Vosch and B. F. Sels, ChemPhysChem, 2010, 11, 1627–1631 CrossRef CAS PubMed.
- G. De Cremer, B. F. Sels, J.-I. Hotta, M. B. J. Roeffaers, E. Bartholomeeusen, E. Coutiño-Gonzalez, V. Valtchev, D. E. De Vos, T. Vosch and J. Hofkens, Adv. Mater., 2010, 22, 957–960 CrossRef CAS PubMed.
- E. Coutino-Gonzalez, M. B. J. Roeffaers, B. Dieu, G. De Cremer, S. Leyre, P. Hanselaer, W. Fyen, B. Sels and J. Hofkens, J. Phys. Chem. C, 2013, 117, 6998–7004 CAS.
- E. Coutino-Gonzalez, D. Grandjean, M. Roeffaers, K. Kvashnina, E. Fron, B. Dieu, G. De Cremer, P. Lievens, B. Sels and J. Hofkens, Chem. Commun., 2014, 50, 1350–1352 RSC.
- E. Coutino-Gonzalez, W. Baekelant, D. Grandjean, M. B. J. Roeffaers, E. Fron, M. S. Aghakhani, N. Bovet, M. Van der Auweraer, P. Lievens, T. Vosch, B. Sels and J. Hofkens, J. Mater. Chem. C, 2015, 3, 11857–11867 RSC.
- N. T. Cuong, H. M. T. Nguyen and M. T. Nguyen, Phys. Chem. Chem. Phys., 2013, 15, 15404–15415 RSC.
- G. A. Ozin and H. Huber, Inorg. Chem., 1978, 17, 155–163 CrossRef CAS.
- L. König, I. Rabin, W. Schulze and G. Ertl, Science, 1996, 274, 1353–1354 CrossRef.
- E. Maik, R. Klaus, H. Armin, M. T. Dragomir, W. Wilfried, S. E. Reinhard and P. Gianfranco, Nanotechnology, 2008, 19, 135701 CrossRef PubMed.
- M. V. Shestakov, L. F. Chibotaru, V. K. Tikhomirov, V. D. Rodriguez, J. J. Velazquez and V. V. Moshchalkov, Phys. Chem. Chem. Phys., 2013, 15, 15949–15953 RSC.
- J. Zheng and R. M. Dickson, J. Am. Chem. Soc., 2002, 124, 13982–13983 CrossRef CAS PubMed.
- R. J. T. Houk, B. W. Jacobs, F. E. Gabaly, N. N. Chang, A. A. Talin, D. D. Graham, S. D. House, I. M. Robertson and M. D. Allendorf, Nano Lett., 2009, 9, 3413–3418 CrossRef CAS PubMed.
- G. Ferey, Chem. Soc. Rev., 2008, 37, 191–214 RSC.
- C. Janiak, Dalton Trans., 2003, 2781–2804, 10.1039/b305705b.
- C. Janiak and J. K. Vieth, New J. Chem., 2010, 34, 2366–2388 RSC.
- J. R. Long and O. M. Yaghi, Chem. Soc. Rev., 2009, 38, 1213–1214 RSC.
- S. Kitagawa, R. Kitaura and S. Noro, Angew. Chem., Int. Ed., 2004, 43, 2334–2375 CrossRef CAS PubMed.
- L. J. Murray, M. Dinca and J. R. Long, Chem. Soc. Rev., 2009, 38, 1294–1314 RSC.
- D. Britt, H. Furukawa, B. Wang, T. G. Glover and O. M. Yaghi, Proc. Natl. Acad. Sci. U. S. A., 2009, 106, 20637–20640 CrossRef CAS PubMed.
- B. Van de Voorde, B. Bueken, J. Denayer and D. De Vos, Chem. Soc. Rev., 2014, 43, 5766–5788 RSC.
- J.-R. Li, J. Sculley and H.-C. Zhou, Chem. Rev., 2011, 112, 869–932 CrossRef PubMed.
- B. Van de Voorde, D. Damasceno Borges, F. Vermoortele, R. Wouters, B. Bozbiyik, J. Denayer, F. Taulelle, C. Martineau, C. Serre, G. Maurin and D. De Vos, ChemSusChem, 2015, 8, 3159–3166 CrossRef CAS PubMed.
- A. Corma, H. Garcia and F. X. L. Xamena, Chem. Rev., 2010, 110, 4606–4655 CrossRef CAS PubMed.
- F. Vermoortele, R. Ameloot, A. Vimont, C. Serre and D. De Vos, Chem. Commun., 2011, 47, 1521–1523 RSC.
- P. Valvekens, F. Vermoortele and D. De Vos, Catal. Sci. Technol., 2013, 3, 1435–1445 CAS.
- P. Valvekens, M. Vandichel, M. Waroquier, V. Van Speybroeck and D. De Vos, J. Catal., 2014, 317, 1–10 CrossRef CAS.
- P. Valvekens, D. Jonckheere, T. De Baerdemaeker, A. V. Kubarev, M. Vandichel, K. Hemelsoet, M. Waroquier, V. Van Speybroeck, E. Smolders, D. Depla, M. B. J. Roeffaers and D. De Vos, Chem. Sci., 2014, 5, 4517–4524 RSC.
- M. D. Allendorf, C. A. Bauer, R. K. Bhakta and R. J. T. Houk, Chem. Soc. Rev., 2009, 38, 1330–1352 RSC.
- Y. Cui, Y. Yue, G. Qian and B. Chen, Chem. Rev., 2011, 112, 1126–1162 CrossRef PubMed.
- J. Heine and K. Muller-Buschbaum, Chem. Soc. Rev., 2013, 42, 9232–9242 RSC.
- J. An, S. J. Geib and N. L. Rosi, J. Am. Chem. Soc., 2009, 131, 8376–8377 CrossRef CAS PubMed.
- T. Wakaoka, K. Hirai, K. Murayama, Y. Takano, H. Takagi, S. Furukawa and S. Kitagawa, J. Mater. Chem. C, 2014, 2, 7173–7175 RSC.
- C. M. Doherty, D. Buso, A. J. Hill, S. Furukawa, S. Kitagawa and P. Falcaro, Acc. Chem. Res., 2014, 47, 396–405 CrossRef CAS PubMed.
- P. Falcaro, R. Ricco, A. Yazdi, I. Imaz, S. Furukawa, D. Maspoch, R. Ameloot, J. D. Evans and C. J. Doonan, Coord. Chem. Rev., 2016, 307(part 2), 237–254 CrossRef CAS.
- B. W. Jacobs, R. J. T. Houk, M. R. Anstey, S. D. House, I. M. Robertson, A. A. Talin and M. D. Allendorf, Chem. Sci., 2011, 2, 411–416 RSC.
- X. Cheng, M. Liu, A. Zhang, S. Hu, C. Song, G. Zhang and X. Guo, Nanoscale, 2015, 7, 9738–9745 RSC.
- L. He, L. F. Dumee, D. Liu, L. Velleman, F. She, C. Banos, J. B. Davies and L. Kong, RSC Adv., 2015, 5, 10707–10715 RSC.
- R. Ameloot, M. B. J. Roeffaers, G. De Cremer, F. Vermoortele, J. Hofkens, B. F. Sels and D. E. De Vos, Adv. Mater., 2011, 23, 1788–1791 CrossRef CAS PubMed.
- J. An, S. J. Geib and N. L. Rosi, J. Am. Chem. Soc., 2009, 132, 38–39 CrossRef PubMed.
- T. Li, D.-L. Chen, J. E. Sullivan, M. T. Kozlowski, J. K. Johnson and N. L. Rosi, Chem. Sci., 2013, 4, 1746–1755 RSC.
- S. Pérez-Yáñez, G. Beobide, O. Castillo, J. Cepeda, A. Luque, A. T. Aguayo and P. Román, Inorg. Chem., 2011, 50, 5330–5332 CrossRef PubMed.
- H. Xu, J. Cai, S. Xiang, Z. Zhang, C. Wu, X. Rao, Y. Cui, Y. Yang, R. Krishna, B. Chen and G. Qian, J. Mater. Chem., 2013, 1, 9916–9921 RSC.
- H. Oh, T. Li and J. An, Chem. – Eur. J., 2015, 21, 17010–17015 CrossRef CAS PubMed.
- J. An, O. K. Farha, J. T. Hupp, E. Pohl, J. I. Yeh and N. L. Rosi, Nat. Commun., 2012, 3, 1–6 Search PubMed.
- T. Li, M. T. Kozlowski, E. A. Doud, M. N. Blakely and N. L. Rosi, J. Am. Chem. Soc., 2013, 135, 11688–11691 CrossRef CAS PubMed.
- H. Cai, M. Li, X.-R. Lin, W. Chen, G.-H. Chen, X.-C. Huang and D. Li, Angew. Chem., Int. Ed., 2015, 54, 10454–10459 CrossRef CAS PubMed.
- J. An, S. Geib, M.-G. Kim, S. Choi and W. Lim, J. Porous Mater., 2015, 22, 867–875 CrossRef CAS.
- Y. Song, X. Yin, B. Tu, Q. Pang, H. Li, X. Ren, B. Wang and Q. Li, CrystEngComm, 2014, 16, 3082–3085 RSC.
- J. P. García-Terán, O. Castillo, A. Luque, U. García-Couceiro, P. Román and L. Lezama, Inorg. Chem., 2004, 43, 4549–4551 CrossRef PubMed.
- F. Wang and Y. Kang, Inorg. Chem. Commun., 2012, 20, 266–268 CrossRef CAS.
- K. C. Stylianou, J. E. Warren, S. Y. Chong, J. Rabone, J. Bacsa, D. Bradshaw and M. J. Rosseinsky, Chem. Commun., 2011, 47, 3389–3391 RSC.
- S. Pérez-Yáñez, G. Beobide, O. Castillo, J. Cepeda, A. Luque and P. Román, Cryst. Growth Des., 2012, 12, 3324–3334 Search PubMed.
- P. S. Nugent, V. L. Rhodus, T. Pham, K. Forrest, L. Wojtas, B. Space and M. J. Zaworotko, J. Am. Chem. Soc., 2013, 135, 10950–10953 CrossRef CAS PubMed.
- J. Yu, Y. Cui, H. Xu, Y. Yang, Z. Wang, B. Chen and G. Qian, Nat. Commun., 2013, 4, 1–7 Search PubMed.
- J. An and N. L. Rosi, J. Am. Chem. Soc., 2010, 132, 5578–5579 CrossRef CAS PubMed.
- J. An, C. M. Shade, D. A. Chengelis-Czegan, S. Petoud and N. L. Rosi, J. Am. Chem. Soc., 2011, 133, 1220–1223 CrossRef CAS PubMed.
- X. Shen and B. Yan, J. Mater. Chem. C, 2015, 3, 7038–7044 RSC.
- B. Li, Y. Zhang, D. Ma, T. Ma, Z. Shi and S. Ma, J. Am. Chem. Soc., 2014, 136, 1202–1205 CrossRef CAS PubMed.
- R. G. Pearson, J. Am. Chem. Soc., 1963, 85, 3533–3539 CrossRef CAS.
- N. L. Rosi, M. Eddaoudi, J. Kim, M. O'Keeffe and O. M. Yaghi, Angew. Chem., Int. Ed., 2002, 41, 284–287 CrossRef CAS.
- S. S. Kaye, A. Dailly, O. M. Yaghi and J. R. Long, J. Am. Chem. Soc., 2007, 129, 14176–14177 CrossRef CAS PubMed.
- S. Hausdorf, J. Wagler, R. Moßig and F. O. R. L. Mertens, J. Phys. Chem. A, 2008, 112, 7567–7576 CrossRef CAS PubMed.
- N. L. Rosi, J. Kim, M. Eddaoudi, B. Chen, M. O'Keeffe and O. M. Yaghi, J. Am. Chem. Soc., 2005, 127, 1504–1518 CrossRef CAS PubMed.
- U. Ravon, M. Savonnet, S. Aguado, M. E. Domine, E. Janneau and D. Farrusseng, Microporous Mesoporous Mater., 2010, 129, 319–329 CrossRef CAS.
- S. W. Gaarenstroom and N. Winograd, J. Chem. Phys., 1977, 67, 3500–3506 CrossRef CAS.
- A. M. Fonseca and I. C. Neves, Microporous Mesoporous Mater., 2013, 181, 83–87 CrossRef CAS.
- O. Fenwick, E. Coutino-Gonzalez, W. Baekelant, F. Richard, S. Bonacchi, M. B. J. Roeffaers, J. Hofkens and P. Samorì, under review.
- G. W. C. Kaye and T. H. Laby, Tables of Physical & Chemical Constants, 16th edn, 1995 Search PubMed.
- D. Rankine, T. D. Keene, C. J. Sumby and C. J. Doonan, CrystEngComm, 2013, 15, 9722–9728 RSC.
- C. A. Bauer, T. V. Timofeeva, T. B. Settersten, B. D. Patterson, V. H. Liu, B. A. Simmons and M. D. Allendorf, J. Am. Chem. Soc., 2007, 129, 7136–7144 CrossRef CAS PubMed.
- N. Kiomarsipour and R. Shoja Razavi, Superlattices Microstruct., 2012, 52, 704–710 CrossRef CAS.
- I. Diez, R. H. A. Ras, M. I. Kanyuk and A. P. Demchenko, Phys. Chem. Chem. Phys., 2013, 15, 979–985 RSC.
- K. G. M. Laurier, E. Fron, P. Atienzar, K. Kennes, H. Garcia, M. Van der Auweraer, D. E. De Vos, J. Hofkens and M. B. J. Roeffaers, Phys. Chem. Chem. Phys., 2014, 16, 5044–5047 RSC.
- V. Soto-Verdugo, H. Metiu and E. Gwinn, J. Chem. Phys., 2010, 132, 195102 CrossRef PubMed.
- S. A. Patel, M. Cozzuol, J. M. Hales, C. I. Richards, M. Sartin, J.-C. Hsiang, T. Vosch, J. W. Perry and R. M. Dickson, J. Phys. Chem. C, 2009, 113, 20264–20270 CAS.
Footnotes |
| † Electronic supplementary information (ESI) available: Experimental details and additional structural, physicochemical and optical characterisation. See DOI: 10.1039/c6tc00260a |
| ‡ Current address: Christian-Albrechts-Universität zu Kiel, Institut für Anorganische Chemie, Max-Eyth-Straße 2, 24118 Kiel, Germany. |
| § Current address: Queen Mary University of London, School of Engineering and Materials Science, Mile End Road, London E1 4NS, UK. |
| This journal is © The Royal Society of Chemistry 2016 |