 Open Access Article
Creative Commons Attribution 3.0 Unported Licence
Thermodynamic stability and control of oxygen reactivity at functional oxide interfaces: EuO on ITO†
Timm
Gerber
*a,
Patrick
Lömker
a,
Bernardus
Zijlstra
a,
Claire
Besson‡
b,
David N.
Mueller
a,
Willi
Zander
c,
Jürgen
Schubert
c,
Mihaela
Gorgoi
d and
Martina
Müller
*ae
aPeter Grünberg Institut (PGI-6), Forschungszentrum Jülich, Jülich, Germany. E-mail: t.gerber@fz-juelich.de; mart.mueller@fz-juelich.de
bInstitut für Anorganische Chemie, RWTH Aachen University, Germany
cPeter Grünberg Institut (PGI-9), Forschungszentrum Jülich, Jülich, Germany
dHelmholtz-Zentrum für Materalien und Energie GmbH, Berlin, Germany
eFakultär für Physik, Universität Duisburg-Essen, Duisburg, Germany
First published on 1st February 2016
Abstract
As a prototypical all-oxide heterostructure, the ferromagnetic insulator europium monoxide (EuO) is synthesized on transparent and conductive indium tin oxide (ITO) virtual substrates. Non-destructive hard X-ray photoelectron spectroscopy is employed to depth profile the chemical composition of the magnetic layer and the buried oxide–oxide interface. We find that thermally activated oxygen diffusion from ITO affects the EuO growth process. We present how to control the oxygen reactivity at the interface and discuss its origin in a thermodynamic analysis. Our complementary methodical strategy allows for a significant improvement of the EuO chemical quality with sizeable magnetic properties. Generally, our approach derives guidelines for the proper choice of oxide substrates and buffer layer materials for functional all-oxide heterostructures.
1 Introduction
Functional metal oxides (MOs) are at the heart of such diverse research areas as nano-, spin- and optoelectronics as well as catalysis, battery- and solid oxide fuel cell technology. An exciting prospect in the field of oxide spintronics is the combination of an insulating magnetic oxide with a conductive oxide electrode. Such a magnetic tunnel junction can be used to generate highly spin-polarized currents.1,2 In this work, we propose and study a prototype heterostructure for such application, which is composed of a ferromagnetic insulator, europium monoxide (EuO), and a transparent conducting electrode, Sn-doped In2O3 (ITO).3 In addition to the ‘spin filter’ ability, the transparency of the substrate allows for in operando probing of the EuO's magneto-optical response.4High-quality MOs are typically synthesized by thoroughly controlled high-temperature metal–oxygen reactions.5 Integrating MOs into multifunctional oxide heterostructures requires a fundamental understanding of these chemical processes, in order to prepare stable oxide phases with atomically sharp interfaces. The careful control of elemental fluxes and temperature is particularly important for growing metastable ferromagnetic EuO with its very narrow parameter range for stoichiometric synthesis: if the ratio of europium metal and oxygen flux JEu/JO only slightly deviates from unity, either Eu metal-rich EuO1−x or the over-oxidized, paramagnetic phases Eu3O4 and Eu2O3 are formed.6 By applying an adsorption-controlled EuO growth mode, the so-called distillation method, the narrow parameter space can be expanded. This method implies a flux ratio JEu/JO > 1 and an elevated growth temperature which is high enough to enable the re-evaporation of excess Eu metal.6–11
At elevated growth temperatures, however, chemical reactions between the functional EuO layer and the substrate may occur, thereby yielding undesired interface contaminants. On Si substrates, these processes can be suppressed by the careful choice of buffer layers e.g. SiOx12 or SrO,13 as well as by surface passivation e.g. through formation of EuSi.14 Thermodynamic stability of EuO with the substrate or buffer layer is important because it signals the absence of a driving force for such reactions.15 While an exhaustive knowledge of the thermodynamic stability of semiconductor-oxide16 and metal-oxide17,18 interfaces is available in literature, fundamental insights into the thermochemistry of all-oxide heterostructures are surprisingly sparse.
In this regard, we investigate the impact of the thermodynamic properties on the growth, interface chemistry and magnetic functionality of EuO on ITO virtual substrates. We employ hard X-ray photoelectron spectroscopy (HAXPES) as a powerful non-destructive and element-sensitive probing technique.19,20 HAXPES enables the chemical depth profiling of the functional oxide layer and the buried heterointerfaces, as schematically depicted in Fig. 1. We show that thermally activated oxygen diffusion at the EuO/ITO interface limits the application of the otherwise beneficial EuO distillation method. Our study is corroborated by a comprehensive thermodynamic analysis of the EuO/ITO heterosystem. Applying these complementary methods yields a fundamental understanding of the origin of the oxygen reactivity at the EuO/ITO interface, and allows us to significantly optimize the stability of ferromagnetic EuO on ITO virtual substrates. In view of the significance to control oxygen reactivity at oxide interfaces, we derive guidelines for a suitable choice of substrates and buffer layer materials for all-oxide heterostructures.
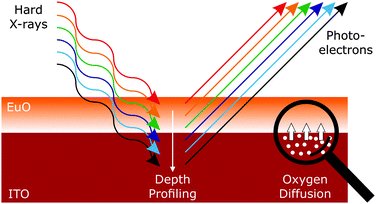 | ||
| Fig. 1 Principle of a HAXPES depth profile: the escape depth of the photoelectrons depends on the chosen excitation energy. | ||
2 Experimental
Virtual ITO substrates were prepared by depositing 50 nm thick ITO films via pulsed laser deposition (PLD) onto epi-polished (001)-oriented yttria-stabilized zirconia (YSZ, composition Zr0.87Y0.13O1.935). ITO/YSZ(001) heteroepitaxy is achievable, because the YSZ lattice constant aYSZ = 5.142 Å almost equals half that of ITO (aITO = 10.13 Å), with a tensile lattice mismatch of aITO/(2·aYSZ) ≈ +1.5%.21 PLD deposition of ITO was performed using a target with the composition In1.8Sn0.2O3 (Mateck GmbH, Jülich), a KrF excimer laser (wavelength 248 nm, 40 ns and 1 J per pulse) with an O2 background pressure pO2 = 5 × 10⁻³ mbar.22 During ITO growth, the YSZ substrate temperature was set to TS ≈ 300 °C.Thereafter, the ITO virtual substrates were transferred ex situ to an MBE system with a residual gas pressure p < 10−10 mbar, where they were annealed in ultrahigh vacuum at TS = 550 °C for t = 2 h.§ For subsequent EuO growth, the substrate temperature was set to either room temperature (RT) or 400 °C. Stoichiometric EuO was synthesized by e-beam evaporating 99.99% pure Eu with a deposition rate of 0.13 Å s−1 in an O2 atmosphere. Using specialized gas inlets, the oxygen gas was equally distributed to the sample surface and to a quadrupole mass spectrometer (QMS) which was used to carefully control the partial O2 pressure. We applied a flux ratio of JEu/JO = 1 which in our setup corresponds to pO2 = 1.7 × 10⁻⁹ mbar at the QMS. This value was determined by growing EuO on YSZ with varying O2 pressure.23 EuO growth was always initiated by exposing the sample to Eu metal flux. Subsequently, the O2 flux was ramped to the desired value within ca. 30 seconds.
Structural analysis of the EuO/ITO samples was carried out in situ by reflection high-energy electron diffraction (RHEED) and low-energy electron diffraction (LEED). Further ex situ structural analysis was carried out by X-ray diffraction (XRD) using a Philips X'Pert MRD four-circle diffractometer. Prior to all ex situ measurements the samples were capped with an Al layer (d = 10 nm) to prevent further oxidation of the metastable EuO films in air.
Magnetic characterization was carried out using a Quantum Design superconducting quantum interference device (SQUID) magnetometer. In-plane hysteresis loops were measured at T = 5 K and M(T) curves were recorded warming up the sample in an alignment field of 100 Oe. The data was corrected for a paramagnetic background caused by the substrate and normalized by the nominal thickness of the EuO layer.
For chemical analysis and element-selective depth profiling, hard X-ray photoemission spectroscopy (HAXPES) experiments were conducted at the KMC-1 beamline at BESSY II (Berlin) with the HIKE endstation.24 Si(111) and Si(311) double crystal monochromators were used to generate photon energies between 2010 eV and 5000 eV. The total energy resolution ranges from 320 meV to 500 meV and the information depth from ∼10 nm to ∼25 nm. The binding energy scale was calibrated by measuring the 4f level of an Au foil attached to the sample manipulator. Eu 3d and In 3d spectra were recorded at room temperature and in normal emission geometry. For quantitative analysis the spectra were corrected by Tougaard backgrounds to account for inelastic photoelectron scattering and fitted by convoluted Gaussian–Lorenzian peak shapes. The relative error of intensities estimated in this way was assumed to be 10%.
Three types of EuO/ITO samples are discussed in the following: type (i): 4 nm EuO/ITO with the EuO layer grown at TS = 400 °C, type (ii): 4 nm EuO/2 nm YSZ/ITO with the EuO layer grown at 400 °C, but with an additional PLD-grown 2 nm thick YSZ buffer layer, and type (iii): 4 nm EuO/ITO with the EuO layer grown at room temperature (RT).
3 Results and discussion
3.1 ITO virtual substrates
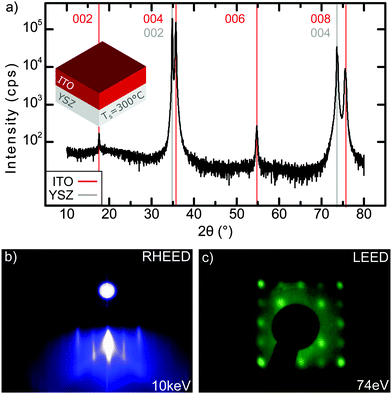
First, we characterize the ITO/YSZ(001) virtual substrates utilized for subsequent EuO growth. Fig. 2(a) shows the XRD pattern of a 50 nm thick ITO film on YSZ(001). Only intense peaks of ITO(00l) and YSZ(00l) are observed, thereby confirming the epitaxial relation ITO(001)||YSZ(001). A rocking curve of the ITO(006) peak (data not shown) yields a full width at half maximum (FWHM) of only 0.4°, which is comparable with previous work.21 From a Nelson–Riley analysis of the ITO(00l) peaks we determine an out-of-plane lattice constant aITO = 10.106 Å, which is 0.21% smaller than the ITO bulk lattice parameter. This uniaxial compression of ITO is likely due to the counteracting in-plane tensile strain of +1.5% induced by the YSZ substrate.Fig. 2(b) and (c) show RHEED and LEED images of the ITO/YSZ(001) substrates after annealing in UHV. We observe sharp streaks in the RHEED pattern, which indicate an atomically flat ITO(001) surface. The LEED pattern shows cubic symmetry, whereby the second-order ITO reflections coincide with the first-order reflections of the YSZ substrate. We thus conclude, that the ITO film grows epitaxial on YSZ with the cube-on-cube orientation ITO(001)||YSZ(001) and ITO(010)||YSZ(010), fully consistent with the ex situ XRD data.
3.2 EuO on ITO: depth-profiling of chemical composition
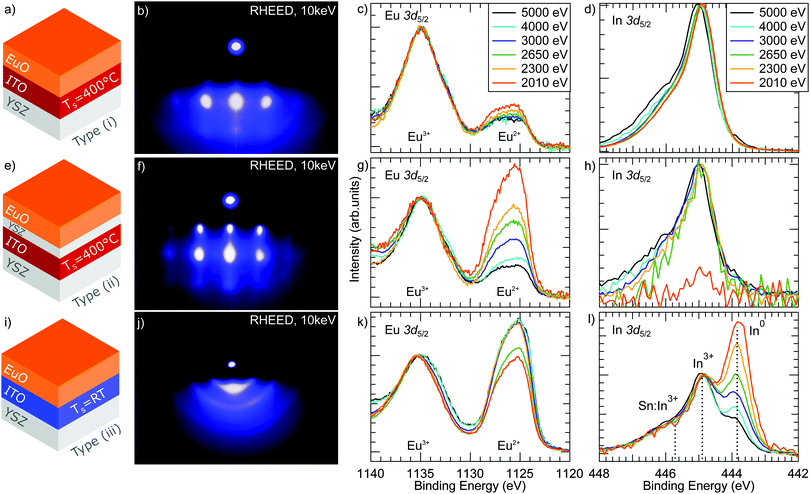
Next, the properties of EuO ultrathin films (d = 4 nm) grown on ITO(001) virtual substrates are discussed. For sample type (i), we applied an EuO growth mode with TS = 400 °C and a flux ratio JEu/JO = 1, which yields perfectly stoichiometric and single-crystalline EuO thin films on cubic oxide substrates e.g. YSZ.23Fig. 3(b) shows the RHEED pattern of sample type (i). We observe diffraction spots characteristic for epitaxial growth. However, the spots are very broad indicating a rough surface and three-dimensional island growth.In order to examine the depth-dependent chemical properties of EuO/ITO sample type (i), we used HAXPES to investigate the Eu 3d core level. This core level is spin–orbit (SO) split into a 3d5/2 and 3d3/2 component separated by ESO = 30 eV.25 The 3d5/2 component is shown in Fig. 3(c). It reveals a chemical shift between divalent Eu2+ contributions – the signature of stoichiometric and ferromagnetic EuO – and trivalent Eu3+, which is assigned to over-oxidized phases. For a photon energy of 2010 eV, the fit yields a spectral weight of the Eu2+ components of 27% and of Eu3+ = 73%. Obviously, a major amount of over-oxidized phases has formed during growth despite applying a flux ratio of JEu/JO = 1.
In order to get depth-sensitive information of the chemical composition, we recorded the Eu 3d5/2 multiplet with the incident photon energy varying from 2010 eV to 5000 eV, as shown in Fig. 3(c). The corresponding fit results are summarized in Fig. 4(a). We observe, that the relative intensity of the Eu2+ component gradually decreases with increasing photon energy, i.e. with increasing bulk sensitivity. This result indicates, that the amount of stoichiometric EuO decreases from the surface towards the EuO/ITO interface.
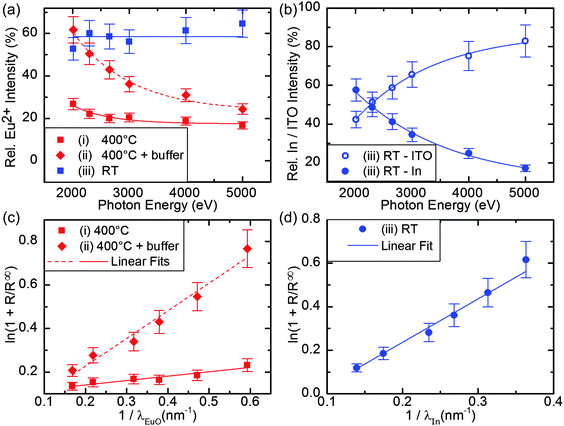 | ||
| Fig. 4 (a) Relative Eu2+ intensity as estimated by fits to the HAXPES data shown in Fig. 3(c, g and k). (b) Relative intensity IITO and IIn of the HAXPES depth profile shown in Fig. 3(l). Lines in (a) and (b) are guides to the eye. (c) Determination of the EuO layer thickness for sample type (i) and (ii) gives dEuO = (0.2 ± 0.1) nm and dEuO = (1.3 ± 0.1) nm, respectively. (d) Determination of the In metal layer thickness for sample type (iii) gives dIn = (2.0 ± 0.1) nm. | ||
We therefore conclude that – although the O2 flux is fine-tuned to match the Eu flux during growth – the ITO virtual substrate likely acts as an additional source of oxygen, resulting in a significantly enhanced fraction of over-oxidized EuO phases mainly located at the EuO/ITO interface. Consequently, the growth conditions need to be refined for synthesis of stoichiometric EuO on ITO.
In the following, we discuss two strategies to suppress the oxygen diffusion from the ITO virtual substrate during EuO growth.
First, we apply the same growth conditions (TS = 400 °C, JEu/JO = 1) but insert a 2 nm thick PLD-grown YSZ buffer layer on top of the ITO virtual substrate (sample type (ii)). YSZ was chosen as a buffer layer material, since EuO grows with high crystalline quality directly on YSZ substrates.8 The results are compiled in the middle row of Fig. 3. The RHEED pattern in Fig. 3(f) shows diffraction spots which are characteristic for three-dimensional island growth. However, they are sharper than those observed for sample type (i), thus suggesting a lower surface roughness of the EuO film grown on 2 nm YSZ/ITO. From the HAXPES depth profile in Fig. 3(g), we find that the spectral intensity of the Eu2+ components is 60% for the lowest photon energy (i.e. largest surface sensitivity) and decreases gradually to 25% for the largest photon energy of 5000 eV (i.e. largest bulk sensitivity). The content of stoichiometric EuO is clearly enhanced compared to sample type (i). However, the EuO/ITO interface is still dominated by over-oxidized phases. Thus, the YSZ buffer layer hinders oxygen diffusion from the substrate but cannot completely prevent it.
Our second strategy to avoid oxygen diffusion from the ITO virtual substrate is to grow EuO directly on ITO using the flux ratio of JEu/JO = 1, but with the substrate kept at room temperature. Oxygen diffusion in oxides typically follows an Arrhenius law, and the oxygen mobility in ITO is negligible at room temperature.¶
For sample type (iii), the RHEED pattern in Fig. 3(j) reveals diffraction rings that are indicative of a polycrystalline EuO film. The corresponding HAXPES spectra in Fig. 3(k) show a Eu2+ ratio of about 60% and only small changes of the Eu2+ 3d spectral intensity within the HAXPES depth profile. The relatively small variations of the Eu2+ intensity indicate that the chemical composition of the EuO layer is homogeneous.
Finally, we performed a complementing HAXPES depth profiling analysis of the In 3d core levels of the buried ITO virtual substrate. The spectra of sample types (i) and (ii) are displayed in Fig. 3(d) and (h). They consist of two components: a sharp component located at 444.9 eV, which denotes trivalent In3+ (as expected for Sn![[thin space (1/6-em)]](https://www.rsc.org/images/entities/char_2009.gif) :
:![[thin space (1/6-em)]](https://www.rsc.org/images/entities/char_2009.gif) In2O3)27 and a second, broad component located at 445.7 eV which can be attributed to screening effects caused by the Sn dopants.28
In2O3)27 and a second, broad component located at 445.7 eV which can be attributed to screening effects caused by the Sn dopants.28
In contrast, sample type (iii) reveals an additional spectral feature in the In 3d core level as depicted in Fig. 3(l). For the largest photon energy (largest bulk sensitivity), the spectra are comparable to those of sample types (i) and (ii), but possess a small shoulder at the low binding energy side of the In3+ peak. This feature located at 443.9 eV is characteristic for metallic In0.27 The relative intensities IITO and IIn are shown in Fig. 4(b).||IIn increases with decreasing photon energy and dominates the spectrum at the lowest photon energies, i.e. at the highest surface sensitivity. Thus, we clearly find In metal present at the EuO/ITO interface of sample type (iii).
In order to estimate the thickness d of the In0 layer from our HAXPES data we assumed the layer to be discrete. In this case one can apply the relation29
 | (1) |
In the same way, we analyzed the effective thickness of the EuO layer in samples (i) and (ii), see Fig. 4(c). Here, we assume that a discrete EuO layer is present on top of an Eu2O3 layer which is in contact with the substrate. For sample (ii), this approach yields a thickness of dEuO = (1.3 ± 0.1) nm. This is about 1/3 of the total film thickness which agrees reasonably well with the chemical composition of the film (ca. 1/4 Eu2+). For sample (i), we find a value of dEuO = (0.2 ± 0.1) nm which would be only 1/20 of the film's thickness. This is much less than expected from the chemical analysis. We conclude that in the case of this sample we cannot assume that a discrete EuO layer is present but rather EuO islands on top of Eu2O3.
3.3 Magnetic properties
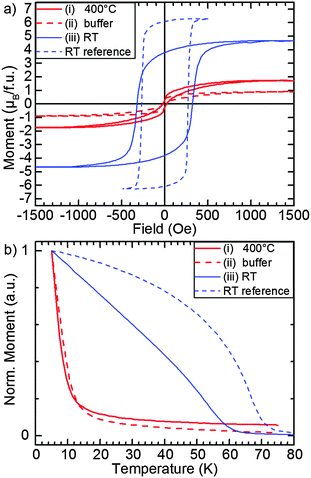
We complement the structural and chemical characterization of the EuO/ITO samples by probing their magnetic properties. Fig. 5(a) shows the respective M(H) hysteresis loops recorded at T = 5 K and (b) shows M(T) curves with an alignment field of 100 Oe.As a reference, we show the magnetic properties of a thicker EuO film (d = 9 nm) which was grown in the same way as sample (iii), i.e. deposition onto an ITO virtual substrate at room temperature. For this reference sample, we observe a square magnetic hysteresis loop with a coercive field of HC = 300 Oe and a saturation magnetization of 6.5 μB per formula unit i.e. close to the bulk value of 7 μB/f.u. Furthermore, the M(T) curve in Fig. 5(b) follows a Brillouin-like shape with a Curie temperature TC = 70 K, thus, almost perfectly matching the bulk value of 69 K. We conclude that EuO with bulk like magnetic properties can be obtained by room temperature deposition onto ITO virtual substrates.
For sample type (iii), we observe a hysteresis loop with HC = 320 Oe and a saturation magnetization of 4.6 μB per formula unit. We note that the measured magnetization of all samples was normalized by the nominal film thickness of 4 nm. The effective EuO thickness, however, is much thinner due to the presence of Eu3+ phases which results in an underestimation of the saturation magnetization of the Eu2+ (i.e. EuO) phase. The corresponding M(T) curve shows a Curie temperature of TC = 60 K. This reduced Curie temperature is expected for EuO in the ultrathin film limit.34,35 Consistently, samples (i) and (ii) which contain more Eu3+ contaminants show magnetic hysteresis but with further reduced saturation magnetization. Also, TC is reduced dramatically for these two samples due to a very low effective thickness of the EuO layer. The nominal layer thickness is already 4 nm, but – as pointed out above – the effective thickness of the EuO layer is lower because these two samples contain mostly Eu2O3. Using eqn (1), we determined the thickness of the EuO layer in sample type (ii) to be 1.3 nm.
The chemical composition of the samples as reflected by the spectral weight of Eu2+ or Eu3+ cations is, thus, fully consistent with their macroscopic magnetic properties.
3.4 Thermodynamic analysis and discussion
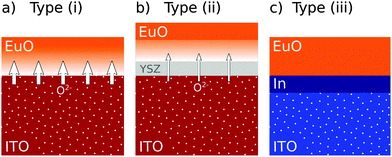
Combining the results on the three sample types, we derive the following picture of EuO synthesis on ITO: besides the oxygen gas which is supplied during the reactive MBE growth process, the ITO virtual substrate is an additional supplier of oxygen (Fig. 7(a)). The substrate is reduced by the presence of EuO to In metal while EuO over-oxidizes to Eu3O4 and Eu2O3. The chemical reactions taking place at the EuO/ITO interface are6EuO + ⅔![[thin space (1/6-em)]](https://www.rsc.org/images/entities/char_2009.gif) In2O3 → 2Eu3O4 + In2O3 → 2Eu3O4 + ![[/]](https://www.rsc.org/images/entities/char_e12a.gif) ![[thin space (1/6-em)]](https://www.rsc.org/images/entities/char_2009.gif) In In | (2) |
4Eu3O4 + ⅔![[thin space (1/6-em)]](https://www.rsc.org/images/entities/char_2009.gif) In2O3 → 6Eu2O3 + In2O3 → 6Eu2O3 + ![[/]](https://www.rsc.org/images/entities/char_e12a.gif) ![[thin space (1/6-em)]](https://www.rsc.org/images/entities/char_2009.gif) In In | (3) |
| 2Eu + O2 ⇄ 2EuO | (4) |
| 6EuO + O2 ⇄ 2Eu3O4 | (5) |
| 4Eu3O4 + O2 ⇄ 6Eu2O3 | (6) |
![[/]](https://www.rsc.org/images/entities/char_e12a.gif) ![[thin space (1/6-em)]](https://www.rsc.org/images/entities/char_2009.gif) In + O2 ⇄ ⅔ In + O2 ⇄ ⅔![[thin space (1/6-em)]](https://www.rsc.org/images/entities/char_2009.gif) In2O3. In2O3. | (7) |
| ΔrG0(2) = ΔrG0(5) − ΔrG0(7) | (8) |
| ΔrG0(3) = ΔrG0(6) − ΔrG0(7) | (9) |
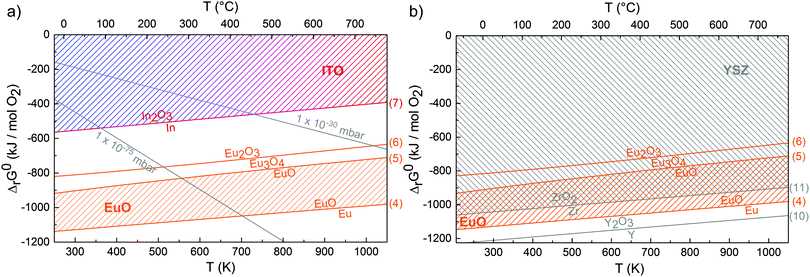 | ||
| Fig. 6 (a) Ellingham diagram for oxygen reactions at the EuO–ITO interface calculated with thermodynamical data from ref. 32 and 33. Gibbs free energy change of reactions (4)–(7) are indicated by straight lines. Stable conditions for EuO and ITO are marked by the hatched areas. Gray lines show constant O2 pressures. (b) Ellingham diagram for oxygen reactions at the EuO–YSZ interface. | ||
Therefore, the given thermodynamic conditions prefer the formation of over-oxidized phases at a growth temperature TS = 400 °C and JEu/JO = 1 (sample type (i)). We note, that even with a flux ratio JEu/JO = 2 the abundance of over-oxidized phases could not be reduced (see ESI†). Any excess Eu reacts with O from the substrate and, therefore, cannot re-evaporate. Consequently, for EuO synthesis on ITO substrates one cannot benefit from the distillation method.
Hence, oxygen diffusion from the ITO virtual substrate to the EuO film needed to be reduced and we proceeded in two ways: the insertion of a YSZ buffer layer (sample type (ii)) and the lowering of the growth temperature (sample type (iii)).
EuO is thermodynamically stable in contact with the YSZ buffer as it can be derived from the Ellingham diagram in Fig. 6(b). In absence of thermodynamic data for this particular YSZ compound (composition Zr0.87Y0.13O1.935), a reasonable approximation is examining the individual components (in particular Zr). We thus compiled the change of the Gibbs free energy (ΔrG0) for oxidation reactions of Y and Zr:
![[/]](https://www.rsc.org/images/entities/char_e12a.gif) ![[thin space (1/6-em)]](https://www.rsc.org/images/entities/char_2009.gif) Y + O2 ⇄ ⅔Y2O3 Y + O2 ⇄ ⅔Y2O3 | (10) |
| Zr + O2 ⇄ ZrO2. | (11) |
Once more, stable conditions for EuO and YSZ are marked by the hatched areas in Fig. 6(b). In contrast to Fig. 6(a), these areas largely overlap signalling thermodynamic stability. HAXPES data of the Zr 3d core level (see ESI†) shows only Zr4+, which is the expected valence in YSZ, so that we can conclude that the buffer layer is homogeneous and, indeed, chemically stable.
Recalling the results on sample type (ii), the 2 nm thick YSZ buffer layer clearly improved the EuO stoichiometry. Thus, the buffer layer acts as a kinetic barrier that reduces oxygen diffusion. However, over-oxidized phases are still present at the EuO–YSZ interface. This means that the buffer layer is not a perfect diffusion barrier which is presumably due to the oxygen permeability of YSZ37,38 (Fig. 7(b)).
Lowering the growth temperature reduces oxygen diffusion more effectively. A homogeneous EuO film containing 60% stoichiometric EuO is obtained (sample type (iii)) but, in turn, the chemical composition of the ITO virtual substrate is substantially modified. After EuO synthesis, In metal is detected at the EuO/ITO interface (Fig. 7(c)). The observed reduction of ITO to In metal can solely be explained by the thermodynamic instability of ITO in contact with EuO as derived from Fig. 6(a).
As a last point, we address the fact that the reduction of ITO to In metal occurs only for sample type (iii), but not for types (i) and (ii). In the latter cases, a surplus of oxygen is present above the interface, but no oxygen deficiency is observed in the ITO substrate. We conclude, that oxygen vacancies occur at the surface of the ITO virtual substrate, but diffuse by thermal activation and are, thus, diluted below a measurable concentration. In the case of sample type (iii), the ITO virtual substrate suffers a significant oxygen depletion at the interface. Due to the reduced oxygen mobility at room temperature, these vacancies are not replenished and metallic In is present at the interface.
4 Conclusions
In summary, our study successfully combined a fundamental thermodynamical analysis in terms of solid state chemistry with HAXPES as a modern spectroscopy tool. Applying the non-destructive HAXPES technique yields a deep understanding of the chemical processes at the interfaces of the prototypical all-oxide hybrid EuO/ITO.We have shown that ITO virtual substrates act as thermally activated, additional source of oxygen during reactive MBE growth of ferromagnetic EuO. At elevated growth temperatures over-oxidized phases with inferior magnetic properties were formed. Accordingly, the EuO growth was optimized by lowering the growth temperature. If synthesized at room temperature, EuO films show significantly improved chemical quality with sizeable magnetic properties.
Our thermodynamic analysis of oxygen reactions at the EuO–ITO-interface supports the presented HAXPES measurements. It is therefore promising to apply this approach to other oxide–oxide interfaces, in particular to calculate ΔrG0 accordingly for all oxygen reactions of the metals M involved:
 | (12) |
Moreover, the oxygen conductivity turns out to be a major criterion for carefully choosing materials and synthesis temperatures. Generally, our methodical approach may serve as guideline for optimizing the growth and the interface properties of all-oxide heterostructures.
Acknowledgements
We acknowledge S. Döring for experimental support as well as O. Petracic and the Jülich Centre for Neutronscience for providing measurement time at the SQUID magnetometer. MM acknowledges financial support by HGF under contract No. VH-NG-811.References
- M. Müller, G.-X. Miao and J. S. Moodera, Europhys. Lett., 2009, 88, 47006 CrossRef.
- G.-X. Miao, M. Müller and J. S. Moodera, Phys. Rev. Lett., 2009, 102, 076601 CrossRef PubMed.
- R. B. H. Tahar, T. Ban, Y. Ohya and Y. Takahashi, J. Appl. Phys., 1998, 83, 2631–2645 CrossRef.
- M. Matsubara, A. Schmehl, J. Mannhart, D. G. Schlom and M. Fiebig, Phys. Rev. B, 2012, 86, 195127 CrossRef.
- Epitaxial Growth of Complex Metal Oxides, ed. G. Koster, M. Huijben and G. Rijnders, Woodhead Publishing, 1st edn, 2015 Search PubMed.
- P. G. Steeneken, PhD thesis, Rijksuniversiteit Groningen, Groningen, Netherlands, 2002.
- R. W. Ulbricht, A. Schmehl, T. Heeg, J. Schubert and D. G. Schlom, Appl. Phys. Lett., 2008, 93, 102105 CrossRef.
- R. Sutarto, S. G. Altendorf, B. Coloru, M. Moretti Sala, T. Haupricht, C. F. Chang, Z. Hu, C. Schüßler-Langeheine, N. Hollmann, H. Kierspel, H. H. Hsieh, H.-J. Lin, C. T. Chen and L. H. Tjeng, Phys. Rev. B, 2009, 79, 205318 CrossRef.
- D. F. Förster, J. Klinkhammer, C. Busse, S. G. Altendorf, T. Michely, Z. Hu, Y.-Y. Chin, L. H. Tjeng, J. Coraux and D. Bourgault, Phys. Rev. B, 2011, 83, 045424 CrossRef.
- C. Caspers, M. Müller, A. X. Gray, A. M. Kaiser, A. Gloskovskii, C. S. Fadley, W. Drube and C. M. Schneider, Phys. Rev. B, 2011, 84, 205217 CrossRef.
- C. Caspers, A. Gloskovskij, W. Drube, C. M. Schneider and M. Müller, Phys. Rev. B, 2013, 88, 245302 CrossRef.
- C. Caspers, S. Flade, M. Gorgoi, A. Gloskovskii, W. Drube, C. M. Schneider and M. Müller, J. Appl. Phys., 2013, 113, 17C505 CrossRef.
- A. Schmehl, V. Vaithyanathan, A. Herrnberger, S. Thiel, C. Richter, M. Liberati, T. Heeg, M. Röckerath, L. F. Kourkoutis, S. Mühlbauer, P. Böni, D. A. Muller, Y. Barash, J. Schubert, Y. Idzerda, J. Mannhart and D. G. Schlom, Nat. Mater., 2007, 6, 882–887 CrossRef CAS PubMed.
- D. V. Averyanov, Y. G. Sadofyev, A. M. Tokmachev, A. E. Primenko, I. A. Likhachev and V. G. Storchak, ACS Appl. Mater. Interfaces, 2015, 7, 6146–6152 CAS.
- K. J. Hubbard and D. G. Schlom, J. Mater. Res., 1996, 11, 2757–2776 CrossRef CAS.
- D. G. Schlom and J. H. Haeni, MRS Bull., 2002, 27, 198–204 CrossRef CAS.
- L. P. H. Jeurgens, W. G. Sloof, F. D. Tichelaar and E. J. Mittemeijer, Phys. Rev. B, 2000, 62, 4707–4719 CrossRef CAS.
- T. Mairoser, J. A. Mundy, A. Melville, D. Hodash, P. Cueva, R. Held, A. Glavic, J. Schubert, D. A. Muller, D. G. Schlom and A. Schmehl, Nat. Commun., 2015, 6, 7716 CrossRef CAS PubMed.
- C. Fadley, J. Electron Spectrosc. Relat. Phenom., 2010, 178, 2–32 CrossRef.
- J. Zegenhagen, Eur. Phys. J.: Appl. Phys., 2015, 70, 20701 CrossRef.
- H. Ohta, M. Orita, M. Hirano, H. Tanji, H. Kawazoe and H. Hosono, Appl. Phys. Lett., 2000, 76, 2740–2742 CrossRef CAS.
- C. Buchal, L. Beckers, A. Eckau, J. Schubert and W. Zander, Mater. Sci. Eng., B, 1998, 56, 234–238 CrossRef.
- C. Caspers, PhD thesis, Universität Duisburg-Essen, Duisburg, Germany, 2013.
- M. Gorgoi, S. Svensson, F. Schäfers, G. Öhrwall, M. Mertin, P. Bressler, O. Karis, H. Siegbahn, A. Sandell, H. Rensmo, W. Doherty, C. Jung, W. Braun and W. Eberhardt, Nucl. Instrum. Methods Phys. Res., Sect. A, 2009, 601, 48–53 CrossRef CAS.
- E.-J. Cho, S.-J. Oh, S. Imada, S. Suga, T. Suzuki and T. Kasuya, Phys. Rev. B, 1995, 51, 10146–10149 CrossRef CAS.
- M. Quaas, H. Steffen, R. Hippler and H. Wulff, Surf. Sci., 2003, 540, 337–342 CrossRef CAS.
- M. Burgener and A. Goldmann, Surf. Sci., 2003, 540, 89–96 CrossRef CAS.
- V. Christou, M. Etchells, O. Renault, P. J. Dobson, O. V. Salata, G. Beamson and R. G. Egdell, J. Appl. Phys., 2000, 88, 5180–5187 CrossRef CAS.
- J. F. Watts and J. Wolstenholme, An Introduction to Surface Analysis by XPS and AES, Wiley-VCH, 1st edn, 2003 Search PubMed.
- C. J. Powell and A. Jablonski, Nucl. Instrum. Methods Phys. Res., Sect. A, 2009, 601, 54–65 CrossRef CAS.
- NIST Database for the Simulation of Electron Spectra for Surface Analysis, Version 2.0, ed. W. Werner, W. Smekal and C. J. Powell, National Institute of Standards and Technology, 2014 Search PubMed.
- R. J. Konings, O. Beneš, A. Kovács, D. Manara, D. Sedmidubský, L. Gorokhov, V. S. Iorish, V. Yungman, E. Shenyavskaya and E. Osina, J. Phys. Chem. Ref. Data, 2014, 43, 013101 CrossRef.
- W. M. Haynes, CRC Handbook of Chemistry and Physics, CRC press, 95th edn, 2013 Search PubMed.
- R. Schiller and W. Nolting, Phys. Rev. Lett., 2001, 86, 3847–3850 CrossRef CAS PubMed.
- M. Müller, G.-X. Miao and J. S. Moodera, J. Appl. Phys., 2009, 105, 07C917 CrossRef.
- H. J. T. Ellingham, J. Soc. Chem. Ind., London, 1944, 63, 125 CrossRef CAS.
- P. Manning, J. Sirman, R. D. Souza and J. Kilner, Solid State Ionics, 1997, 100, 1–10 CrossRef CAS.
- K. L. Ngai, J. Santamaria and C. Leon, Eur. Phys. J. B, 2013, 86, 1–10 CrossRef.
Footnotes |
| † Electronic supplementary information (ESI) available: Additional HAXPES data and details on the fitting procedures. See DOI: 10.1039/c6tc00170j |
| ‡ Present address: Department of Chemistry, George Washington University, Washington, District Of Columbia, USA. |
| § We note that ITO is stable under these conditions (see Fig. 6). |
| ¶ From the data in ref. 26 the diffusion coefficient was extrapolated to be 1.5 × 10⁻¹⁷ cm2 s−1 at room temperature. |
|| IITO takes both ITO components i.e. In3+ and Sn![[thin space (1/6-em)]](https://www.rsc.org/images/entities/char_2009.gif) : :![[thin space (1/6-em)]](https://www.rsc.org/images/entities/char_2009.gif) In3+ into account (see ESI†). In3+ into account (see ESI†). |
| ** EALs are calculated with formula (8) of ref. 30. The therefor necessary inelastic mean free path (IMFP) and transport mean free path (TMFP) were simulated in SESSA.31 |
| This journal is © The Royal Society of Chemistry 2016 |

