
 Open Access Article
 This Open Access Article is licensed under a
 Creative Commons Attribution 3.0 Unported Licence
Drug delivery and controlled release from biocompatible metal–organic frameworks using mechanical amorphization†
Claudia
Orellana-Tavra
a,
Ross J.
Marshall
b,
Emma F.
Baxter
c,
Isabel Abánades
Lázaro
b,
Andi
Tao
a,
Anthony K.
Cheetham
c,
Ross S.
Forgan
 *b and
David
Fairen-Jimenez
*a
*b and
David
Fairen-Jimenez
*a
aAdsorption & Advanced Materials (AAM) Laboratory, Department of Chemical Engineering & Biotechnology, University of Cambridge, Pembroke Street, Cambridge CB2 3RA, UK. E-mail: df334@cam.ac.uk; Web: http://people.ds.cam.ac.uk/df334
bWestCHEM School of Chemistry, University of Glasgow, Joseph Black Building, University Avenue, Glasgow, G12 8QQ, UK. E-mail: ross.forgan@glasgow.ac.uk
cDepartment of Materials Science and Metallurgy, University of Cambridge, CB3 0FS Cambridge, UK
First published on 3rd November 2016
Abstract
We have used a family of Zr-based metal–organic frameworks (MOFs) with different functionalized (bromo, nitro and amino) and extended linkers for drug delivery. We loaded the materials with the fluorescent model molecule calcein and the anticancer drug α-cyano-4-hydroxycinnamic acid (α-CHC), and consequently performed a mechanical amorphization process to attempt to control the delivery of guest molecules. Our analysis revealed that the loading values of both molecules were higher for the MOFs containing unfunctionalized linkers. Confocal microscopy showed that all the materials were able to penetrate into cells, and the therapeutic effect of α-CHC on HeLa cells was enhanced when loaded (20 wt%) into the MOF with the longest linker. On one hand, calcein release required up to 3 days from the crystalline form for all the materials. On the other hand, the amorphous counterparts containing the bromo and nitro functional groups released only a fraction of the total loaded amount, and in the case of the amino-MOF a slow and progressive release was successfully achieved for 15 days. In the case of the materials loaded with α-CHC, no difference was observed between the crystalline and amorphous form of the materials. These results highlight the necessity of a balance between the pore size of the materials and the size of the guest molecules to accomplish a successful and efficient sustained release using this mechanical ball-milling process. Additionally, the endocytic pathway used by cells to internalize these MOFs may lead to diverse final cellular locations and consequently, different therapeutic effects. Understanding these cellular mechanisms will drive the design of more effective MOFs for drug delivery applications.
1. Introduction
Traditional drugs in the form of small molecules circulate in the blood stream at high concentrations in order to reach the target tissue at the desired final concentration for serving their therapeutic effect. However, this practice has significant drawbacks, covering non-selective biodistribution and poor solubility, which often results in damage of healthy tissues1 and cardiotoxicity effects,2 strongly limiting their therapeutic potential. Several efforts in the drug delivery field have been pursued to overcome these side effects. By using a drug delivery system (DDS) it is possible to achieve a controlled release, to improve drug solubility issues, to confer protection from degradation and to accomplish a targeted delivery.3–5DDSs can traditionally be divided into two groups: (i) organic, such as polymers, micelles, liposomes and protein nanoparticles; and (ii) inorganic, such as zeolites and mesoporous silica nanoparticles.6 On one hand, the main advantage of the organic systems are their biocompatibility, whereas their principal drawback is their low loading capacities (typically up to 0.25 wt%).7 On the other hand, inorganic carriers possess well-defined porosity, resulting in high loadings (up to 40 wt%) and controlled release. However, their high stabilities make them difficult to degrade and subsequently remove after drug release.8 Metal–organic frameworks (MOFs) have appeared as promising DDSs due to their particular characteristics, such as high pore volumes, large surface areas, and tuneable pore size and surface chemistry.9,10 During the past decade several therapeutic compounds have been loaded in these materials for their use in different biological applications. Among others, nitric oxide has been loaded in MOFs for its use in antibacterial, antithrombotic and wound-healing applications;11 the anticancer cisplatin molecule and siRNA have been incorporated together in MOFs to enhance the therapeutic effect;12 numerous anticancer and antiviral agents have been loaded and released using MOFs and also by applying a heparin, cyclodextrin or chitosan coatings to Fe-based MOF it has been possible to improve their biological properties.13–16 Recently, an in vivo study of these MOF nanoparticles loaded with the anticancer drug busulfan showed improved pharmacokinetic (PK) properties compared with commercial solutions.17
Many times, the moderately low chemical and aqueous stability of MOFs has limited their scope for industrial applications such as CO2 removal in post-combustion processes.18 This drawback of MOFs is considered an advantage for drug delivery applications, as the MOF particles can be biodegraded and eliminated from the body after the drug is released. Nevertheless, there are still important limitations for their use due to the very fast kinetic delivery of up to 3 days from several drug–MOF complexes.13 In order to address that problem, we recently performed a mechanical amorphization process to extend the release time of the fluorescent molecule (calcein) from 2 to more than 30 days in the Zr-based MOF UiO-66 (UiO standing for University of Oslo).19,20 This amorphous solid was obtained using a ball-milling process in order to collapse the porosity around the adsorbed guest molecules, generating a highly disordered material while conserving the basic metal-linker connectivity of the original crystalline material, but lacking long range order.21–24
Here, we have extended our previous study on controlled release to a family of Zr-based MOFs (Fig. 1a) to analyse the potential of the technology. We also used confocal microscopy to confirm the successful incorporation of MOFs into the cells. We analysed the loading and release of calcein and the anticancer drug α-cyano-4-hydroxycinnamic acid (α-CHC) (Fig. 1b) in the family of Zr-based MOFs. We used calcein as a model drug due to its structural similarities to doxorubicin, a well-known anti-cancer drug. Calcein is also a hydrophilic molecule, which means it cannot cross the cell membrane, and therefore it needs a DDS for its efficient intracellular transport. In addition, it is fluorescent and can be easily detected by confocal microscopy. Due to its self-quenching characteristics, high local concentrations of calcein (e.g. when it is adsorbed in a MOF before being released) cannot be detected until it is released from the material. α-CHC is a hydrophobic molecule derived from cinnamic acid and it has shown the ability to inhibit the protein monocarboxylate transporter 1 (MCT1).25,26 This protein is a potential target for cancer therapy as it has been reported to be upregulated in colorectal and other types of cancer.27–29
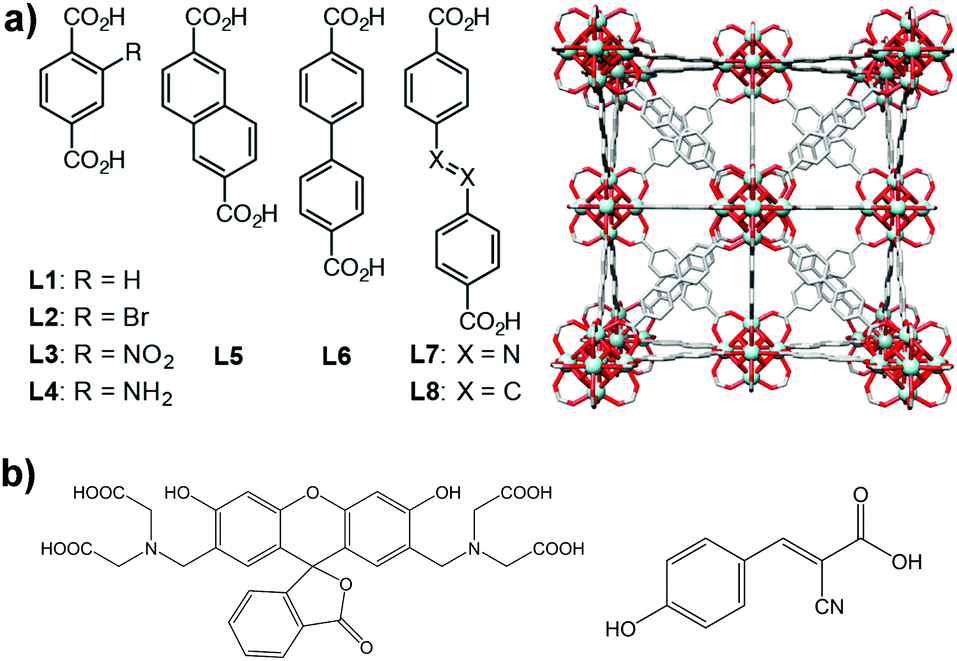 | ||
| Fig. 1 (a) Chemical structure of the organic linkers used to synthesize the different Zr-based MOFs (left) and packing structure of Zr–L6 (right); (b) chemical structure of guest molecules, calcein (left) and α-CHC (right). | ||
2. Experimental section
Materials
Zirconium tetrachloride (ZrCl4, 99.5%), terephthalic acid (BDC, 98%) and naphthalene-2,6-dicarboxylic acid were bought from Alfa Aesar (UK). Benzoic acid (99.5%), HCl (37%), dimethylformamide (DMF, 99.8%), L-proline, 2-aminoterephthalic acid, methanol (99.9%), acetone (99.9%), calcein disodium salt and α-cyano-4-hydroxycinnamic acid (α-CHC) were obtained from Sigma-Aldrich (UK). 2-Bromoterephthalic acid and 2-nitroterephthalic acid were obtained from Acros Organics. Azobenzene-4,4′-dicarboxylic acid and 4,4′-stilbenedicarboxylic acid were bought from TCI UK. 4,4′-Biphenyldicarboxylic acid was obtained from Fluorochem.HeLa cells were obtained from the ATCC. Dulbecco's modified Eagle's medium (DMEM), foetal bovine serum (FBS), L-glutamine, penicillin, and streptomycin were purchased from Invitrogen (UK). Phosphate-Buffered Saline (PBS) and trypsin–EDTA, were purchased from Life Technologies™ (UK). The CellTiter 96® Aqueous One Solution Cell Proliferation Assay (MTS) was obtained from Promega (UK). All chemicals and biochemicals used were of analytical grade.
Instruments
All PXRD data were collected in Bragg–Brentano geometry on a D8 Bruker diffractometer equipped with a primary Ge monochromator for Cu Kα1 and a Sol-X solid state detector. Collection conditions were: 2–50° in 2θ, 0.02° step size, 15 seconds per step, divergence slits 0.2 mm, receiving slit 0.2 mm. Samples for scanning electron microscopy (SEM) were scattered onto spectroscopically pure carbon tabs (TAAB Ltd UK) and mounted on aluminium stubs. They were coated with 15 nm of gold in a Quorum Emitech K575X sputter coater to make them electrically conductive. They were imaged in an FEI XL30 FEGSEM, operated at 5 keV, using an Everhart Thornley secondary electron detector. Colloidal analysis was determined by dynamic light scattering (DLS) with a Brookhaven Zeta Plus potential analyser (detection angle of 90° and a 35 mW laser). The measurements were performed in phosphate-buffered saline (PBS) and growth media at room temperature. Thermogravimetric analysis (TGA) was performed using a TA Instruments Q-500 series thermal gravimetric analyzer, with the sample (0.7–2 mg) held on a platinum pan under a continuous flow of dry N2 gas. TGA curves were obtained using a heating rate of 5 °C min−1 up to 600 °C. Fourier transform infrared spectroscopy (FTIR) spectra were recorded in the range 4000–500 cm−1 (Perkin Elmer, Spectrum Two). N2 adsorption isotherms were carried out at 77 K on a Quantachrome Autosorb iQ gas sorption analyser. Samples were degassed under vacuum at 120 °C for 20 h using the internal turbo pump.Synthesis and characterization
Zr–L2 to Zr–L4 were synthesised by adding the required linker (2.70 mmol, 1 eq.) and ZrCl4 (0.629 g, 2.70 mmol, 1 eq.) to 250 mL reagent bottles. DMF (60 mL) and hydrochloric acid (0.24 mL) were added and the mixture was sonicated for 10 minutes before being placed in the oven at 120 °C for 24 h. After this time the bottles were removed and allowed to cool to room temperature. The product was collected by centrifugation, washed with DMF (30 mL) and acetone (2 × 30 mL). The samples were placed in a vacuum desiccator to dry.Zr–L5 to Zr–L8 were synthesised by adding L-proline (1.554 g, 13.50 mmol, 5 eq.), the required linker (2.70 mmol, 1 eq.) and ZrCl4 (0.629 g, 2.70 mmol, 1 eq.) to 250 mL reagent bottles. DMF (60 mL) and hydrochloric acid (0.24 mL) were added and the mixture was sonicated for 10 minutes before being placed in the oven at 120 °C for 24 h. After this time the bottles were removed and allowed to cool to room temperature. The product was collected by centrifugation, washed with DMF (30 mL) and acetone (2 × 30 mL). The samples were placed in a vacuum desiccator to dry.
Zr–L1 to Zr–L4 nanoparticles were obtained following the protocol from Zhu et al.22 with minor modifications. ZrCl4 (0.466g, 2.00 mmol), the required linker (1.93 mmol), (Zr–L1: terephthalic acid (BDC); Zr–L2: 2-bromoterephthalic acid (Br-BDC); Zr–L3: 2-nitroterephthalic acid (NO2-BDC); and Zr–L4: 2-aminoterephthalic acid (NH2-BDC)), benzoic acid (2.44 g, 20.00 mmol) and 0.33 mL of HCl 37% were dissolved in 36 mL of DMF. The mixture was placed in a 50 mL autoclave and heated at 120 °C for 48 h. After cooling down to room temperature, the powder corresponding to each MOF was harvested by centrifugation at 5500 rpm for 20 min and washed with DMF at room temperature. The particles were then dispersed and washed with DMF in order to remove the unreacted linker. The same procedure was repeated with acetone in order to remove the DMF solvent from the sample. Finally, the solids were dried at 37 °C in a vacuum oven overnight.
Zr–L5 and Zr–L6 nanoparticles were obtained via solvothermal reaction conditions modifying a reported protocol.30 Zirconyl chloride octahydrate (213 mg, 0.66 mmol) was dissolved in 25 mL of DMF. Separately, the required linker (Zr–L5: naphthalene-2,6-dicarboxylic acid, NDC; Zr–L6: 4,4′-biphenyldicarboxylic acid, BPDC) (352 mg, 1.63 mmol) was dissolved in 15 mL of DMF. Both reagent solutions were mixed together in a 100 mL jar, then acetic acid (2.6 mL) was added to the reaction mixture, which was stirred and placed in the oven at 120 °C for 24 h. On cooling, the nanoparticles were isolated by centrifugation (4500 rpm, 20 min), and purified by dispersion–centrifugation cycles with DMF (×2) and methanol (×3). The solids were dried in the high vacuum desiccator for 24 h.
Activation
The powder MOF samples were added to 50 mL PYREX reagent bottles. THF (30 mL) was added and the jars were placed in the oven at 50 °C. The THF was exchanged for fresh THF over 4 consecutive days. The THF was then removed and the MOFs were dried in a vacuum desiccator.Simulations
Grand canonical Monte Carlo (GCMC) simulations were employed to obtain the N2 adsorption isotherms at 77 K for the series of Zr-based MOFs. We used an atomistic model for all MOF structures, in which the framework atoms were kept fixed at their crystallographic positions. N2–N2 and N2–MOF interactions were calculated with a Lennard-Jones (LJ) + Coulomb potential. The LJ potential parameters for the framework atoms were adopted from Dreiding31 force field except for Zr atoms, which were taken from UFF.32 N2 molecules were described by the TraPPE model.33 The simulation box consisted of 8 unit cells (2 × 2 × 2) for Zr–L1 to Zr–L4, and 1 unit cell (1 × 1 × 1) for the rest of the MOFs. Lorentz–Berthelot mixing rules were used for all cross terms. A cut-off radius of 12.8 Å was applied to the Lennard-Jones (LJ) interactions, while the long-range electrostatic interactions were handled by the Ewald summation technique. Periodic boundary conditions were applied in all three dimensions. A Peng–Robinson equation of state was used to convert the pressure to the corresponding fugacity used in the GCMC simulations.34 For each state point, GCMC simulations consisted of 2 × 10⁴ Monte Carlo cycles to guarantee equilibration, followed by another 2 × 10⁴ production cycles to calculate the ensemble averages. A cycle consists of “n” Monte Carlo steps; where “n” was equal to the number of molecules (which fluctuates during a GCMC simulation). All simulations included random insertion, deletion, translation and rotation moves of molecules with equal probabilities. GCMC simulations report the absolute adsorption data which are then used to compute the excess adsorption data for comparison with experimental data using the relation from eqn (1):| Ntotal = Nexcess + ρgas × Vp | (1) |
BET analysis
BET method was used to perform the surface area analysis of the MOFs.37 The monolayer capacity νm was calculated from the adsorption isotherm using the BET eqn (2):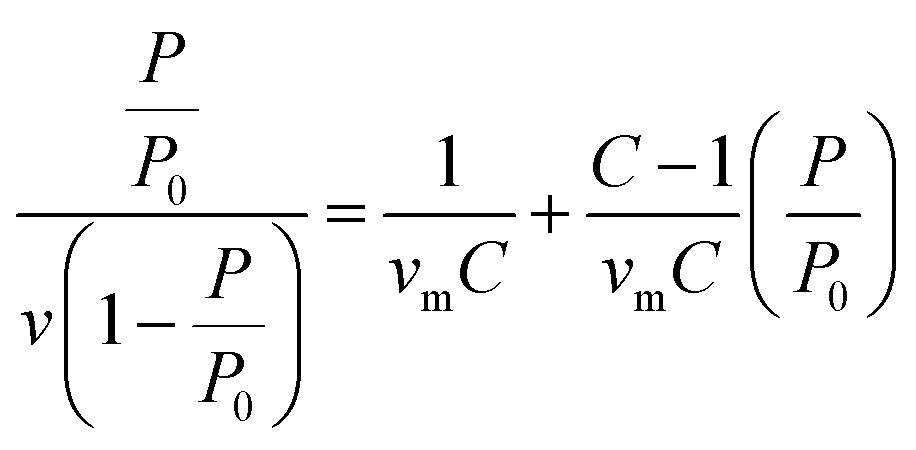 | (2) |
Stability
Linker release experiments were performed in an incubator at 37 °C with orbital agitation and using phosphate buffered saline (PBS, 10 mM) at pH 7.4 in order to simulate physiological conditions or water. 5 mg of empty MOF was placed into a dialysis bag (Medicell International, MWCO molecular weight cut-off 3500 Da) with a total volume of 10 mL of PBS or water. At different times, 1 mL of liquid was taken and replaced with 1 mL of fresh PBS or water. The amount of linker released was measured using a UV-vis spectrophotometer at 240, 240, 225, 229, 284, 281 and 330 nm for Zr–L1 to Zr–L8, respectively. The corrected concentration of linker release is given by the eqn (3):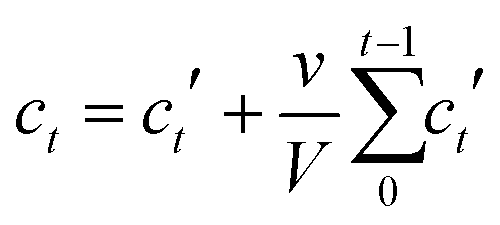 | (3) |
Drug loading experiments
Calcein adsorption was performed by soaking 100 mg of activated MOF in 25 mL of a methanolic calcein solution (5 mg mL−1) at 37 °C under orbital agitation for 6 days. The α-CHC loading was achieved by soaking 250 mg of solids in 25 mL of a methanolic α-CHC solution (10 mg mL−1) at room temperature under stirring. In both cases the loaded MOFs were collected by centrifugation at 5500 rpm for 20 minutes, washed twice with methanol, centrifuged again for 10 minutes and dried overnight at 80 °C to remove the solvent. The amount of calcein adsorbed was quantified by TGA and, in the case of α-CHC, a UV-vis spectrophotometer at 337 nm measured the amount of drug present in the supernatant after the first centrifugation step. The loaded amount is given by the eqn (4):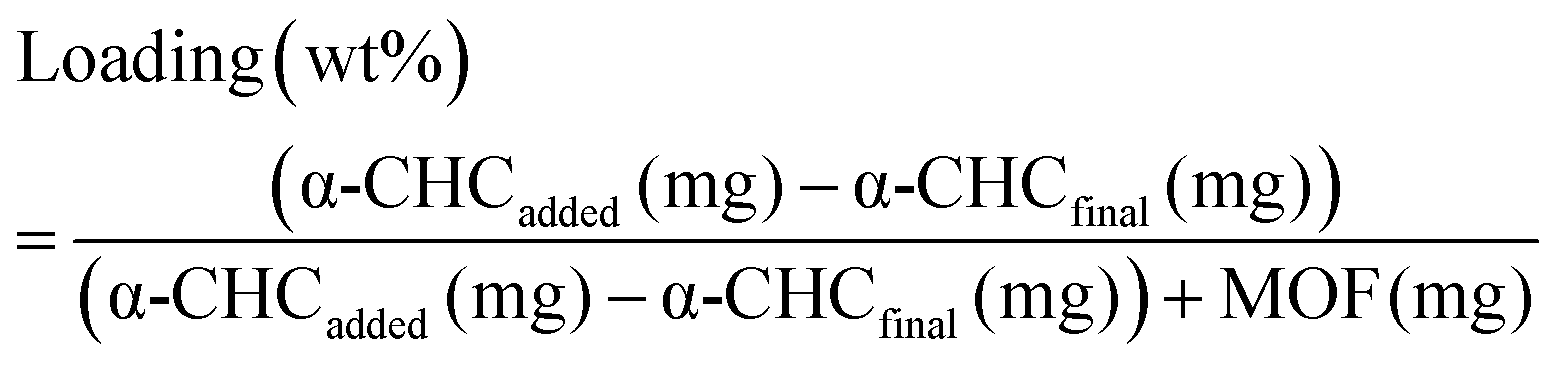 | (4) |
Amorphization
0.1 g of calcein or α-CHC loaded MOF was placed in a stainless steel jar along with an 8 mm stainless steel ball. The jar was then oscillated at 20 Hz for 30 minutes using a Retsch MM200 mill resulting in amorphous loaded MOF.Delivery
Calcein and α-CHC release experiments were performed in an incubator at 37 °C with orbital agitation and using phosphate buffered saline (PBS, 10 mM) at pH 7.4 in order to simulate physiological conditions. 5 mg of drug-loaded particles were placed into a dialysis bag (Medicell International, MWCO molecular weight cut-off 3500 Da) with a total volume of 10 mL of PBS. At different times, 1 mL of PBS was taken and replaced with 1 mL of fresh PBS. The amount of drug released was measured by using a UV-vis spectrophotometer at 498 and 337 nm for calcein and α-CHC, respectively. The corrected concentration of drug released is given by the eqn (3). Every experiment was performed in triplicate.Cell culture
HeLa cells were maintained at 37 °C with 5% CO2 in high rich glucose (4500 mg L−1) Dulbecco's modified Eagle's Medium (DMEM) supplemented with 10% (v/v) Fetal Bovine Serum (FBS), 2 mM L-glutamine, 100 units mL−1 penicillin and 100 μg mL−1 streptomycin. The cells were passaged three times a week (at 75–80% of confluence) at a density of 2.8 × 10⁴ cell per cm2.Cytotoxicity assay
The cytotoxicity activity of α-CHC, as well as empty and loaded Zr-based MOFs, was investigated using the 3-(4,5-dimethylthiazol-2-yl)-5-(3-carboxymethoxyphenyl)-2-(4-sulfophenyl)-2H-tetrazolium (MTS) (Promega, UK) reduction assay. The day before the experiment, the cells were seeded into a 96 well plate at a density of 5 × 10³ cells per well. Prior to the treatments, the cells were washed twice with PBS. The different MOF and α-CHC concentrations were dispersed in cell culture media. Then they were added to the cells and incubated for 24 h at 37 °C with 5% CO2. To measure the toxicity, the cells were washed extensively to remove the solids, the media was replace with 100 μL of fresh culture media containing 20 μL of MTS/phenazine methosulfate (in a proportion 20![[thin space (1/6-em)]](https://www.rsc.org/images/entities/char_2009.gif) :1) solution and the plate was incubated for 1 h and 15 min at 37 °C with 5% CO2. The plates were then read by UV-vis spectroscopy at 490 nm.
:1) solution and the plate was incubated for 1 h and 15 min at 37 °C with 5% CO2. The plates were then read by UV-vis spectroscopy at 490 nm.
LDH assay
Cell membrane integrity of HeLa cells after treatment with empty MOFs was measured using Pierce LDH Cytotoxicity Assay Kit (Thermo Scientific). The day before the experiment, the cells were seeded in to a 96 well plate at a density of 5 × 10³ cells per well. Prior to the treatments, the cells were washed twice with PBS. The different MOFs concentrations were dispersed in cell culture media, then added to the cells (110 μL) and incubated for 24 h at 37 °C with 5% CO2. The next day two controls were prepared: spontaneous LDH activity and maximum LDH activity controls. 10 μL of distilled water and 10 μL of Lysis buffer (10×), respectively, was added to a triplicate set of wells containing cells in 100 μL of complete growth media. The plate was incubated for 45 min at 37 °C with 5% of CO2. Consequently, 50 μL of each sample was transferred to a new 96-well plate. 50 μL of the reaction mixture (supplied by the provider) was added and the plate was incubated at room temperature for 30 min protected from light. To stop the reaction, 50 μL of the stop solution (supplied by the provider) was added and the absorbance was measured at 490 and 680 nm. To determine the LDH activity, the absorbance at 680 nm (background) was subtracted from the 490 nm absorbance. Finally, the toxicity was calculated using eqn (5): | (5) |
Confocal microscopy
HeLa cells were seeded in a NUNCTM imaging four-well plate at a density of 1.11 × 10⁵ cell per mL and incubated for 24 h at 37 °C with 5% CO2 in DMEM supplemented with 10% (v/v) Fetal Bovine Serum (FBS), 2 mM L-glutamine, 100 units mL−1 penicillin and 100 μg mL−1 streptomycin. The cells were then washed twice with PBS and incubated together with 0.5 mg mL−1 of each Zr-based MOF for 24 h. The MOFs were well dispersed in culture media before being added to the well plates containing the cells. Untreated cell and free calcein were included as controls (0.075 mg mL−1). After the incubation time, cells were washed several times to remove all the non-internalized particles. Cells were then incubated for 15 min with 5 μg mL−1 of Hoechst 33342 (H33342) and 1X of CellMask™ Orange to stain the nucleus and cell membrane, respectively. Cells were then washed extensively to remove the dyes and fresh media without phenol red was added to each sample. Finally, the four-well plate was placed on a Leica TCS SP5 confocal microscope to be imaged. The microscope was equipped with 405 diode, argon and HeNe lasers. Leica LAS AF software was used to analyse the images.3. Results and discussion
Zirconium-based MOFs have demonstrated reasonable aqueous stability.20,39 Zirconium also exhibits low toxicity; the lethal dose (LD50) of zirconyl acetate is ∼4.1 mg mL−1 in rats while the human body contains ∼300 mg of Zr and the amount daily ingested is ∼3.5 mg per day.40 Additionally, UiO-66 ([Zr6O4(OH)4(BDC)6], BDC = 1,4-benzenedicarboxylate) has an IC50 value on HeLa cells of 1.503 ± 0.154 mg mL−1 after 24 hours of exposure.19 This well-known MOF possess a cubic structure based on Zr-oxo clusters and BDC linkers, resulting in a large porosity (SBET = 1200 m2 g−1, Vp = 0.5 cm3 g−1) and two main cavities (ca. 11 and 8 Å diameter).41 The replacement of the original BDC linker by linkers with functional groups such as bromo, amino and nitro allows the modification of the adsorption properties of MOFs,42,43 whereas the use of longer organic linkers generates MOFs with larger pore volumes.9,44Fig. 1 highlights the eight different linkers used to construct the isoreticular Zr-based family of MOFs used during this study. We named these linkers as L1 to L8 where L1 is 1,4-benzenedicarboxylate (BDC), used for UiO-66, L2–L4 are functionalised forms of BDC and L5–L8 are extended linkers. We refer to the synthesized MOFs as Zr–Lx, where x denotes the identification number of the linker.3.1. Physical characterisation
We used powder X-ray diffraction (PXRD) to confirm the crystalline structure of the MOFs and compared them with the patterns predicted from single crystal X-ray structures.45,46 Fig. S1 (ESI†) shows the patterns of the synthesized MOFs, confirming the crystalline nature of each material. Scanning electron microscopy (SEM) images indicate that some of the MOFs grew in the form of interconnected crystals and that Zr–L1 was in the range of nanometers whereas Zr–L2 to –L8 were in the micron range (Fig. S2, ESI†).We analysed the porosity of the Zr-based MOFs by measuring their N2 adsorption isotherms, and compared them to the results obtained using grand canonical Monte Carlo (GCMC) simulations. Fig. 2 shows the comparison of the experimental and simulated N2 adsorption isotherms at 77 K for Zr–L1 and Zr–L7 while Fig. S3 (ESI†) presents the linear and semi-log isotherms for the all the MOFs. Based on the IUPAC classification, all the simulated curves represent Type I isotherms, typical of microporous materials, whereas the experimental ones are Type II, showing the presence of multilayer adsorption and occasionally saturation at high relative pressures (e.g.Zr–L1, Zr–L2, Zr–L4) due to the presence of interstitial spaces between particles and/or mesoporosity caused by the existence of crystalline defects, such as linker vacancies.47 The simulation results, with the exception of Zr–L4 and Zr–L6, overestimated experimental results at low partial pressures (below 0.1 P/P0). These discrepancies are attributed to an overestimation of the interactions between N2 and the MOFs.48,49 This effect is more appreciable in the case of the MOFs with smaller pore sizes (Zr–L1 to Zr–L4). Fig. S4 (ESI†) shows the comparison of pore size distributions (PSDs) calculated using QSDFT (slit pore, N2 at 77 K on carbon kernel) on the experimental N2 adsorption isotherms, with those obtained using a pure geometrical analysis based on crystallographic data (i.e. simulated). Experimental and simulated PSDs are in a reasonable good agreement. In general the simulated results underestimate the pore size for MOFs containing functional groups although they are in excellent agreement for MOFs containing elongated linkers. This probably reflects the fact that simulations consider a perfect framework, however functionalised MOFs present noticeable defects, as seen in their experimental adsorption isotherms.
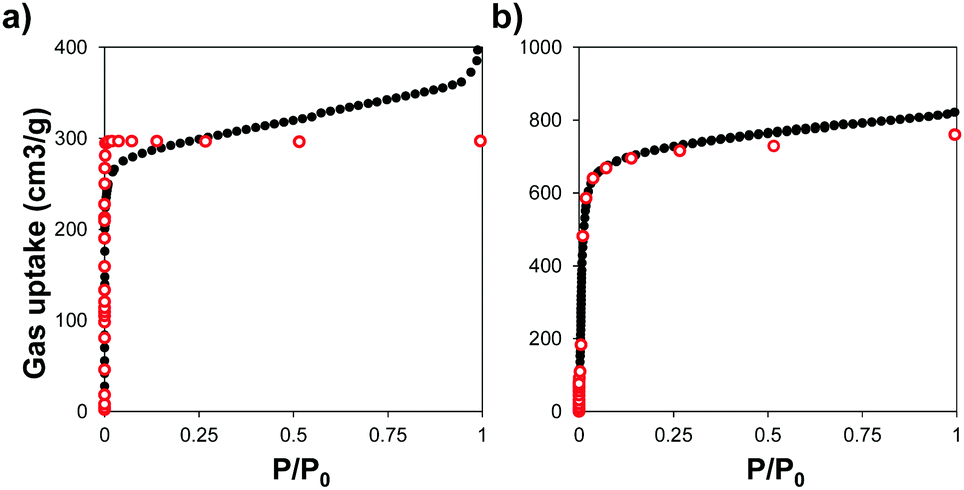 | ||
| Fig. 2 N2 adsorption isotherms measured at 77 K for (a) Zr–L1 and (b) Zr–L7. Experimental (black close dots) and GCMC simulated (red open dots) data. | ||
Table 1 shows the comparison of experimental and simulated BET areas. As expected, differences in the length of the linkers affect the BET areas, with experimental values ranging from 607 to 3024 m2 g−1 for Zr–L2 and Zr–L8, respectively. With the exception of Zr–L3 and Zr–L4, the experimental BET areas are lower than the simulated results, reaching in some cases differences of 20% (Zr–L7). This indicates experimental issues with the crystallinity of the MOFs and/or their activation. Overall, the porosity of the experimental samples seems to be described reasonably correctly by perfect crystalline models.
| MOF | Simulated BET area (m2 g−1) | Experimental BET area (m2 g−1) |
|---|---|---|
| Zr–L1 | 1288 | 1156 |
| Zr–L2 | 732 | 607 |
| Zr–L3 | 765 | 794 |
| Zr–L4 | 916 | 1031 |
| Zr–L5 | 1492 | 1295 |
| Zr–L6 | 3010 | 2483 |
| Zr–L7 | 3634 | 2907 |
| Zr–L8 | 3494 | 3024 |
3.2. Stability
In order to study the aqueous stability of the MOFs, we measured the release of the linker from the empty MOFs in phosphate-buffered saline (PBS) and water at different times. Fig. 3a and Fig. S5 (ESI†) show the degradation patterns for Zr–L3 and all the Zr-based family, respectively, confirming that all the MOFs were more stable in water than in PBS. As seen previously for UiO-66, UiO-66-Br and UiO-66-NH2, PBS accelerates the breakdown of the MOFs.50 Phosphate groups (PO43−) present in the PBS buffer attack the metal clusters of the MOF, substituting the carboxylic linkers, and finally disrupting the crystalline MOF structure. The crystallinity of the MOFs was evaluated after 2 days of PBS exposure by determining their PXRD pattern (Fig. 3b and Fig. S6, ESI†). The results showed that after the incubation time all of the MOFs were completely amorphous or at least part of their crystallinity was lost. In order to further study this phenomenon, the different MOFs were incubated for 2 and 3 days in PBS and then characterized using Fourier Transform Infrared Spectroscopy (FTIR) (Fig. 3c and Fig. S7, ESI†). In the original MOF, the intense signals between 1590 and 1400 cm−1 are attributed to carboxylate linkers; the triplet around 725 and 550 cm−1 is assigned to the Zr–O vibrational modes.51 In the PBS treated MOFs, FTIR showed the presence of phosphates groups around 1000 cm−1. An exchange of the linkers for phosphates groups has occurred, i.e. there is coordination between Zr and PO43−, as the intensity of the peaks from the phosphate groups increased over time while the carboxylate group decreased. As PO43− is an electrolyte present in the body, the MOFs are therefore expected to biodegrade with no accumulation in cells.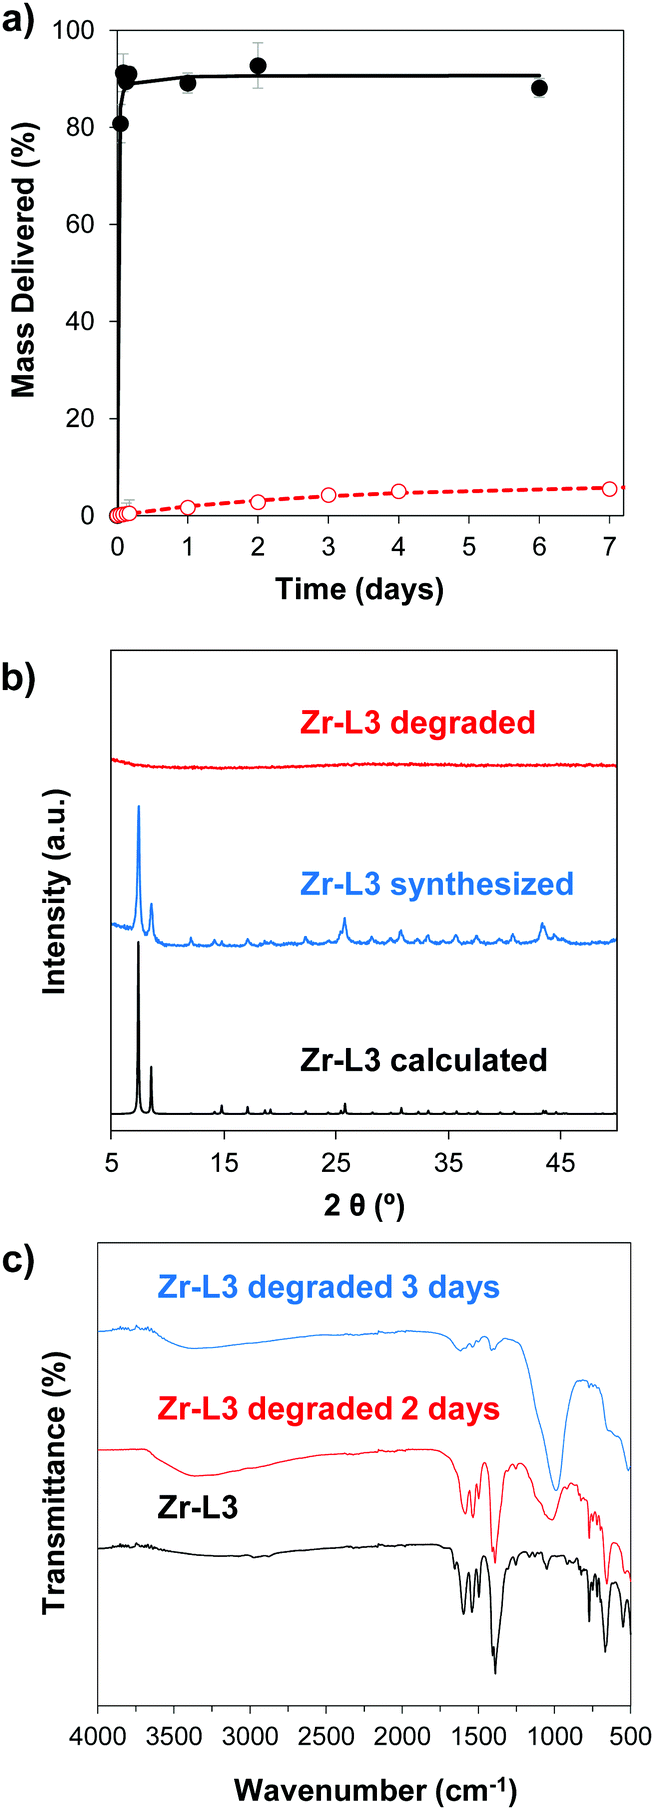 | ||
| Fig. 3 Stability analysis for Zr–L3. (a) Degradation pattern in PBS (black closed dots) and H2O (red open dots). (b) PXRD patterns of calculated Zr–L3 (black), synthesized (blue) and samples incubated for 2 days in PBS (red). (c) FTIR analysis after PBS exposure for 0 days (black), 2 days (red) and 3 days (blue). | ||
3.3. Cytotoxicity
Toxicity evaluation of the carriers is a key step in the development of an efficient DDS as it is crucial to reduce any undesired detrimental effect of the systems on cells. We also measured the effect of the organic linkers and zirconium salt, i.e. the individual building blocks after the MOF degradation. The effect of the MOFs on cells was determined by measuring the metabolic activity using the MTS reduction assay. Fig. 4 shows the viability values of Zr–L3 and L3 linker; Fig. S8a (ESI†) shows the viability values of the MOFs; all the MOFs were biocompatible except Zr–L8 where the cell viability decreased to ca. 60% at 0.1 mg mL−1 MOF concentration. For this reason Zr–L8 was discarded from further experiments. Fig. S8b shows the viability values for ZrCl4 and each linker; all the compounds were harmless to cells with the exception of L7. In this case, the viability decreased dramatically to ca. 40% when the cells where incubated with only 0.1 mg mL−1 of L7.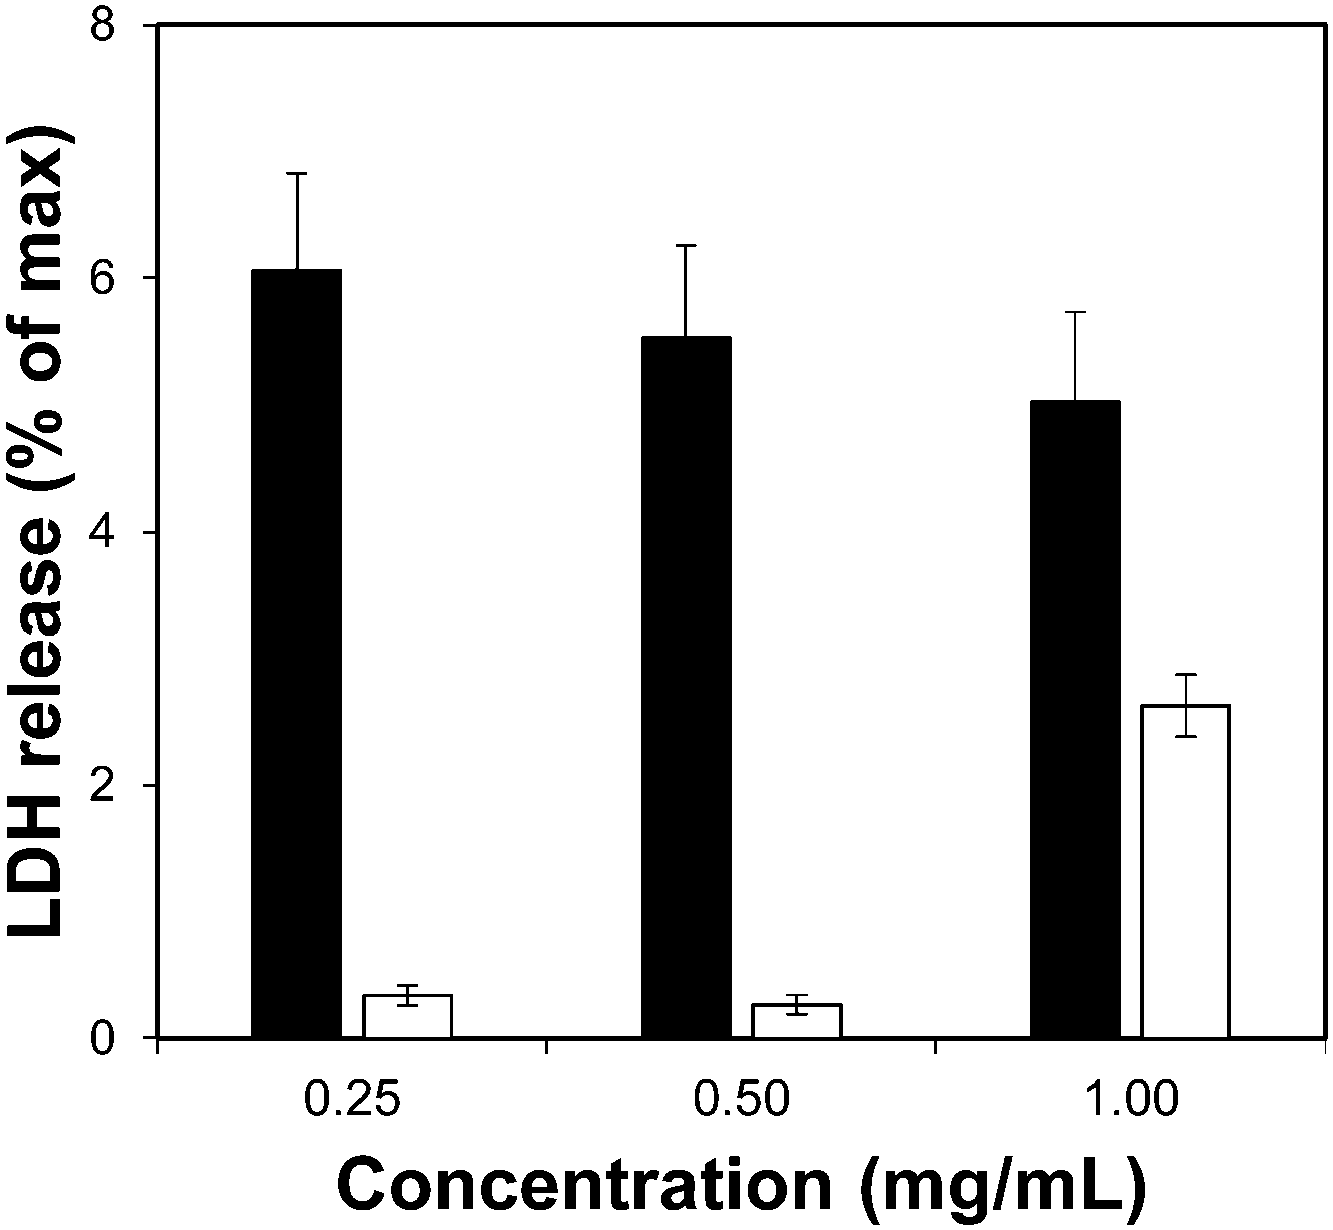 | ||
| Fig. 4 LDH assay for Zr–L3 (black bars) and L3 linker (white bars). The error bars represent the standard combined error of three independent samples. | ||
To complement the measurement of metabolic cellular activity obtained through the MTS assay, we evaluated the cell membrane integrity. For this purpose we quantified the amount of lactate dehydrogenase (LDH) enzyme released to the media from damaged cells.52Fig. 4 and Fig. S9a, b (ESI†) show the normalised levels of LDH released, for Zr–L3 and L3, all the MOFs, and all the building blocks, respectively, over the maximum amount of released LDH from lysed cells. LDH is a cytoplasmic enzyme present in several cell types and its release from normal cells is minimal – high levels of LDH in the extracellular media is therefore an indicator of cell membrane damage. The LDH release values obtained were extremely low compared with the control (i.e. lysed cells), and therefore it is possible to appreciate that neither the MOFs nor their components separately affected the permeability of the cells. Based on the two viability assays, Zr–L1 to Zr–L6 were selected for the drug adsorption experiments, as those are the most suitable MOFs for drug delivery applications in terms of biocompatibility.
3.4. Drug adsorption experiments
Calcein was loaded into the MOFs by soaking the solids in a methanolic calcein solution, generating the cal@Zr–Lx MOFs. We did not incorporate Zr–L1 into this analysis as we have previously studied this calcein loaded MOF in its crystalline and amorphous form.19 In parallel, we loaded the MOFs with α-CHC using a similar procedure, producing the α-CHC@Zr–Lx solids. In both cases the MOFs maintained the original crystalline structure after loading (Fig. S1, ESI†). Table 2 shows the different loading values for the two molecules used. The low loading values of calcein for Zr–L2 to Zr–L4 compared with Zr–L1 may be attributed to an impediment of the large calcein molecules accessing the cavities of the MOFs due to the presence of the functional groups in the pores, as reflected in their lower experimental and predicted BET surface areas. In the case of Zr–L5 and Zr–L6 MOFs with longer linkers, the amount adsorbed increased, reaching ∼15 wt% in the case of L6. Thus, a MOF with longer linker would be ideal to load larger molecules such as calcein. A similar effect can be observed for α-CHC where the loading in Zr–L1 is ca. 31 wt%, whereas when the MOFs are functionalised (Zr–L2 to Zr–L4) the loading decreased down to ca. 3–7 wt%. Although the length of α-CHC is approximately 10.6 Å, from the OH- to the COOH-group, and the width of the aromatic ring is 5.9 Å, which is comparable with the pore gate of Zr–L1. The presence of crystal defects such as missing linkers reported in Zr–L147,53 would allow the diffusion of the drug inside the MOF porosity. For the MOFs with longer linkers, the loading increased up to 20.3 wt% for Zr–L6. These loadings are in the same range as values reported for zeolites (i.e. 7–14 wt%).25| MOF | Calcein (wt%) | α-CHC (wt%) |
|---|---|---|
| Zr–L1 | 4.919 | 31.0 |
| Zr–L2 | 1.0 | 3.1 |
| Zr–L3 | 1.0 | 5.0 |
| Zr–L4 | 1.2 | 7.2 |
| Zr–L5 | 2.1 | 14.8 |
| Zr–L6 | 15.2 | 20.3 |
In order to control the drug release, we performed the amorphization of the loaded MOFs by using a ball-milling process, producing the cal@amZr–L1–6 and α-CHC@amZr–L1–6 MOFs. PXRD patterns of the amorphous MOFs are presented in Fig. S1 (ESI†); the disappearance of all the representative Bragg peaks confirms the success of ball-milling. Previous studies on mechanical and pressure-induced amorphization have demonstrated that the BET surface area of the amorphous MOFs decreased as a function of the amorphization time and pressure applied, respectively.23,54Fig. 5 shows the release profiles of calcein and α-CHC from amorphous and crystalline Zr–L4 and Zr–L5 respectively, whereas Fig. S11 (ESI†) shows the release profiles of both molecules for all the MOFs.
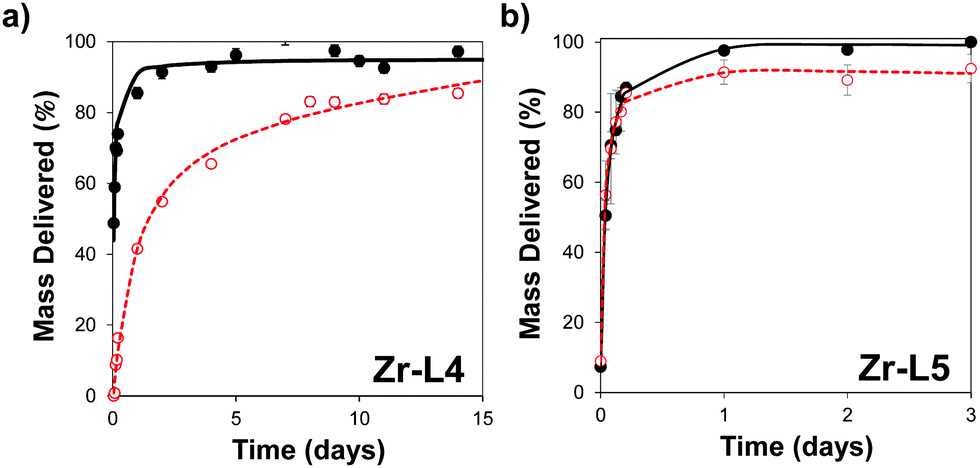 | ||
| Fig. 5 Release profile of (a) calcein from Zr–L4 and (b) α-CHC from Zr–L5. The crystalline MOF is presented in black closed dots and amorphous in red opened dots. Black solid and red dotted lines represent the kinetic of delivery fitting using non-linear regression on crystalline and amorphous MOFs, respectively. | ||
For calcein, the molecules were released from all the crystalline MOFs in approximately 2–3 days presenting a burst effect during the first hours of release, whereas the profiles from the amorphous MOFs were different in each case. For amZr–L2 and amZr–L3, the calcein molecules were trapped in the framework, and only a fraction of the total loaded amount, 63 and 68 wt%, respectively, was released. In the case of amZr–L4, a slower and progressive released was observed during 15 days. Finally, for Zr–L5 and Zr–L6 there was no significant difference between the crystalline and amorphous patterns. In the latter case of the MOFs with longer linkers, it is possible that after the ball-milling the porosity was not completely blocked, allowing the diffusion of guest molecules. Also, since the stability of loaded MOFs against the amorphization process increases,55Zr–L6, with a higher drug loading, might be affected differently by the amorphization process. As the particle size of the MOFs was not suitable for cellular uptake, it was not possible to perform confocal microscopy to visualise the slower in vitro release, particularly for Zr–L4 and amZr–L4.
Fitting of release patterns showed a simple hyperbolic curve for Zr–L3 to L6, amZr–L3 and amZr–L6, whereas Zr–L2, amZr–L2, amZr–L4 and amZr–L5 showed a two stage profile. Full details of the equations can be found in the ESI† (Tables S2 and S3). During the first stage of the delivery, the release of calcein occurs probably through desorption and diffusion from the porosity of the MOFs. The second release phase may be related with the partial dissolution of the amMOF to liberate the remnants of the encapsulated calcein. Only in the case of amZr–L4 does this two stage profile allow for a slower release of calcein.
α-CHC was delivered from all the crystalline MOFs in ca. 1 day presenting a burst effect during the first hours of release, except Zr–L3, which reached 94 wt% release after 3 days. No significant difference between the crystalline and amorphous patterns was observed. Here again, either the obstruction of the pore gates was not enough to avoid the diffusion of the small α-CHC molecules, or the loaded molecules increased the stability of the MOFs against the amorphization process.56 Fitting release patterns for these MOFs revealed a two-stage release for the crystalline and amorphous solids. This possibly is related with a higher interaction of the α-CHC molecules and the frameworks compared to calcein, where only Zr–L2 presented a two-stage release before the ball-milling process. The amorphization process did not contribute to any significant improvement in the delivery time. These results stress the importance of the system chosen for achieving a slow release using this technique. A balance between the pore size and the size of the guest molecules is crucial to have a successful sustained release through this mechanical ball-milling process.
3.5. Cellular uptake and in vitro experiments
In order to study in vitro the cellular uptake of the MOFs, we synthesised the selected MOFs on the nanoscale; for details of the synthesis procedure refer to the Experimental section. Fig. S12 (ESI†) shows the SEM images for all the nano-sized MOFs, confirming the nanoparticulate nature. Since the physicochemical characteristics of the particles can be modified in suspension,57,58 we measured the colloidal stability of the MOFs to determine their hydrodynamic diameter and to study the aggregation of particles in PBS and growth media.Table 3 shows the effective diameter in both media. It shows that the degree of aggregation was higher when the MOF particles were suspended in PBS compared to growth media. Since MOFs exhibit different degrees of hydrophobicity,41 they are prone to agglomerate in PBS. On the other hand, the adsorption of different kind of proteins from the growth media in the external surface of the MOF particles, forming a “protein corona”,59 might be the reason of their improved water stabilities. We also studied how the particle size of the MOFs affected the viability of cells by using an MTS cytotoxicity assay. Fig. S13 (ESI†) shows the viability values of HeLa cells after incubation with each nano-sized MOF in a concentration varying from 0 to 1 mg mL−1. None of the nano-sized MOFs presented any significant negative effect on cells.
| MOF | Effective diameter (nm) | |
|---|---|---|
| PBS | Growth media | |
| Zr–L1 | 831 ± 157 | 156 ± 6 |
| Zr–L2 | 709 ± 13 | 237 ± 157 |
| Zr–L3 | 961 ± 16 | 596 ± 18 |
| Zr–L4 | 828 ± 84 | 165 ± 1 |
| Zr–L5 | 1319 ± 247 | 86 ± 13 |
| Zr–L6 | 12742 ± 3319 | 137 ± 25 |
Fig. 6 shows the confocal microscopy images of HeLa cells incubated for 24 h with free calcein, and for all the nano-sized cal@MOFs. We used Hoechst 33342 (H33342) and CellMask™ Orange for staining the nucleus and the plasma membrane of the cells, respectively. Cells incubated with free calcein stained weakly in the form of bright vesicles at 24 h of incubation, suggesting that calcein is encapsulated in endosomes. Although calcein is considered impermeable to cell membranes, cellular uptake of impermeable dyes by endocytosis has been reported previously using Human Mesenchymal Stem Cells (MSCs) and the dye Lucifer yellow (LYCH).60 We have also observed this phenomenon previously.19 When cells were incubated together with the Zr-based MOFs, a strong signal was detected after 24 h, confirming that the MOF particles were successfully incorporated by cells. The punctate staining in the confocal images suggests MOF entrapment within intracellular vesicles. We can confirm that the MOFs are effectively inside the cells and not on the external part of the cell membrane because it is possible to visualize the cellular nucleus (blue), the MOF particles (green) and only the periphery of the cells in red, confirming that the image is an internal plane of the cells.
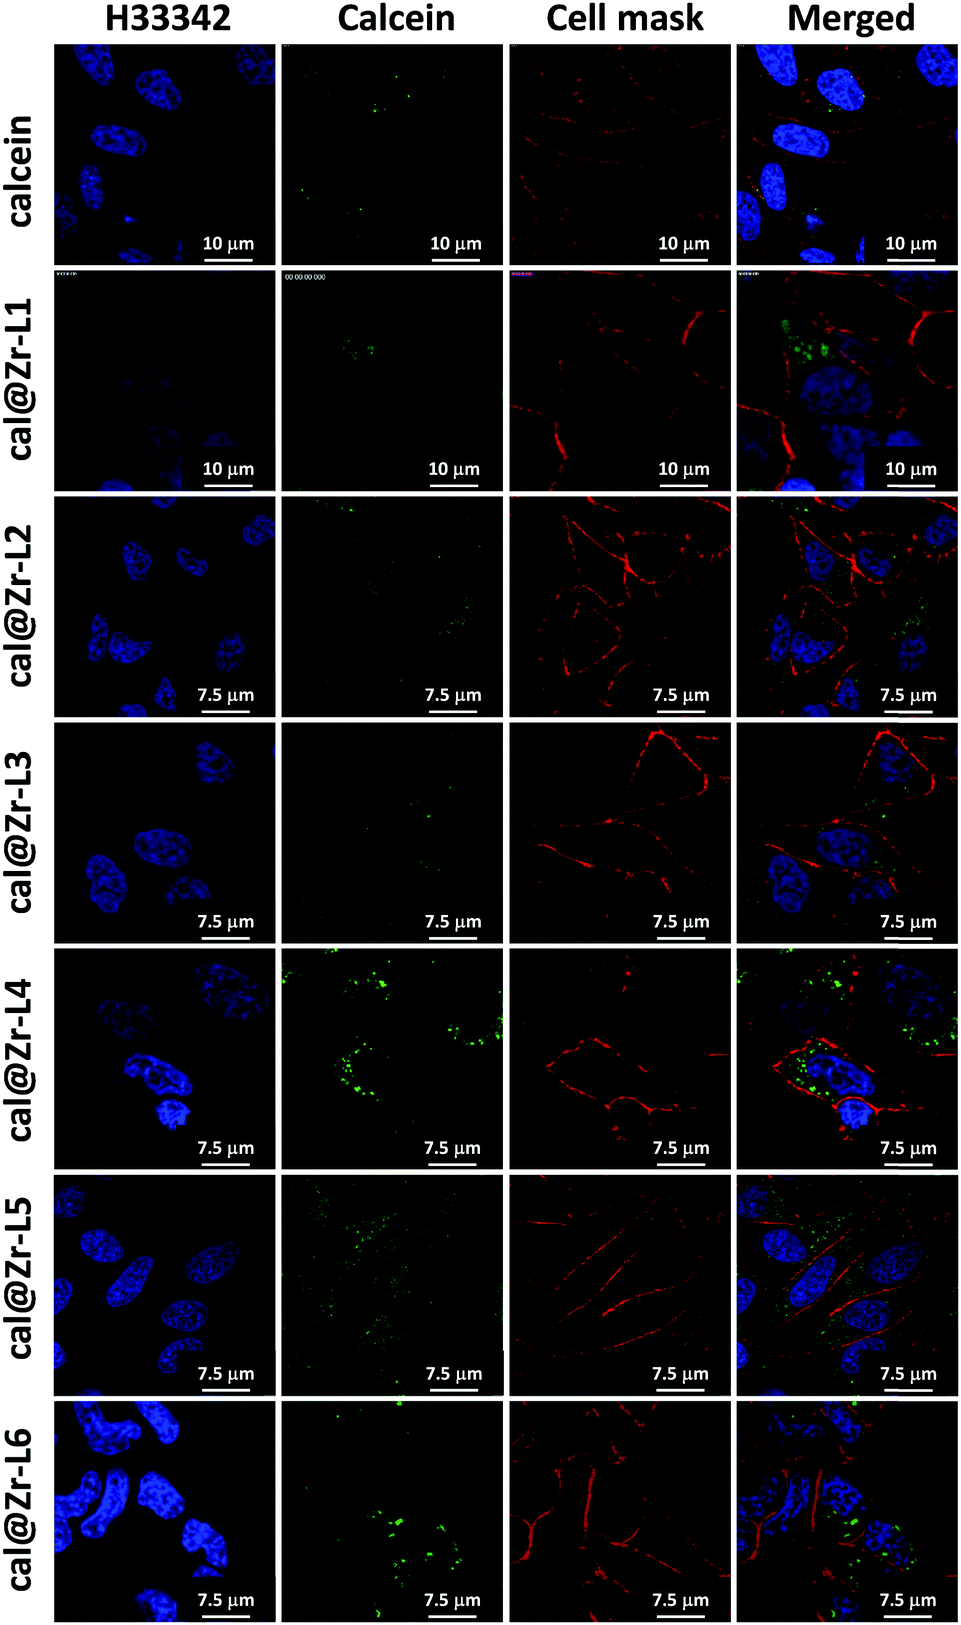 | ||
| Fig. 6 Confocal microscopy images of HeLa cells incubated independently with each Zr-based nano-sized MOF for 24 h. Cells were subsequently stained with Hoechst 33342 (5 μg mL−1) and CellMask™ Orange (1X). | ||
We also measured the therapeutic effect of α-CHC loaded in the nano-sized Zr-based MOFs by using an MTS assay. Table S4 (ESI†) presents the drug loading values, which are similar to those obtained for larger particle sizes. Fig. 7 presents the viability values for cells incubated for 24 h with either α-CHC@Zr–L1 or α-CHC@Zr–L6 at different concentrations compared with the empty corresponding MOF amount. Fig. S14 shows the analysis for the other Zr-based MOFs. The amount of MOF in the loaded samples was maintained at the same concentration as the empty MOFs (0.25, 0.5 and 1 mg mL−1) to allow comparison.
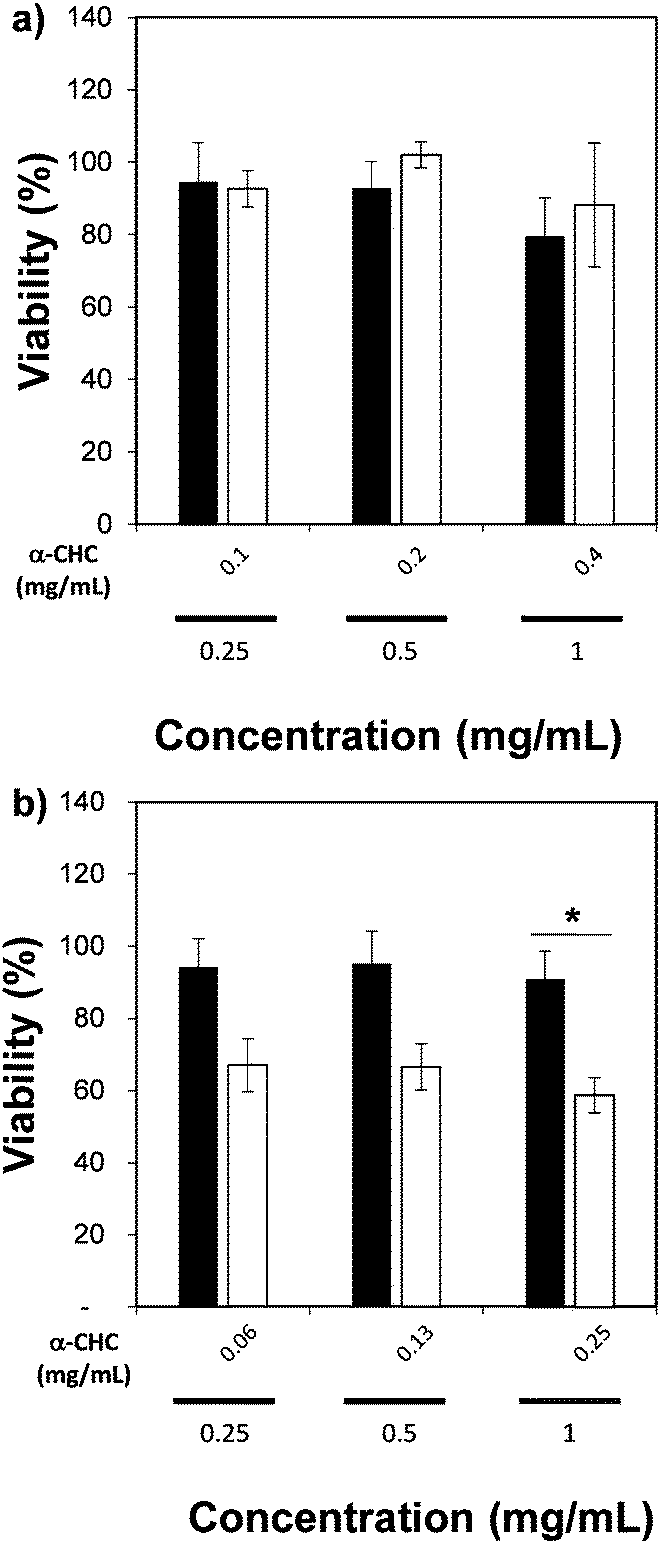 | ||
| Fig. 7 MTS assay of (a) α-CHC@Zr–L1, and (b) α-CHC@Zr–L6. * indicates P ≤ 0.05 in comparison with the empty Zr–L6 MOF (Student's test). Black bars correspond to empty MOF and white ones to loaded MOF. | ||
There was no significant difference in the viability for cells treated with empty and loaded Zr–L1 to Zr–L5 as the levels remained similar, over 80% for both conditions at equal concentration of MOF. In the case of Zr–L6, it presented a significant difference (P ≤ 0.05), down to 59 ± 5% viability, when cells were treated with 1 mg mL−1 of loaded MOF. A similar result was expected for Zr–L1 as its loading value was even higher than Zr–L6. A plausible explanation may be that cells are using different mechanisms for internalizing each MOF; different endocytic pathways may lead to diverse final destinations inside cells and thus, different therapeutic effects.61 Similar results have been found previously in other MOF studies, where there was no significance difference between using either free drug, empty MOFs or loaded MOFs.51,62,63 Future work studying the uptake mechanisms of these MOFs is currently in progress in order to allow a more efficient design of MOFs for this application.
4. Conclusions
We successfully synthesised and characterized a Zr-based family of MOFs. The MOFs are biocompatible in the concentration range evaluated and they were also able to penetrate into cells, demonstrating their potential use as a DDS. We carried out the adsorption of a fluorescent molecule (calcein) and a therapeutic agent (α-CHC) in these solids achieving different degrees of loading depending on the MOF and the guest molecule. Additionally, we have shown that by performing a mechanical amorphization it was possible to entrap calcein molecules in the MOFs and in the case of amZr–L4 achieve a slower release of up to 15 days. Finally, the therapeutic effect of α-CHC loaded in each Zr-based MOF was evaluated, resulting in an enhanced effect of the drug when loaded into Zr–L6. Future work on understanding the cellular internalization mechanism is needed to complement the design of MOF for drug delivery application.Acknowledgements
C. A. O. thanks Becas Chile and the Cambridge Trust for funding. D. F.-J. thanks the Royal Society (UK) for funding through a University Research Fellowship. RSF thanks the Royal Society for receipt of a University Research Fellowship and the EPSRC (EP/L004461/1) and The University of Glasgow for funding. A. K. C is grateful to the European Research Council for an Advanced Investigator Award.References
- L. Meng, X. Zhang, Q. Lu, Z. Fei and P. J. Dyson, Biomaterials, 2012, 33, 1689–1698 CrossRef CAS PubMed.
- R. Erttmann, N. Erb, A. Steinhoff and G. Landbeck, J. Cancer Res. Clin. Oncol., 1988, 114, 509–513 CrossRef CAS PubMed.
- S. M. Moghimi, A. C. Hunter and J. C. Murray, FASEB J., 2005, 19, 311–330 CrossRef CAS PubMed.
- J. Della Rocca, D. Liu and W. Lin, Acc. Chem. Res., 2011, 44, 957–968 CrossRef CAS PubMed.
- M. E. Davis, Z. G. Chen and D. M. Shin, Nat. Rev. Drug Discovery, 2008, 7, 771–782 CrossRef CAS PubMed.
- P. Horcajada, C. Serre, M. Vallet-Regí, M. Sebban, F. Taulelle and G. Férey, Angew. Chem., 2006, 118, 6120–6124 CrossRef.
- J. I. Jin-gou, Z. Jing-fen, H. A. O. Shi-lei, W. U. Dan-jun, L. Li and X. U. Yi, Chem. Res. Chin. Univ., 2012, 28, 166–170 Search PubMed.
- D. Wang, G. Zhu, Y. Zhang, W. Yang, B. Wu, Y. Tang and Z. Xie, New J. Chem., 2005, 29, 272 RSC.
- H. Furukawa, K. E. Cordova, M. O’Keeffe and O. M. Yaghi, Science, 2013, 341, 1230444 CrossRef PubMed.
- P. Horcajada, R. Gref, T. Baati, P. K. Allan, G. Maurin, P. Couvreur, G. Férey, R. E. Morris and C. Serre, Chem. Rev., 2012, 112, 1232–1268 CrossRef CAS PubMed.
- A. C. McKinlay, B. Xiao, D. S. Wragg, P. S. Wheatley, I. L. Megson and R. E. Morris, J. Am. Chem. Soc., 2008, 130, 10440–10444 CrossRef CAS PubMed.
- C. He, K. Lu, D. Liu and W. Lin, J. Am. Chem. Soc., 2014, 136, 5181–5184 CrossRef CAS PubMed.
- P. Horcajada, T. Chalati, C. Serre, B. Gillet, C. Sebrie, T. Baati, J. F. Eubank, D. Heurtaux, P. Clayette, C. Kreuz, J.-S. Chang, Y. K. Hwang, V. Marsaud, P.-N. Bories, L. Cynober, S. Gil, G. Férey, P. Couvreur and R. Gref, Nat. Mater., 2010, 9, 172–178 CrossRef CAS PubMed.
- E. Bellido, T. Hidalgo, M. V. Lozano, M. Guillevic, R. Simón-Vázquez, M. J. Santander-Ortega, Á. González-Fernández, C. Serre, M. J. Alonso and P. Horcajada, Adv. Healthcare Mater., 2015, 4, 1246–1257 CrossRef CAS PubMed.
- V. Agostoni, P. Horcajada, M. Noiray, M. Malanga, A. Aykaç, L. Jicsinszky, A. Vargas-Berenguel, N. Semiramoth, S. Daoud-Mahammed, V. Nicolas, C. Martineau, F. Taulelle, J. Vigneron, A. Etcheberry, C. Serre and R. Gref, Sci. Rep., 2015, 5, 7925 CrossRef CAS PubMed.
- M. Giménez-Marqués, T. Hidalgo, C. Serre and P. Horcajada, Coord. Chem. Rev., 2016, 307, 342–360 CrossRef.
- M. T. Simon-Yarza, T. Baati, A. Paci, L. L. Lesueur, A. Seck, M. Chiper, R. Gref, C. Serre, P. Couvreur and P. Horcajada, J. Mater. Chem. B, 2016, 4, 585–588 RSC.
- C. A. Fernandez, S. K. Nune, H. V. Annapureddy, L. X. Dang, B. P. McGrail, F. Zheng, E. Polikarpov, D. L. King, C. Freeman and K. P. Brooks, Dalton Trans., 2015, 44, 13490–13497 RSC.
- C. Orellana-Tavra, E. F. Baxter, T. Tian, T. D. Bennett, N. K. H. Slater, A. K. Cheetham and D. Fairen-Jimenez, Chem. Commun., 2015, 51, 13857–13992 RSC.
- J. H. Cavka, S. Jakobsen, U. Olsbye, N. Guillou, C. Lamberti, S. Bordiga and K. P. Lillerud, J. Am. Chem. Soc., 2008, 130, 13850–13851 CrossRef PubMed.
- T. D. Bennett, S. Cao, J. C. Tan, D. A. Keen, E. G. Bithell, P. J. Beldon, T. Friscic and A. K. Cheetham, J. Am. Chem. Soc., 2011, 133, 14546–14549 CrossRef CAS PubMed.
- T. D. Bennett, P. J. Saines, D. A. Keen, J.-C. Tan and A. K. Cheetham, Chem. – Eur. J., 2013, 19, 7049–7055 CrossRef CAS PubMed.
- S. Cao, T. D. Bennett, D. A. Keen, A. L. Goodwin and A. K. Cheetham, Chem. Commun., 2012, 48, 7805–7807 RSC.
- T. D. Bennett and A. K. Cheetham, Acc. Chem. Res., 2014, 47, 1555–1562 CrossRef CAS PubMed.
- R. Amorim, N. Vilaça, O. Martinho, R. M. Reis, M. Sardo, J. Rocha, A. M. Fonseca, F. Baltazar and I. C. Neves, J. Phys. Chem. C, 2012, 116, 25642–25650 CAS.
- A. P. Halestrap and D. Meredith, Pflug. Arch. Eur. J. Phys., 2004, 447, 619–628 CrossRef CAS PubMed.
- C. Pinheiro, A. Albergaria, J. Paredes, B. Sousa, R. Dufloth, D. Vieira, F. Schmitt and F. Baltazar, Histopathology, 2010, 56, 860–867 CrossRef PubMed.
- C. Pinheiro, A. Longatto-Filho, S. M. M. Pereira, D. Etlinger, M. A. R. Moreira, L. F. Jubé, G. S. Queiroz, F. Schmitt and F. Baltazar, Dis. Markers, 2009, 26, 97–103 CrossRef CAS PubMed.
- C. Pinheiro, A. Longatto-Filho, C. Scapulatempo, L. Ferreira, S. Martins, L. Pellerin, M. Rodrigues, V. A. F. Alves, F. Schmitt and F. Baltazar, Virchows Arch., 2008, 452, 139–146 CrossRef CAS PubMed.
- S. Wang, W. Morris, Y. Liu, C. M. McGuirk, Y. Zhou, J. T. Hupp, O. K. Farha and C. A. Mirkin, Angew. Chem., Int. Ed., 2015, 54, 14738–14742 CrossRef CAS PubMed.
- S. L. Mayo, B. D. Olafson and W. A. Goddard, J. Phys. Chem., 1990, 94, 8897–8909 CrossRef CAS.
- A. K. Rappe, C. J. Casewit, K. S. Colwell, W. A. Goddard III and W. M. Skiff, J. Am. Chem. Soc., 1992, 114, 10024–10035 CrossRef CAS.
- M. G. Martin and J. I. Siepmann, J. Phys. Chem. B, 1998, 102, 2569–2577 CrossRef CAS.
- R. C. Reid, J. M. Prausnitz and B. E. Poling, The Properties of Gases and Liquids, McGraw-Hill, 1987 Search PubMed.
- A. L. Myers and P. A. Monson, Langmuir, 2002, 18, 10261–10273 CrossRef CAS.
- A. R. Leach, Molecular Modelling – Principles and Applications.pdf, Pearson Education, 2nd edn, 2001 Search PubMed.
- S. Brunauer, P. H. Emmett and E. Teller, J. Am. Chem. Soc., 1938, 60, 309–319 CrossRef CAS.
- K. S. Walton and R. Q. Snurr, J. Am. Chem. Soc., 2007, 129, 8552–8556 CrossRef CAS PubMed.
- M. J. Katz, Z. J. Brown, Y. J. Colón, P. W. Siu, K. A. Scheidt, R. Q. Snurr, J. T. Hupp and O. K. Farha, Chem. Commun., 2013, 49, 9449–9451 RSC.
- H. Greim, Zirconium and its Compounds, The MAK Collection for Occupational Health and Safety, 1999, pp. 224–236 Search PubMed.
- D. Cunha, C. Gaudin, I. Colinet, P. Horcajada, G. Maurin and C. Serre, J. Mater. Chem. B, 2013, 1, 1101–1108 RSC.
- G. E. Cmarik, M. Kim, S. M. Cohen and K. S. Walton, Langmuir, 2012, 28, 15606–15613 CrossRef CAS PubMed.
- R. J. Marshall, C. L. Hobday, C. F. Murphie, S. L. Griffin, C. A. Morrison, S. A. Moggach and R. S. Forgan, J. Mater. Chem. A, 2016, 4, 6955–6963 CAS.
- B. Wang, A. P. Côté, H. Furukawa, M. O’Keeffe and O. M. Yaghi, Nature, 2008, 453, 207–211 CrossRef CAS PubMed.
- S. J. Garibay and S. M. Cohen, Chem. Commun., 2010, 46, 7700–7702 RSC.
- M. Kandiah, M. H. Nilsen, S. Usseglio, S. Jakobsen, U. Olsbye, M. Tilset, C. Larabi, E. A. Quadrelli, F. Bonino and K. P. Lillerud, Chem. Mater., 2010, 22, 6632–6640 CrossRef CAS.
- M. Vandichel, J. Hajek, F. Vermoortele, M. Waroquier, D. E. De Vos and V. Van Speybroeck, CrystEngComm, 2014, 17, 395–406 RSC.
- D. Fairen-Jimenez, R. Galvelis, A. Torrisi, A. D. Gellan, M. T. Wharmby, P. A. Wright, C. Mellot-Draznieks and T. Düren, Dalton Trans., 2012, 41, 10752–10762 RSC.
- D. Fairen-Jimenez, N. A. Seaton and T. Düren, Langmuir, 2010, 26, 14694–14699 CrossRef CAS PubMed.
- D. Cunha, M. Ben Yahia, S. Hall, S. R. Miller, H. Chevreau, E. Elkaïm, G. Maurin, P. Horcajada and C. Serre, Chem. Mater., 2013, 25, 2767–2776 CrossRef CAS.
- X. Zhu, J. Gu, Y. Wang, B. Li, Y. Li, W. Zhao and J. Shi, Chem. Commun., 2014, 50, 8779–8782 RSC.
- D. B. Mitchell, K. S. Santone and D. Acosta, J. Tissue Cult. Methods, 1980, 6, 113–116 CrossRef CAS.
- Z. Fang, B. Bueken, D. E. De Vos and R. A. Fischer, Angew. Chem., Int. Ed., 2015, 54, 7234–7254 CrossRef CAS PubMed.
- K. Chapman, G. Halder and P. Chupas, J. Am. Chem. Soc., 2009, 131, 17546–17547 CrossRef CAS PubMed.
- T. D. Bennett, J. Sotelo, J.-C. Tan and S. A. Moggach, CrystEngComm, 2015, 17, 286–289 RSC.
- C. L. Hobday, R. J. Marshall, C. F. Murphie, J. Sotelo, T. Richards, D. R. Allan, T. Düren, F.-X. Coudert, R. S. Forgan, C. A. Morrison, S. A. Moggach and T. D. Bennett, Angew. Chem., Int. Ed., 2016, 55, 2401–2405 CrossRef CAS PubMed.
- P. Rivera-Gil, D. Jimenez De Aberasturi, V. Wulf, B. Pelaz, P. Del Pino, Y. Zhao, J. M. De La Fuente, I. R. De Larramendi, T. Rojo, X. J. Liang and W. J. Parak, Acc. Chem. Res., 2013, 46, 743–749 CrossRef CAS PubMed.
- C. Orellana-Tavra, S. A. Mercado and D. Fairen-Jimenez, Adv. Healthcare Mater., 2016, 5, 2261–2270 CrossRef CAS PubMed.
- M. Nazarenus, Q. Zhang, M. G. Soliman, P. del Pino, B. Pelaz, S. Carregal-Romero, J. Rejman, B. Rothen-Rutishauser, M. J. D. Clift, R. Zellner, G. U. Nienhaus, J. B. Delehanty, I. L. Medintz and W. J. Parak, Beilstein J. Nanotechnol., 2014, 5, 1477–1490 CrossRef PubMed.
- A. E. Oliver, K. Jamil, J. H. Crowe and F. Tablin, Cell Preserv. Technol., 2004, 2, 35–49 CrossRef CAS.
- J. Rejman, A. Bragonzi and M. Conese, Mol. Ther., 2005, 12, 468–474 CrossRef CAS PubMed.
- I. B. Vasconcelos, T. G. Da Silva, G. C. G. Militão, T. A. Soares, N. M. Rodrigues, M. O. Rodrigues, N. B. Da Costa, R. O. Freire and S. A. Junior, RSC Adv., 2012, 2, 9437–9442 RSC.
- K. M. L. Taylor-Pashow, J. Della Rocca, Z. Xie, S. Tran and W. Lin, J. Am. Chem. Soc., 2009, 131, 14261–14263 CrossRef CAS PubMed.
Footnote |
| † Electronic supplementary information (ESI) available: PXRD, N2 adsorption, cytotoxicity, SEM and additional characterisation. See DOI: 10.1039/c6tb02025a |
| This journal is © The Royal Society of Chemistry 2016 |