
Nd3+-doped LiYF4 nanocrystals for bio-imaging in the second near-infrared window†
Xinyi
Jiang
,
Cong
Cao
,
Wei
Feng
* and
Fuyou
Li
*
Department of Chemistry & Institutes of Biomedical Science & State Key Laboratory of Molecular Engineering of Polymers, Fudan University, 220 Handan Road, Shanghai 200433, P. R. China. E-mail: fengweifd@fudan.edu.cn; fyli@fudan.edu.cn
First published on 16th November 2015
Abstract
The fluorescent probes working in the near-infrared (NIR) window have unparalleled advantages of a high penetration depth and low interference from autofluorescence. In this paper we introduced a rare-earth doped nanoprobe working in this region with a narrow emission band, a high efficiency, and good bio-compatibility. The newly-developed host material LiYF4 managed to strengthen the emission intensity and generate a fine structure of the emission peaks. After the optimization of the doping ratio of Nd3+ and surface modification, the LiYF4:5%Nd3+ probe could reach a penetration depth of 3–5 mm and could be successfully utilized in lymphatic imaging, with a signal-to-noise ratio of 14.8 in vivo and a resolution of ∼0.2 mm in circulatory imaging. This probe may be further used in bio-detection and the host material itself may replace the traditional NaYF4 in some aspects of applications.
Introduction
The development of a luminescent probe, with its advantages of high sensitivity, high accuracy, fast feedback and the absence of radiation, has opened up a new area in bio-imaging.1,2 In bio-imaging applications, light may be absorbed or scattered easily at shorter wavelengths like the ultraviolet (UV) region and the visible region, which harms the efficiency of these probes.3 The autofluorescence from biological tissues also influences the final imaging results. Due to the aforementioned reasons, fluorescent probes working in the second near-infrared window (NIR II, 1000–1350 nm), where the interference from autofluorescence, absorption and scattering is minimal, are more propitious for intravital imaging,4 especially ones with excitation and emission wavelengths both inside the NIR II region.However, the practical utilization of probes in the NIR II window requires expensive detectors based on indium gallium arsenide (InGaAs) or mercury cadmium telluride (HgCdTe) sensors, which are expensive and still not widely used.3 Meanwhile, the development of bio-compatible probes in the NIR II window for imaging, like single-walled carbon nanotubes (SWNTs),5–9 quantum dots (QDs)10–15 and polymer fluorophores,16 remains in nascent stages. The SWNTs usually have a relatively broad emission band and low quantum yield which restrict their usage in imaging,17,18 and the wide length distributions may affect their pharmacokinetic behavior, ultimately impeding their practical applications.19 For QDs, most of them are still affected by the potential problem of toxicity. The newly-developed silver chalcogenide QDs require upgrade in surface modification to ameliorate their quantum yield (QY).20 Therefore, it is meaningful to design a probe of a narrower emission band, a higher efficiency, a controllable size and lower bio-toxicity.
Rare earth metals are commonly used for synthesizing nanomaterials for bioapplications. Their abundant 4f electrons allow researchers to tune the luminance in a wide range from UV to NIR using different doping ions. Meanwhile, the emission peaks generated from rare earth ions are sharp and resistant to impact from the outside environment. Apart from the outstanding luminescent properties, no serious bio-toxicity has been reported.21 Recently, different kinds of rare-earth materials in the NIR II range have also been developed, like rare-earth fluorides22–24 and oxides for cancer targeting25,26 and in vivo imaging.27,28
Herein, we introduce LiYF4 to be the host material for our probe. As a member of rare earth fluorides, it possesses the merits of outstanding optical transparency and low phonon energy which can minimize the non-radiative energy loss.29 Nd3+ was chosen to be the doping ion for its intrinsic NIR emissive luminescent properties. Numerous applications of Nd3+ ions in the NIR region have been reported, from the widely-used Nd laser oscillators30 to the newly-designed Nd3+-sensitized solar batteries.31 For bioapplications, the NIR emission of Nd has already been used in bio-imaging after subcutaneous injection24,32 or intravenous injection33 on a mouse model. It also showed great potential in intratumoral thermal detection24 and photothermal treatment.34 We combined it with LiYF4 and designed a LiYF4:Nd3+ nanoparticle (NP) system which needs a few steps to be synthesized and has high luminescent efficiency. Laser at 808 nm, bringing less heat effect,35,36 was applied to excite the Nd3+ ions and luminescent signals at 900 nm, 1050 nm and 1330 nm were designed as imaging signals. The as-prepared probe has relatively stronger emission compared to NaYF4 NPs with the same doping ratio of luminescent ions, due to the special crystal structure of LiYF4,37,38 and the desired superiorities of LiYF4:Nd3+ have been proved in the bio-imaging applications.
Experimental
Materials
All the chemicals used were of analytical grade and were used without further purification. Deionized water was used throughout. Rare-earth oxides, RE2O3 (99.999%) (RE3+ = Y3+, Nd3+), NaOH, LiOH·H2O, NH4F, HCl, methanol, ethanol and cyclohexane were purchased from Sinopharm Chemical Reagent Beijing Co., Ltd. Oleic acid, 1-octadecene and nitrosonium tetrafluoroborate (NOBF4) were bought from Alfa Aesar Ltd. Dimethyl sulfoxide (DMSO) was bought from Sigma-Aldrich Co. Ltd. Ethylenediaminetetra(methylene phosphonicacid) (EDTMP) was gained from TCI (Shanghai) Development Co., Ltd. All the doping ratios of RE3+ were calculated in moles in our experiments.Synthesis of LiYF4:x%Nd3+ (x = 1.0, 3.0, 5.0, 7.0, 10.0) NPs
The rare-earth chlorides used were synthesized by adding HCl into rare-earth oxides, followed by evaporating the remaining liquid to get solid powder. The NPs of LiYF4 were synthesized using a specially-modified co-precipitation method.39 A mixture of 1 − x% mmol YCl3, x% mmol NdCl3, oleic acid (OA, 6 mL), 1-octadecene (15 mL) was added into a 100 mL three-necked flask at room temperature. The oxygen was moved out by vacuuming under vigorous magnetic stirring. Then, the system was heated to 130 °C to form a clear and transparent solution. After the solution was cooled to 70 °C naturally, 8 mL of methanol solution containing LiOH·H2O (0.106 g) and NH4F (0.148 g) were slowly added into the flask, and precipitates appeared in the solution. The mixture was stirred for 30 min and gradually got transparent again, guaranteeing the complete consumption of fluorides, and then it was heated to evaporate methanol for 15 min, followed by vacuuming for 15 min to ensure the removal of methanol and water. After that, the solution was heated to 300 °C under the protection of a nitrogen atmosphere. The solution was held at the final temperature for 90 min after which it was allowed to cool to the room temperature prior to precipitation with absolute ethanol. The mixture was separated by centrifugation and the precipitates were collected and further purified by cyclohexane/ethanol (v/v 1![[thin space (1/6-em)]](https://www.rsc.org/images/entities/char_2009.gif) :2) twice. The resulted NPs were dispersed in cyclohexane (10 mL) for further use.
:2) twice. The resulted NPs were dispersed in cyclohexane (10 mL) for further use.
Surface modification of LiYF4:Nd3+ NPs
To make these NPs hydrophilic, the as-prepared cyclohexane solution (5 mL) of NPs and cyclohexane (5 mL) was added into a centrifugal tube and then dispersed evenly using the ultrasonic method. NOBF4 was added into the solution until no more precipitate forms.40 The precipitates were separated with centrifugation and re-dispersed in water (5 mL), and then we added ethanol drop by drop until the solution got transparent again. The NPs were separated with centrifugation and washed with water several times. Then we dispersed them in water (5 mL). The bare NPs could be modified using different ligands. In our research we chose EDTMP as a surface ligand for further biological applications. The water solution of bare NPs was added into EDTMP solution and the precipitates were separated by centrifugation. The excessive ligands were washed away with water, and then re-dispersed the EDTMP-modified NPs with water for further use.Characterization
The morphologies of as-prepared LiYF4:Nd3+ NPs were examined using a JEOL JEM-2010 low- and high-resolution (HR) transmission electron microscope (TEM) operating at 200 kV. The samples were dispersed in cyclohexane and dropped onto a copper grid for TEM tests. The energy-dispersive X-ray analysis (EDXA) was also performed on this microscope. X-ray powder diffraction (XRD) measurements were performed at room temperature on a Bruker D4 diffractometer at a scanning rate of 1° min−1 in the 2θ range of 10–80°, with graphite monochromated Cu Ka radiation (λ = 0.15406 nm). The NIR fluorescence spectrum was measured using an Edinburgh Instruments FLS920 fluorescence spectrometer, equipped with an external 0–3 W adjustable laser (808 nm, Beijing Hi-Tech Optoelectronic Co., China) as the excitation source at room temperature. The collected range was from 830 nm to 1400 nm. The quantum yield was measured at room temperature using a Photo Technology International QM40 fluorescence spectrometer, equipped with a xenon lamp as the excitation source. The cyclohexane solution of LiYF4:5%Nd3+ NPs and pure cyclohexane (blank) were excited at 808 nm and the emission was observed from 750 nm to 1150 nm. The numbers of absorption photons (Nabs) and emission photons (Nem) were recorded to calculate the QY using the following formula:| QY (%) = (Nem/Nabs) × 100. |
Intragastric administration on a mouse model
All animal procedures were in agreement with the guidelines of the Institutional Animal Care and Use Committee. 0.20 mg (0.10 mL × 2.0 mg mL−1) of EDTMP–LiYF4:Nd3+ NPs were imbued to the stomachs of a nude mouse and a Kunming mouse, both purchased from the Second Military Medical University (Shanghai, China), by using gastric syringes. The NIR luminescence imaging was performed using the in vivo imaging system designed by our group.41 We used 808 nm lasers as the excitation source and Andor DU897 EMCCD as a signal collector. The quantum efficiency of the CCD is shown in Fig. S6 (ESI†). The excitation intensity of 808 nm irradiation was kept below 400 mW cm−2 and the exposure time was 1 s. Images of luminescent signals were analysed with Carestream MI SE. The signals were collected at wavelength >980 nm. The transmittance of the 980 nm long-pass edge filter (Semrock BLP01-980R Optical Filter) is shown in Fig. S7 (ESI†).Lymphatic mapping on a mouse model
1.0 mg (0.10 mL × 10 mg mL−1) of EDTMP–LiYF4:Nd3+ NPs were injected into nude mice from paw and footpad respectively. The NIR luminescence imaging was performed using the in vivo imaging system designed by our group as mentioned above. 24 h after injection we collected the imaging results in vivo, then the mice were opened up at the sites of the lymph nodes and the lymph nodes were taken out for imaging afterwards. The excitation intensity of 808 nm irradiation was kept below 400 mW cm−2 and the exposure time was 1 s. Images of luminescent signals were analysed with Carestream MI SE. The signals were collected at wavelength >980 nm.Blood vessel imaging on a mouse model
1.0 mg (0.20 mL × 5.0 mg mL−1) of EDTMP–LiYF4:Nd3+ NPs were injected into a nude mouse intravenously to test the resolution of blood vessel imaging. 2.0 mg (0.20 mL × 10 mg mL−1) of EDTMP–LiYF4:Nd3+ NPs were injected into a Kunming mouse intravenously to view the bio-distribution. The in vivo images were shot immediately. The NIR luminescence imaging was performed using the in vivo imaging system designed by our group as mentioned above. The excitation intensity of 808 nm irradiation was kept below 400 mW cm−2 and the exposure time was 1 s. Images of luminescent signals were analysed with AndorSolis, Carestream MI SE and origin 8.0®. The signals were collected at wavelength >980 nm.Cytotoxicity assay
The in vitro cytotoxicity was measured using the methyl thiazolyltetrazolium (MTT) assay using the HeLa cell line. Cells growing in the log phase were seeded into a 96-well cell-culture plate (Corning Costar, Cambridge, MA, USA) and then incubated for 12 h at 37.5 °C under 5% CO2, in RPMI-1640 (Invitrogen, Grand Island, NY, USA), supplemented with 10% heat-inactivated fetal bovine serum (FBS; Invitrogen), 50 IU mL−1 penicillin and 50 mg mL−1 streptomycin (Invitrogen). Solutions of 0–600 μg mL−1 EDTMP–LiYF4:Nd3+ NPs were added to the well of the treatment group, and RPMI-1640 to the negative control group. The cells were incubated for 24 h at 37.5 °C under 5% CO2. For a colorimetric MTT assay, DMSO was added to solubilize formazan and absorbance was measured at 562 nm. The following formula was used to calculate the viability of cell growth:| Cell viability (%) = (mean of Abs value of treatment group/mean of Abs value of control) × 100. |
Histology of animal organs
Kunming mice were intravenously injected with 1.5 mg (0.15 mL × 10 mg mL−1) of EDTMP–LiYF4:Nd3+ NPs. Organs were harvested 1 day and 7 days after injection, fixed using paraformaldehyde, embedded in paraffin, sectioned and stained with hematoxylin and eosin (H&E). Organs from untreated animals were analysed as control.Results and discussion
Synthesis and characterization of LiYF4:Nd3+ NPs
The synthesis of LiYF4 nanocrystals in relatively large quantities has not been widely reported due to their special characteristics. Compared with the widely-used NaYF4 nanocrystals, they also belong to rare earth fluorides, and possess a similar rigid crystal lattice and ordered structure. The LiYF4 structure is isomorphous with CaWO4, with Li+ at the spots of W4+ and Y3+ at the spots of Ca2+.37,42 The tetragonal LiYF4 synthesized here showed an octahedral shape (Fig. 1a and b, Fig. S1a–e, ESI†), which was also consistent with former research studies.29,38,43 The XRD patterns confirmed the special crystal structure and the high crystallinity of the nanocrystals. As shown in Fig. 1c and Fig. S1g (ESI†), the planes could be smoothly fit to the standard PDF card (JCPDS 17-0874) of tetragonal LiYF4. The peaks were broadened due to the small sizes of nanomaterials. The EDXA analysis proved the existence of Nd3+ (Fig. S2, ESI†). With an increase in the doping ratio of Nd3+, the NPs grew larger from 18 to 30 nm at length and from 15 to 25 nm at width (Fig. S1a–e, ESI†), with a standard deviation of around 1–2 nm. And the phase of crystals did not show obvious change. The growing trend was possibly caused by the relatively large radius of Nd3+ compared to that of Y3+, which distorted the rigid arrangement of atoms in the lattice, since after implementing different reaction conditions this trend in size remained stubbornly.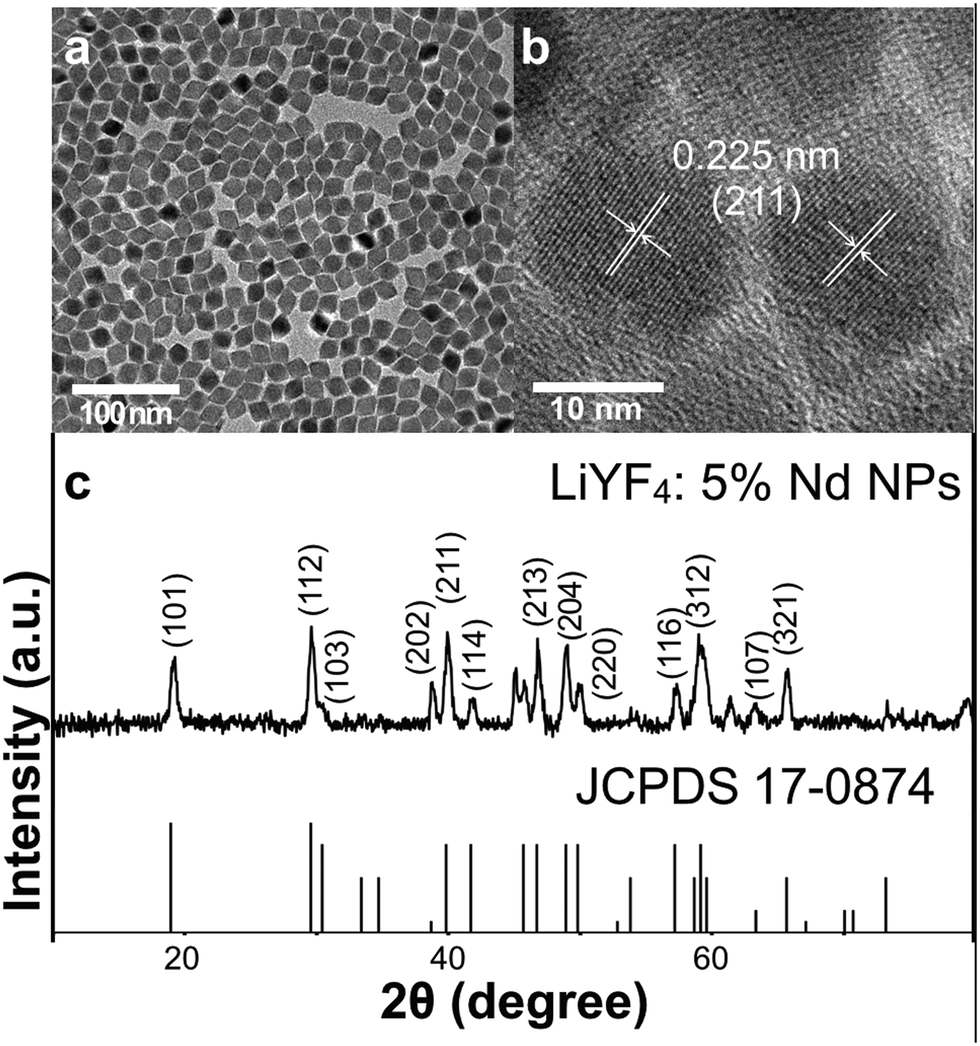 | ||
| Fig. 1 (a) TEM image of LiYF4:5%Nd3+ NPs. Scale bar = 100 nm. (b) HR-TEM image of LiYF4:5%Nd3+. Scale bar = 10 nm. (c) XRD patterns of LiYF4:5%Nd3+ NPs and the standard PDF card of tetragonal LiYF4. | ||
The luminescent properties of LiYF4:Nd3+ NPs were characterized with fluorescent spectroscopy. Since the NPs were synthesized with the control of OA, they were ultimately covered with OA ligands on the surface. As a result, they were dispersible in organic solvents like cyclohexane, and the fluorescence spectra were measured in cyclohexane solution. As shown in Fig. 2, the emission was ascribed to the f–f electronic transitions of Nd3+. The Nd3+ ions were excited from 4I9/2 to 4F5/2 by the laser of 808 nm, and then the transitions of 4F3/2–4I9/2 (900 nm), 4F3/2–4I11/2 (1050 nm) and 4F3/2–4I13/2 (1330 nm) occurred and generated these emission peaks. The luminescence intensity increased when the doping ratio of Nd3+ was raised from 1% to 5%. However, after reaching the peak emission intensity, it gradually fell at the doping ratios of 7% and 10%, which was possibly caused by the cross-relaxation among Nd3+ ions, between which the distance lowered as well. The QY of LiYF4:5%Nd3+ NPs was tested in cyclohexane solution and reached 28% due to the simple process of luminance and relatively little energy loss from non-radiative transitions (Fig. S3, ESI†).
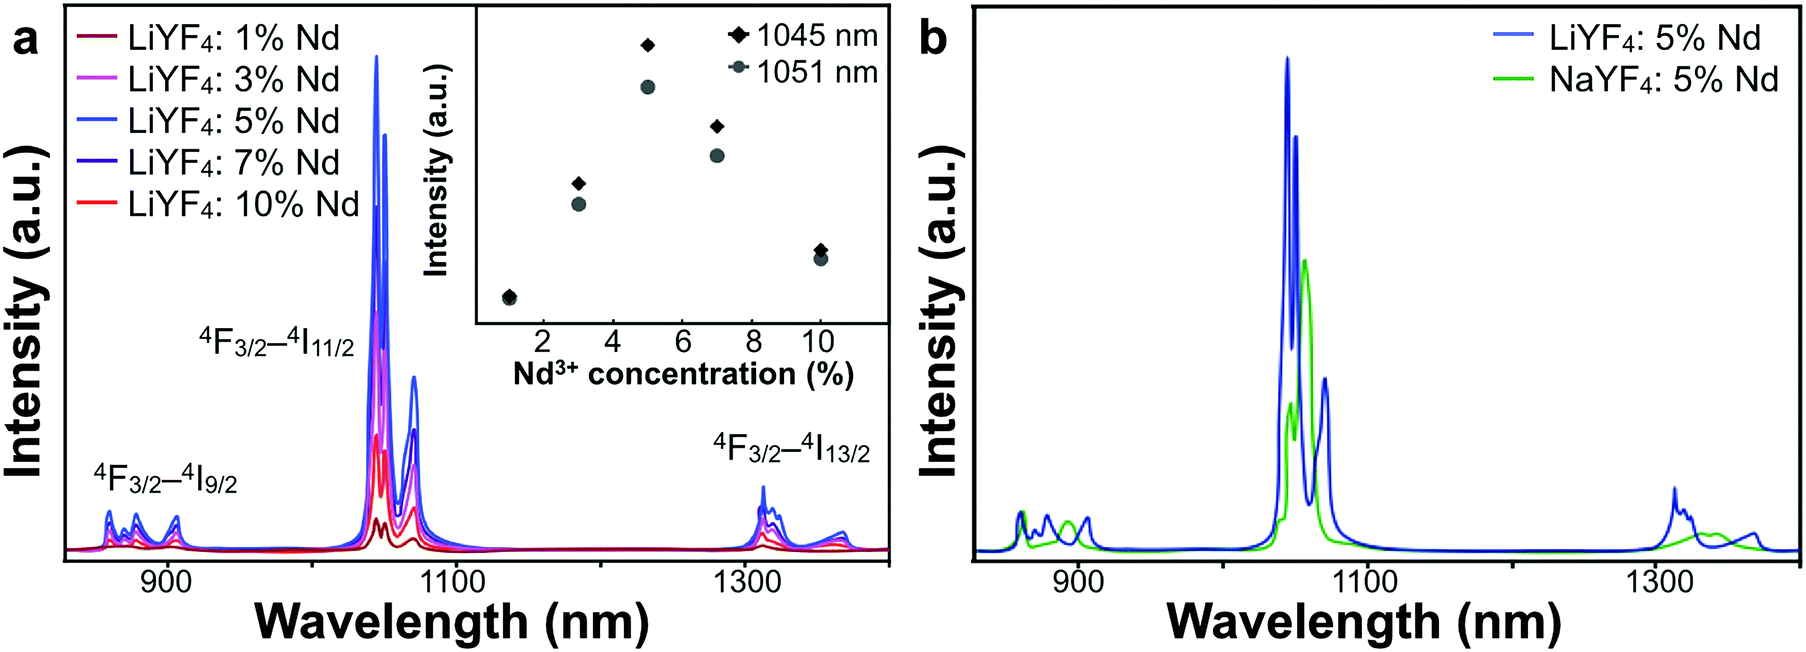 | ||
| Fig. 2 (a) Fluorescence spectra of cyclohexane solution of OA–LiYF4:x%Nd3+ NPs, x = 1.0, 3.0, 5.0, 7.0, 10.0. The inset shows the intensity of emissions at 1045 nm and 1051 nm as a function of Nd3+ ion concentration. (b) Fluorescence spectra of cyclohexane solution of OA–LiYF4:5%Nd3+ NPs and OA–NaYF4:5%Nd3+ NPs. | ||
We also synthesized Nd3+-doped NPs based on the traditional host material, NaYF4, for comparison. The size of NaYF4 was controlled to be around 23 nm, which was comparable to the average size of LiYF4 (Fig. S1f, ESI†). The luminescent spectra of NaYF4:Nd3+ NPs of different doping ratios, collected under the same test conditions, are shown in Fig. S4 (ESI†). Similarly, the strongest intensity was achieved in NaYF4:5%Nd3+ NPs. However, LiYF4:5%Nd3+ NPs presented stronger emission intensity and the split of emission peaks was more delicate (Fig. 2b). Since the electric field of the surroundings produced a crystal field which exerted an influence on the multiplets and caused the Stark splits, the tetragonal LiYF4 crystal had relatively fewer symmetry properties, thus the energy levels of Nd3+ were changed by the crystal field, leading to stronger emission and more refined split.36,37
Then we chose to use LiYF4:5%Nd3+ to conduct the following biological experiments. The surfaced ligands of NPs were washed using the reported method and then made hydrophilic with EDTMP.40 The rare-earth nanoparticles capped with oleic acid will transform in the acidic physiological fluids, like lysosomes, resulting in pro-inflammatory effects and quenching of fluorescence. The coating of EDTMP could passivate the surfaces of the particles to lessen the transformation behaviour and lower the cytotoxicity, as well as preserve the fluorescence quality. Due to the strong coordination interaction between the central rare-earth atom and the ligand, it could be easily functionalized on the surface of bare LiYF4:Nd3+ NPs.21 The ligand exchange was successful as proven by the result of infrared (IR) spectroscopy (Fig. 3a). The OA-capped NPs showed the stretching vibration frequency at around 3000 cm−1 of the carbonic double bond and methene, and these peaks were noticeably reduced in the EDTMP-capped NPs. The EDTMP-capped NPs showed the specific absorption of P![[double bond, length as m-dash]](https://www.rsc.org/images/entities/char_e001.gif) O in EDTMP at 1109 and 1007 cm−1, which was also substantiated by the strong absorbance around these wavelengths in the IR spectroscopy of the pure EDTMP sample. The zeta-potential of EDTMP-capped NPs was −23.1 mV. These results confirmed the substitution of OA with EDTMP at the surface of the NPs.21,44 The hydrophilic NPs were of perfect dispersibility and transparency as is shown in Fig. 3c. The hydrodynamic sizes of the water-phase NPs were also tested and no aggregation was observed (Fig. S5, ESI†). After the ligand exchange process, the emission intensity decreased by about 50 percent while the position of the emission peaks did not change (Fig. 3b). It was possibly caused by the quenching of the hydrophilic ligand and aqueous solution.
O in EDTMP at 1109 and 1007 cm−1, which was also substantiated by the strong absorbance around these wavelengths in the IR spectroscopy of the pure EDTMP sample. The zeta-potential of EDTMP-capped NPs was −23.1 mV. These results confirmed the substitution of OA with EDTMP at the surface of the NPs.21,44 The hydrophilic NPs were of perfect dispersibility and transparency as is shown in Fig. 3c. The hydrodynamic sizes of the water-phase NPs were also tested and no aggregation was observed (Fig. S5, ESI†). After the ligand exchange process, the emission intensity decreased by about 50 percent while the position of the emission peaks did not change (Fig. 3b). It was possibly caused by the quenching of the hydrophilic ligand and aqueous solution.
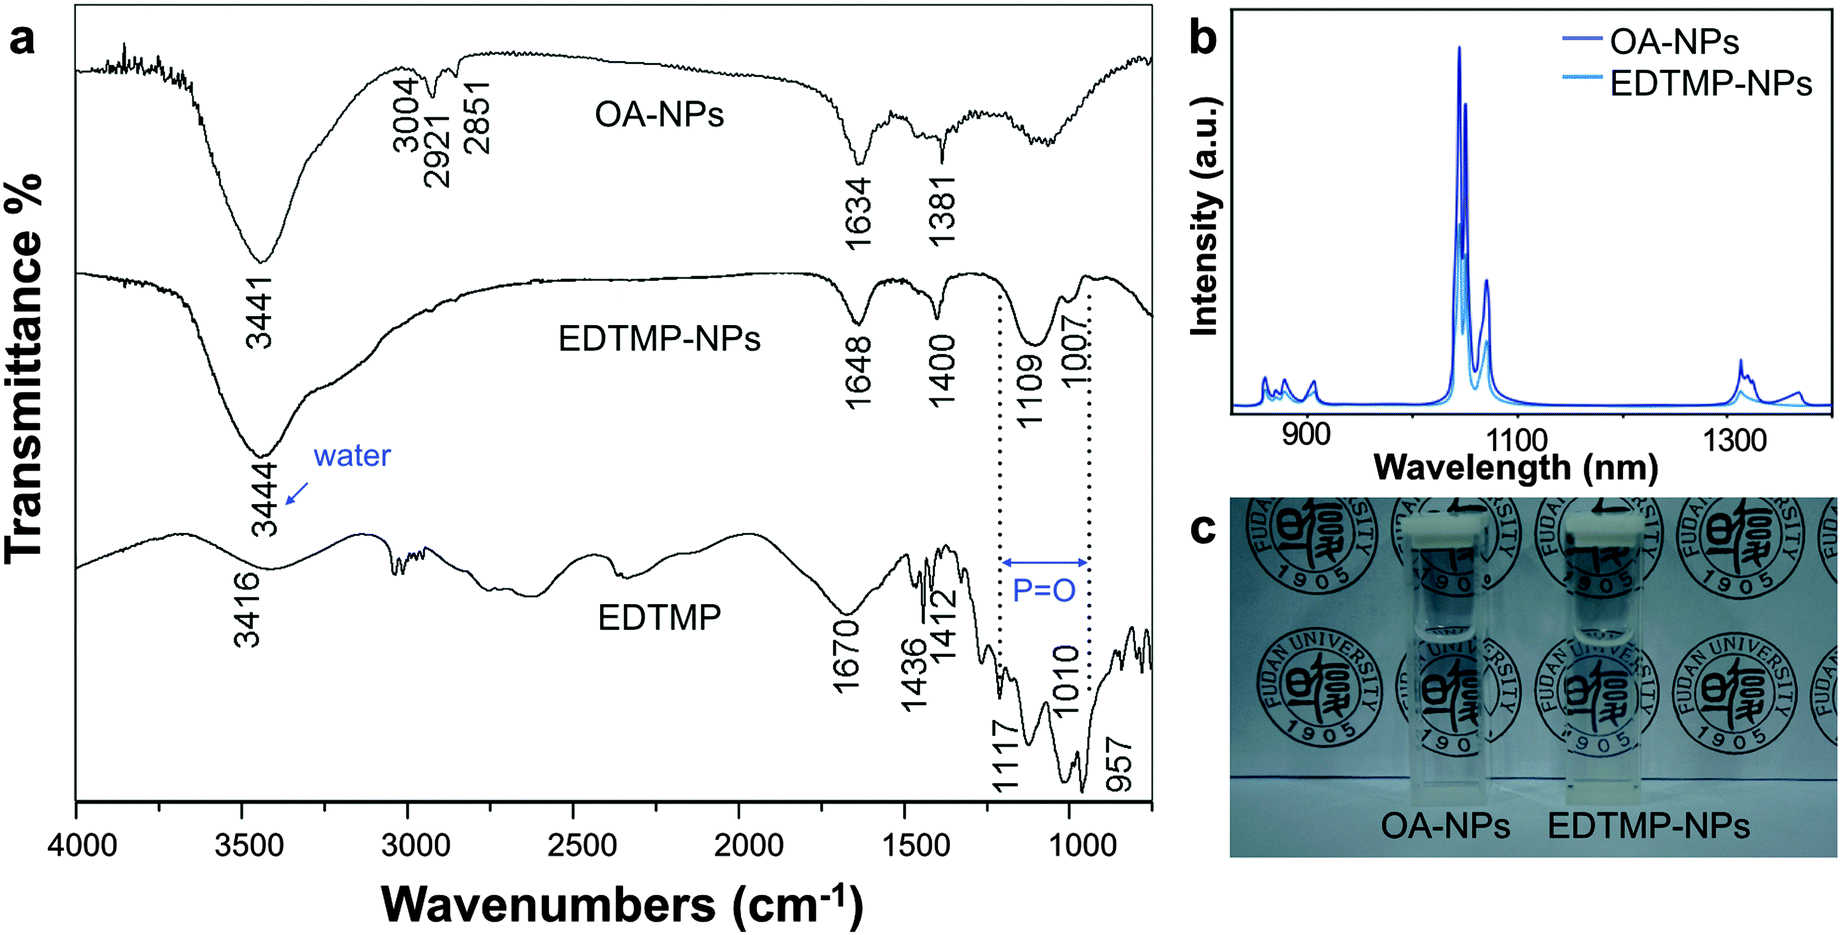 | ||
| Fig. 3 (a) IR spectra of OA–LiYF4:Nd3+ NPs, EDTMP–LiYF4:Nd3+ NPs and the pure EDTMP sample. (b) Fluorescence spectra of cyclohexane solution of OA–LiYF4:5%Nd3+ NPs and aqueous solution of EDTMP–LiYF4:5%Nd3+. (c) Digital camera graph of cyclohexane solution of OA–LiYF4:5%Nd3+ NPs and aqueous solution of EDTMP–LiYF4:5%Nd3+ NPs. | ||
Intragastric administration
To evaluate the penetration depth of imaging applications with EDTMP–LiYF4:Nd3+ NPs, we conducted the experiment of intragastric administration on both nude mouse and Kunming mouse as shown in Fig. 4, using common Si-CCD as a detector. The depth of mice's stomachs was around 3–5 mm for nude mice and 5–7 mm for Kunming mice, and we could still collect signals of high levels with the amount of injection of 0.2 mg (0.1 mL × 2 mg mL−1). The skin of nude mouse was relatively thinner, so that the imaging quality did not improve a lot after removal of tissues above. For Kunming mouse covered by thick furs and skin, the fluorescence was low in vivo, so we had to raise the gain parameter of the CCD detector to twice of that applied to the nude mouse. However, it shall be noticed that with the inevitable impact caused by thick tissues, we were still able to collect signals strong enough for imaging and analysis. The fluorescence intensity increased significantly after opening up the mouse, by approximately an order of magnitude. The results showed the great penetration capability of this NIR II probe and laid solid foundations for further imaging in lymphatic and vascular systems.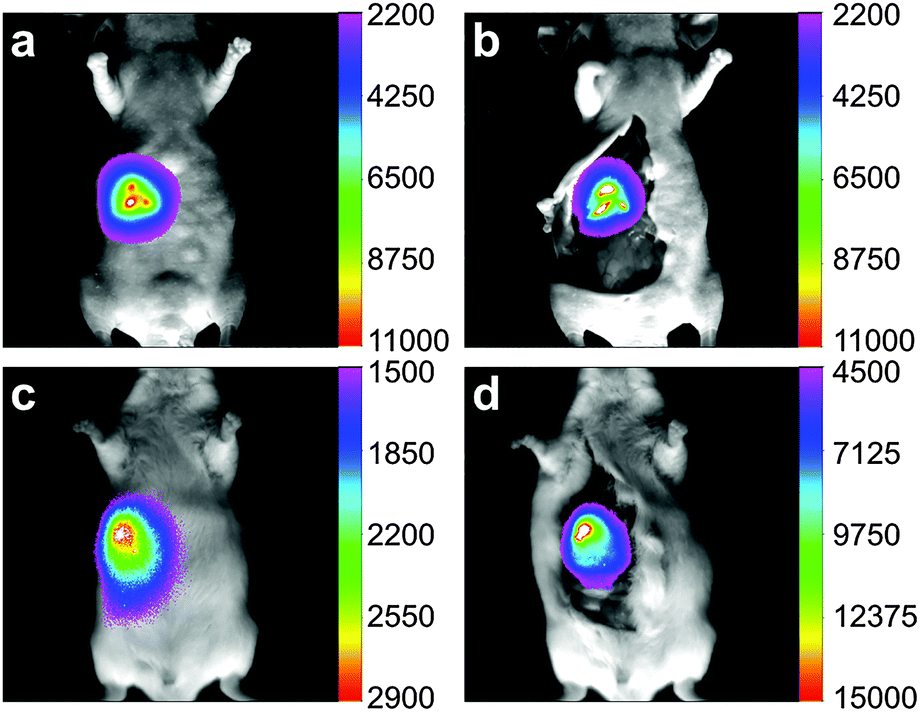 | ||
| Fig. 4 NIR II images of EDTMP–LiYF4:Nd3+ NPs after intragastric administration at the stomach of a (a) nude mouse, (b) nude mouse after removal of skin and fat tissues above, (c) Kunming mouse, (d) Kunming mouse after removal of skin and fat tissues above. The gain parameter of figure (c) and (d) is twice of that applied to figure (a) and (b). | ||
The luminance of mouse food in the NIR II window has been reported.22 Control experiments have also been performed under the same condition (Fig. S8, ESI†). There did exist autofluorescence of the mice and mouse food, but the signals were very low (below 1500 counts) compared to the fluorescence of the materials (usually 2000 – ca. 60000 counts).
There were several other imaging experiments based on the fluorescence of Nd in the NIR II window after intravenous32 or subcutaneous injection,22,33 which have realized the imaging on mouse model on a basic level.
Lymphatic imaging
The lymphatic system is one of the common ways of tumor metastasis, so the imaging of the lymphatic system is of great significance in the diagnosis and treatment of cancer. Herein, we injected the EDTMP–LiYF4:Nd3+ NPs into the nude mice. In Fig. 5a–c, the NPs were injected through paw and the axillary lymph node (pointed out with yellow arrows) was lightened. The emission intensity was already satisfying in in vivo imaging, which proved the outstanding detection depth, and we could almost see no autofluorescence, which was another advantage of NIR II imaging. The signal-to-noise ratio (SNR) reached 14.8 (Table S1, ESI†). When the skin and fat tissue upon the lymph node were removed, it showed stronger emission exceeding the detection range of the CCD (shown as white color block, Fig. 5b), and better SNR no less than 18.9. After that we found the lymph node and took it out, to avoid damaging the CCD detector, we lowered the gain parameter by half and collected signals of almost the same intensity (Fig. 5c). The observation result was further confirmed by histological analysis that lightened tissues were lymph nodes indeed (Fig. S11a, ESI†). The injection at footpad was also carried out and two of the sentinel lymph nodes (pointed out with yellow arrows) were lightened (Fig. 5d–f), though the SNR was relatively lower (12.8, in vivo). The results were confirmed by histological analysis as well (Fig. S11b and c, ESI†). Compared to other research studies in NIR II lymphatic imaging,2 our materials were distributed mainly in the lymphatic system and maintained a good imaging quality 24 h after injection, which was beneficial for potential usage in long-term tracing, meanwhile implying the extraordinary bio-stability and bio-compatibility.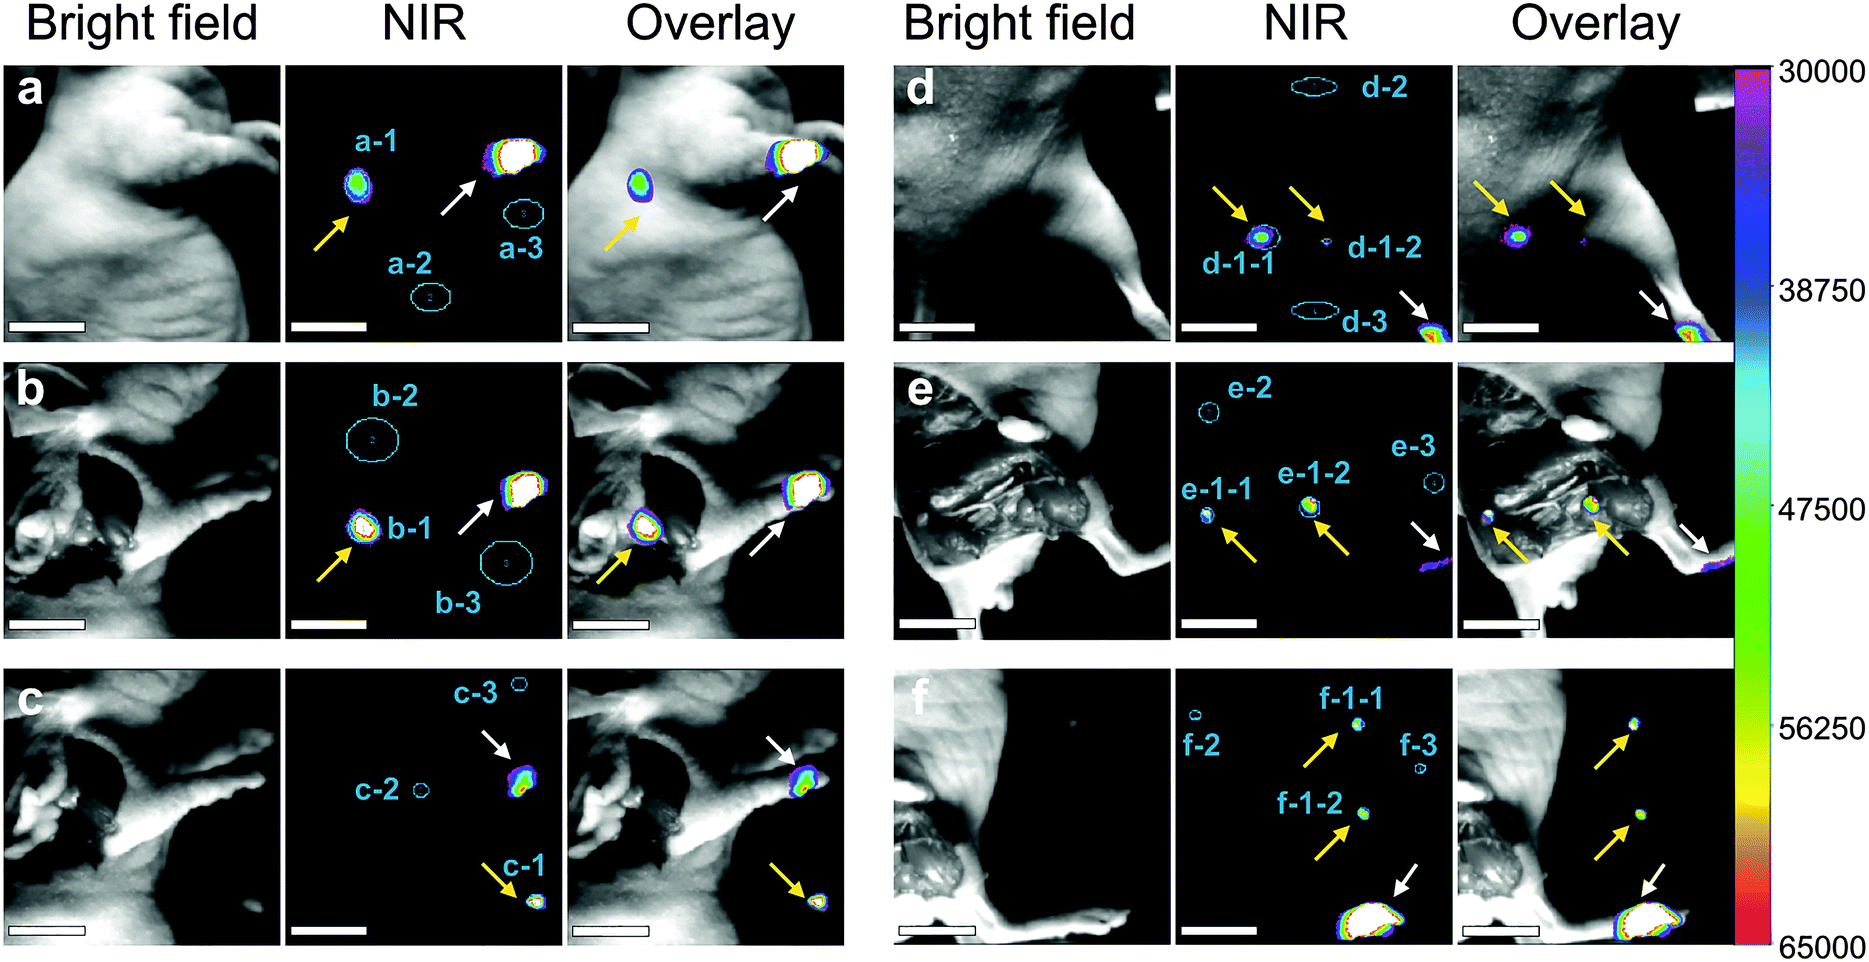 | ||
| Fig. 5 NIR II imaging of the lymph node 24 h after injection at the right paw of the nude mouse (a) in vivo, (b) after the removal of skin and fat tissues above. (c) The removed axillary lymph node. NIR II imaging of lymph nodes 24 h after injection at the right footpad of the nude mouse (d) in vivo, (e) after removal of skin and fat tissues above the lymph nodes. (f) The removed lymph nodes around leg. Scale bar = 0.5 cm. All the lymph nodes are notified with yellow arrows and the injecting site is marked with white arrows. The regions of interest (ROI) are marked using blue areas. The mean intensity of ROI 1 (specific uptake), ROI 2 (nonspecific uptake) and ROI 3 (background) was collected for the signal-to-noise ratio (SNR) calculation (see Table S1, ESI†). | ||
Blood vessel imaging
Angiography is another important way of cancer diagnosis, since the development of tumor will inevitably involve the growth of new blood vessels.45 In order to test the potential in practical applications, we assessed the feasibility of EDTMP–LiYF4:Nd3+ NPs in blood vessel imaging. Fig. 6 displays the imaging results of blood vessels of a nude mouse. At vascular bifurcations, fine vessels could be seen separately, demonstrating intuitively the high resolution of this probe. It was further verified by the intensity profiles along the red-dashed lines, in which different peaks of the signals of blood vessels could be easily identified in Fig. 6a, c and d, and fit to Gaussian functions (marked with red-dashed curves) to extract the width. Due to the inevitable absorbance and scattering of the tissues, we used the full width at half maximum (FWHM) to represent the widths of the vessels. Almost all the calculated widths were consistent with the expected values around 0.1–2.0 mm,46 except one of them shown in Fig. 6d, reaching the width of 2.80 mm. This result was still reasonable, as this blood vessel could be seen much wider than all the other ones around it with the naked eye in the bright-field picture of it (Fig. 6e). These results proved that our probe could show the width of vessels veritably, from ∼0.2 mm to ∼3.0 mm, with little interference from biological tissues, reaching a commensurate resolution limit of Micro-CT.46 Furthermore, in Fig. 6a, c and d, all the Gaussian fit was restricted to the artificially selected data range. To put it another way, the signal peaks could not be identified by common data processing software like origin® in a relatively large range. That might be caused by the narrow width of the peak composed of only a few data points (4–5), which were not enough for the software to identify the peaks automatically, and this problem could not be solved now because of the limited resolution of the CCD detector. Only limited pixels could be collected on a line of fixed length, so we tried to find the vessels wide enough to contain more data points to prove the ability of this probe to distinguish separate blood vessels. The ones in Fig. 6f were both the extension of arteriacarotis, and the signal peaks could be identified automatically from the background. The fitting result was also satisfying and the FWHM could also be directly read from the diagrams. It should be pointed out that though the apparent resolution was not as high as those of the reported SWNTs46 and Ag2S QDs,2 the CCD detector used in our imaging experiment was Si-CCD, and the quantum efficiency was about 40 percent lower than that of InGaAs-CCD at the working wavelength.3 The image was still clear enough to see the fine blood vessels of nude mice. Considering the high price of an InGaAs-CCD, this probe can be easily promoted for ordinary animal imaging requiring lower cost. The imaging quality might be improved by changing the activator ions and the imaging system in further research.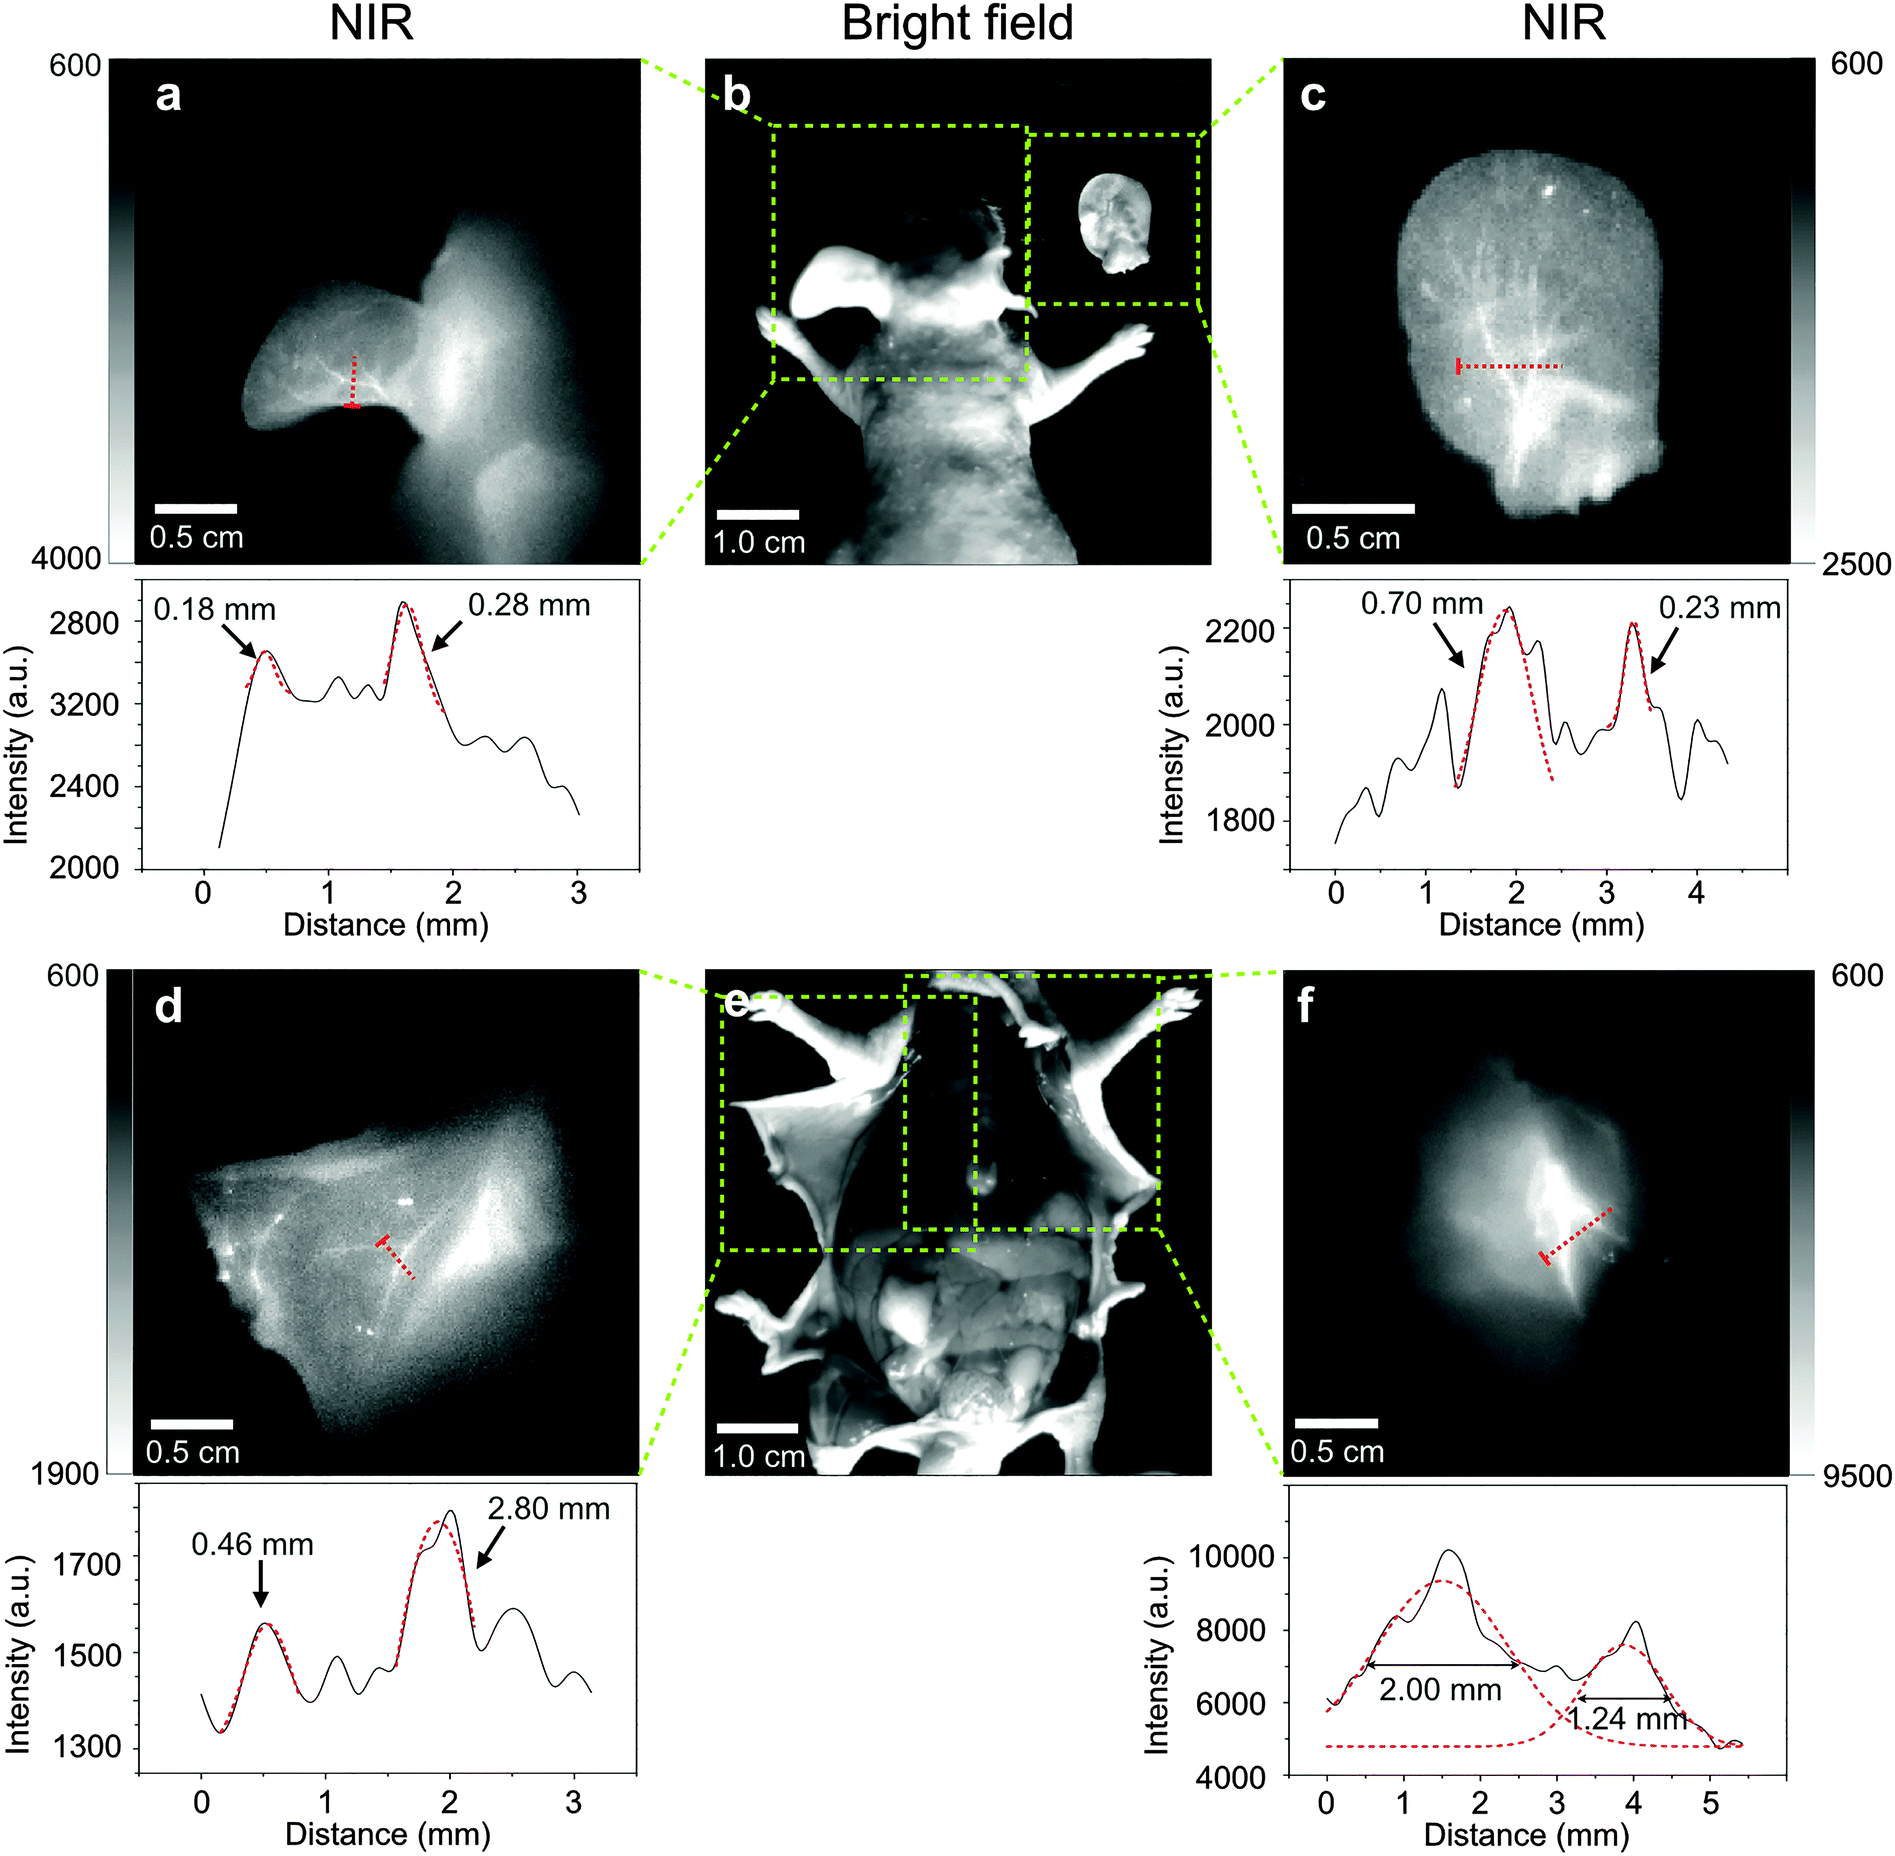 | ||
| Fig. 6 (a) In vivo blood-vessel NIR II imaging of a nude mouse at left ear immediately after intravenous injection. (b) The bight-field picture of the nude mouse in vivo. The corresponding regions of NIR imaging are marked with green squares. (c) The NIR II imaging of the right ear cut immediately after intravenous injection. (d and f) In situ blood-vessel NIR II imaging of a nude mouse. (e) The bight-field picture of the nude mouse in situ. The corresponding regions of NIR imaging are marked with green squares. Cross-sectional fluorescence intensity profiles along red-dashed lines of the mouse are displayed at the bottom. The origin points (distance = 0) are presented with red short bars. Gaussian fits to the profiles are shown in red-dashed curves. The full width at half maximum is also marked in the diagrams. | ||
Bio-distribution after intravenous injection
The distribution of this probe after intravenous injection was also tested. As shown in Fig. S9 (ESI†), the nanocrystals mainly aggregated in the liver of the mouse, showing a strong signal (SNR = 12.8, in vivo). It involved the elimination process of the nanomaterials from blood. It was corresponding to the result of the histology test (Fig. S10, ESI†) that the NPs did not accumulate in lung, so that the possibility of it causing damage in lung was low, while the risk of lung injury was often high when it comes to other nanomaterials.47,48Test of bio-toxicity
One of the most important characteristics of an in vivo imaging probe is bio-compatibility. The possible bio-toxicity of EDTMP–LiYF4:Nd3+ was assessed using MTT assay in the HeLa cell line (Fig. 7). The cell viability did not decrease with the increasing concentration of EDTMP–LiYF4:Nd3+ NPs. Instead, it showed a growing trend as if the NPs exerted a positive influence on the cells. The result is explicable since rare-earth fluorides can promote the growth of living things at low concentration.49 So we may at least conclude that the NPs did not have apparent cytotoxicity. The histology test was also conducted and the H&E stained tissue section did not show obvious lesions in heart, liver, spleen, lung and kidney tissues as well (Fig. S10, ESI†), which proved the good bio-compatibility of EDTMP–LiYF4:Nd3+ NPs.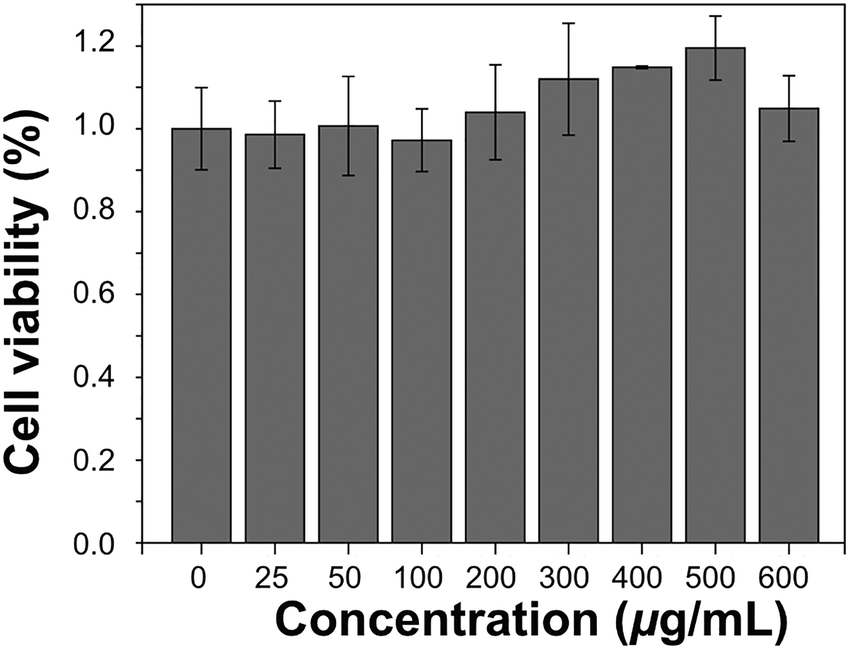 | ||
| Fig. 7 Cytotoxicity of EDTMP–LiYF4:Nd3+ NPs determined for HeLa cells after 24 h of incubation. | ||
Conclusions
In brief, we successfully designed a simple and efficient NIR II probe for lymphatic and circulatory imaging. The newly-adopted host material, LiYF4, enhanced the intensity and the split of emission peaks and was of great bio-compatibility. The activator ion, Nd3+, enabled excitation at 808 nm which gave out emission in the NIR II window, enjoying the merits of high penetration depth and low autofluorescence. The quantum yield of the nanoparticles in cyclohexane was determined to be 28%. This nanomaterial provided great opportunity in bio-imaging and bio-detection, and could be widely promoted at relatively low cost. Further research on transferring traditional rare-earth doped systems to this new host material is also promising.Acknowledgements
This work was financially supported by the National Basic Research Program of China (973 program 2013CB733700), the National Science Foundation of China (21201038 and 21231004), Shanghai Sci. Tech. Comm. (12ZR1440600 and 15QA1400700), and Fudan University's Undergraduate Research Opportunities Program (FDUROP, No. 14026). The authors also acknowledge Dr Qianqian Su, Yuyang Gu and Xianmei Zou for discussion.Notes and references
- R. Y. Tsien, Annu. Rev. Biochem., 1998, 67, 509–544 CrossRef CAS PubMed.
- G. Chen, F. Tian, C. Li, Y. Zhang, Z. Weng, Y. Zhang, R. Peng and Q. Wang, Biomaterials, 2014, 35, 393–400 CrossRef PubMed.
- A. M. Smith, M. C. Mancini and S. Nie, Nat. Nanotechnol., 2009, 4, 710–711 CrossRef CAS PubMed.
- N. Won, S. Jeong, K. Kim, J. Kwag, J. Park, S. G. Kim and S. Kim, Mol. Imaging, 2012, 11, 338–352 CAS.
- G. Hong, J. C. Lee, A. Jha, S. Diao, K. H. Nakayama, L. Hou, T. C. Doyle, J. T. Robinson, A. L. Antaris, H. Dai, J. P. Cooke and N. F. Huang, Circ.: Cardiovasc. Imaging, 2014, 7, 517–525 CrossRef PubMed.
- G. Hong, J. Z. Wu, J. T. Robinson, H. Wang, B. Zhang and H. Dai, Nat. Commun., 2012, 3, 700 CrossRef PubMed.
- H. Yi, D. Ghosh, M.-H. Ham, J. Qi, P. W. Barone, M. S. Strano and A. M. Belcher, Nano Lett., 2012, 12, 1176–1183 CrossRef CAS PubMed.
- K. Welsher, S. P. Sherlock and H. Dai, Proc. Natl. Acad. Sci. U. S. A., 2011, 108, 8943–8948 CrossRef CAS PubMed.
- Z. Liu, X. Sun, N. Nakayama-Ratchford and H. Dai, ACS Nano, 2007, 1, 50–56 CrossRef CAS PubMed.
- S. Shen and Q. Wang, Chem. Mater., 2013, 25, 1166–1178 CrossRef CAS.
- B. Dong, C. Li, G. Chen, Y. Zhang, Y. Zhang, M. Deng and Q. Wang, Chem. Mater., 2013, 25, 2503–2509 CrossRef CAS.
- Y. Zhang, G. Hong, Y. Zhang, G. Chen, F. Li, H. Dai and Q. Wang, ACS Nano, 2012, 6, 3695–3702 CrossRef CAS PubMed.
- G. Hong, J. T. Robinson, Y. Zhang, S. Diao, A. L. Antaris, Q. Wang and H. Dai, Angew. Chem., Int. Ed., 2012, 51, 9818–9821 CrossRef CAS PubMed.
- S. Shen, Y. Zhang, L. Peng, Y. Du and Q. Wang, Angew. Chem., Int. Ed., 2011, 50, 7115–7118 CrossRef CAS PubMed.
- Y. Du, B. Xu, T. Fu, M. Cai, F. Li, Y. Zhang and Q. Wang, J. Am. Chem. Soc., 2010, 132, 1470–1471 CrossRef CAS PubMed.
- G. Hong, Y. Zou, A. L. Antaris, S. Diao, D. Wu, K. Cheng, X. Zhang, C. Chen, B. Liu, Y. He, J. Z. Wu, J. Yuan, B. Zhang, Z. Tao, C. Fukunaga and H. Dai, Nat. Commun., 2014, 5, 4206 CAS.
- K. Welsher, Z. Liu, S. P. Sherlock, J. T. Robinson, Z. Chen, D. Daranciang and H. Dai, Nat. Nanotechnol., 2009, 4, 773–780 CrossRef CAS PubMed.
- S. Kruss, A. J. Hilmer, J. Zhang, N. F. Reuel, B. Mu and M. S. Strano, Adv. Drug Delivery Rev., 2013, 65, 1933–1950 CrossRef CAS PubMed.
- S. D. Perrault, C. Walkey, T. Jennings, H. C. Fischer and W. C. W. Chan, Nano Lett., 2009, 9, 1909–1915 CrossRef CAS PubMed.
- R. Gui, H. Jin, Z. Wang and L. Tan, Coord. Chem. Rev., 2015, 296, 91–124 CrossRef CAS.
- R. Li, Z. Ji, J. Dong, C. H. Chang, X. Wang, B. Sun, M. Wang, Y.-P. Liao, J. I. Zink, A. E. Nel and T. Xia, ACS Nano, 2015, 9, 3293–3306 CrossRef CAS PubMed.
- I. Villa, A. Vedda, I. X. Cantarelli, M. Pedroni, F. Piccinelli, M. Bettinelli, A. Speghini, M. Quintanilla, F. Vetrone, U. Rocha, C. Jacinto, E. Carrasco, F. S. Rodríguez, Á. Juarranz, B. del Rosal, D. H. Ortgies, P. H. Gonzalez, J. G. Solé and D. J. García, Nano Res., 2015, 8, 649–665 CrossRef CAS.
- R. Wang, X. Li, L. Zhou and F. Zhang, Angew. Chem., Int. Ed., 2014, 53, 12086–12090 CrossRef CAS PubMed.
- Z. Wang, P. Zhang, Q. Yuan, X. Xu, P. Lei, X. Liu, Y. Su, L. Dong, J. Feng and H. Zhang, Nanoscale, 2015, 7, 17861–17870 RSC.
- T. Zako, H. Hyodo, K. Tsuji, K. Tokuzen, H. Kishimoto, M. Ito, K. Kaneko, M. Maeda and K. Soga, J. Nanomater., 2010, 2010, 1–7 CrossRef.
- T. Zako, M. Yoshimoto, H. Hyodo, H. Kishimoto, M. Ito, K. Kaneko, K. Soga and M. Maeda, Biomater. Sci., 2015, 3, 59–64 RSC.
- N. Venkatachalam, T. Yamano, E. Hemmer, H. Hyodo, H. Kishimoto and K. Soga, J. Am. Ceram. Soc., 2013, 96, 2759–2765 CrossRef CAS.
- K. Soga, K. Tokuzen, K. Fukuda, H. Hyodo, E. Hemmer, N. Venkatachalm and H. Kishimoto, J. Photopolym. Sci. Technol., 2012, 25, 57–62 CrossRef CAS.
- V. Mahalingam, R. Naccache, F. Vetrone and J. A. Capobianco, Chem. – Eur. J., 2009, 15, 9660–9663 CrossRef CAS PubMed.
- J. E. Geusic, H. M. Marcos and L. G. Van Uitert, Appl. Phys. Lett., 1964, 4, 182–184 CrossRef CAS.
- Y. Luo, G. Tan, G. Dong, H. Ren and A. Xia, Ceram. Int., 2015, 41, 3259–3268 CrossRef CAS.
- G. Chen, T. Y. Ohulchanskyy, S. Liu, W. Law, F. Wu, M. T. Swihart, H. Ågren and P. N. Prasad, ACS Nano, 2012, 6, 2969–2977 CrossRef CAS PubMed.
- U. Rocha, K. U. Kumar, C. Jacinto, I. Villa, F. Sanz-Rodríguez, M. del Carmen Iglesias de la Cruz, A. Juarranz, E. Carrasco, F. C. J. M. van Veggel, E. Bovero, J. G. Solé and D. Jaque, Small, 2014, 10, 1141–1154 CrossRef CAS PubMed.
- E. Carrasco, B. del Rosal, F. Sanz-Rodríguez, Á. J. de la Fuente, P. H. Gonzalez, U. Rocha, K. U. Kumar, C. Jacinto, J. G. Solé and D. Jaque, Adv. Funct. Mater., 2015, 25, 615–626 CrossRef CAS.
- Y.-F. Wang, G.-Y. Liu, L.-D. Sun, J.-W. Xiao, J.-C. Zhou and C.-H. Yan, ACS Nano, 2013, 7, 7200–7206 CrossRef CAS PubMed.
- X. Xie, N. Gao, R. Deng, Q. Sun, Q.-H. Xu and X. Liu, J. Am. Chem. Soc., 2013, 135, 12608–12611 CrossRef CAS PubMed.
- S. Salaun, M. T. Fornoni, A. Bulou, M. Rousseau, P. Simon and J. Y. Gesland, J. Phys.: Condens. Matter, 1997, 9, 6941–6956 CrossRef CAS.
- J. Wang, F. Wang, J. Xu, Y. Wang, Y. Liu, X. Chen, H. Chen and X. Liu, C. R. Chim., 2010, 13, 731–736 CrossRef CAS.
- F. Wang, R. Deng and X. Liu, Nat. Protoc., 2014, 9, 1634–1644 CrossRef CAS PubMed.
- A. Dong, X. Ye, J. Chen, Y. Kang, T. Gordon, J. M. Kikkawa and C. B. Murray, J. Am. Chem. Soc., 2011, 133, 998–1006 CrossRef CAS PubMed.
- L. Xiong, Z. Chen, Q. Tian, T. Cao, C. Xu and F. Li, Anal. Chem., 2009, 81, 8687–8694 CrossRef CAS PubMed.
- S. A. Miller, H. E. Rast and H. H. Caspers, J. Chem. Phys., 1970, 52, 4172–4175 CrossRef CAS.
- V. Mahalingam, F. Vetrone, R. Naccache, A. Speghini and J. A. Capobianco, Adv. Mater., 2009, 21, 4025–4028 CrossRef CAS.
- J. Peng, Y. Sun, L. Zhao, Y. Wu, W. Feng, Y. Gao and F. Li, Biomaterials, 2013, 34, 9535–9544 CrossRef CAS PubMed.
- K. Brindle, Nat. Rev. Cancer, 2008, 8, 94–107 CrossRef CAS PubMed.
- G. Hong, J. C. Lee, J. T. Robinson, U. Raaz, L. Xie, N. F. Huang, J. P. Cooke and H. Dai, Nat. Med., 2012, 18, 1841–1846 CrossRef CAS PubMed.
- P. V. AshaRani, G. Low Kah Mun, M. P. Hande and S. Valiyaveettil, ACS Nano, 2009, 3, 279–290 CrossRef CAS PubMed.
- C.-W. Lam, J. T. James, R. McCluskey, S. Arepalli and R. L. Hunter, Crit. Rev. Toxicol., 2006, 36, 189–217 CrossRef CAS PubMed.
- J. Peng, Y. Sun, Q. Liu, Y. Yang, J. Zhou, W. Feng, X. Zhang and F. Li, Nano Res., 2012, 5, 770–782 CrossRef CAS.
Footnote |
| † Electronic supplementary information (ESI) available. See DOI: 10.1039/c5tb02023a |
| This journal is © The Royal Society of Chemistry 2016 |