 Open Access Article
Anion-exchange membranes with polycationic alkyl side chains attached via spacer units†
Hai-Son
Dang
and
Patric
Jannasch
*
Department of Chemistry, Polymer and Materials Chemistry, Lund University, P.O. Box 124, Lund 221 00, Sweden. E-mail: patric.jannasch@chem.lu.se; Fax: +46-46-222-4012
First published on 21st October 2016
Abstract
Anion-exchange membrane (AEM) fuel cells are promising electrochemical systems for efficient and environmentally benign energy conversion. However, the development of high-performance fuel cells requires new AEMs tailored for high conductivity and chemical stability. Herein, we present the synthesis and characterization of AEMs with polycationic side chains attached to poly(phenylene oxide) (PPO) via flexible alkyl spacer units. Three series of PPOs were functionalized with side chains to study the influence of the number (n = 2–6) of –CH2– groups in between the quaternary ammonium (QA) cations, the ion exchange capacity (IECs), and the number (q = 1–4) of QA cations per side chain. The polymers were prepared by successively reacting bromoalkylated PPO with different tertiary diaminoalkanes and 1,6-dibromohexane. Evaluation of the alkaline stability by 1H NMR spectroscopy and thermogravimetry demonstrated that solvent cast AEMs with n = 2 and 3 quickly degraded via Hofmann β-elimination in 1 M NaOH at 60 °C. In sharp contrast, no degradation was detected for AEMs with n = 4 and 6 after storage in 1 M NaOH at 90 °C over at least 8 days. At similar IECs, the OH− conductivity of the AEMs increased with n up to n = 4, whereafter a plateau was reached. This may be explained by a polyelectrolyte effect leading to counter ion condensation and incomplete ion dissociation when the QA cations were closer than the Bjerrum length (approx. 7 Å). The conductivity of AEMs with n = 6 and IEC = 1.9 meq. g−1 increased only slightly with the number of QA cations per side chain up to q = 3 but then increased sharply with q = 4 to reach 160 mS cm−1 at 80 °C. The present work demonstrated that a molecular architecture with poly-QA side chains attached via flexible spacer units affords AEMs that combine efficient phase separation, high alkaline stability and OH− conductivity at moderate water uptake, provided that the side chains are properly designed to avoid Hofmann elimination and counter ion condensation.
Introduction
Fuel cells constitute a class of potentially environmentally friendly and highly efficient energy conversion systems for both stationary and automotive applications.1 Much of the research in this area has so far been focused on the development of proton exchange membrane fuel cells (PEMFCs), which now stand on the brink of broad commercialization for automotive applications.2 A key component of today's PEMFCs is the perfluorosulfonic acid (PFSA) membrane which serves as a separator between the anode and cathode, and transports protons from the former to the latter electrode. PFSA membranes such as Nafion® and Aquivion® reach high proton conductivity, and possess good mechanical and excellent thermal and chemical stability, providing the PEMFC systems with good power output and long life-times.2 However, despite the beneficial properties of the PFSA membranes, and the fact that a significant progress in the development of the PEMFC has been made lately, a large-scale deployment of PEMFCs will still be problematic and challenging. The dependence on expensive and rare electrocatalysts to facilitate the electrode reactions at low pH and the lack of fuel flexibility are two serious drawbacks of the current PEMFC technology. These shortcomings have recently motivated increasing interest in alkaline membrane fuel cells (AMFCs).3–7 Operating under alkaline conditions offers some distinct and attractive advantages in relation to PEMFCs. The alkaline conditions enable faster oxygen reduction kinetics, more efficient water management, and a much wider choice of fuels, and in addition offer the possibility to employ non-precious metal catalysts based on, e.g., Ni and Ag.3One of the obstacles for the development and commercial introduction of AMFCs is the current lack of anion exchange membranes (AEMs) that combine high OH− conductivity with sufficient mechanical and chemical stability under strongly alkaline conditions.3 In the attempts to meet these demands, AEMs are advantageously based on high-performance aromatic polymers such as poly(phenylene oxide) (PPO) which are devoid of links which are activated for nucleophilic substitution reactions.8 To date, a large variety of different cationic groups tethered to the polymers have been evaluated, including imidazolium, benzimidazolium, phosphonium and sulfonium groups.3,6,7 Still, different quaternary ammonium (QA) cations such as trimethylbenzylammonium and trimethylalkylammonium cations remain state-of-the-art because of their straight-forward synthesis, availability of inexpensive precursors, and widely proven usefulness for membranes, ion-exchange resins, surfactants, etc. Depending on their chemical structure and position on the polymer chain, these QA cations may degrade via, e.g., β-hydrogen Hofmann eliminations, direct nucleophilic substitutions at α-carbons and eliminations via ylide formation under strongly alkaline conditions.3,9 The standard and straight-forward pathway to incorporate QA cations into aromatic polymers typically involves chloromethylation and subsequent substitution of the chlorine atoms by tertiary amine such as trimethylamine to form trimethylbenzylammonium cations.3 Unfortunately, QA cations in benzylic positions have in many cases been shown to be sensitive towards nucleophilic attack, and in addition seem to activate the cleavage of adjacent ether links in aromatic polymer backbones.10
A number of recent studies have reported a significantly enhanced alkaline stability of QA cations when they are attached to the aromatic polymer backbone via flexible alkyl spacers, in comparison with corresponding polymers with benzylic QA cations.11–25 Attaching cations to polymer backbones via long alkyl spacers requires the development of new simple and efficient synthetic pathways in relation to the traditional methods that give QA cations in benzylic positions. Currently, QA cations and imidazolium groups have been attached via alkyl spacers to, e.g., PPOs,11–16 polyfluorenes,17,18 polyolefins19 and poly(arylene ether sulfone)s.20 For example, Yang et al. have prepared PPOs carrying QA cations placed on phenylpropyl spacer units, and reported that only 10% of the conductivity was lost after immersing the AEM in 1 M NaOH at 60 °C over 168 h.11 Zhu and co-workers grafted PPO with fluorene side chains carrying pendant alkyl chains terminated by QA cations.16 The results showed an excellent stability of the AEMs in 1 M NaOH at 80 °C. We have previously reported on a straight-forward method to functionalize PPO with QA cations via flexible alkyl spacer units by reacting lithiated PPO with α,ω-dibromoalkanes, followed by quaternization using trimethylamine.13,14 AEMs based on these polymers showed no structural change by 1H NMR over a period of 192 h in 1 M NaOH at 80 °C. Under the same conditions, corresponding AEMs with benzylic QA cations lost approximately 84% of these.13
Several studies on low-molecular weight organic cationic model compounds have confirmed the significantly higher alkaline stability of cations with alkyl spacer units between the QA cation and aromatic rings, in relation to benzylic ones.9,26,27 Mohanty and Bae concluded that compounds with an alkyl spacer chain in between the aromatic ring and the QA cation are possibly the best candidates for long-term stable cationic moieties.9 Marino and Kreuer found β-protons to be far less sensitive to nucleophilic attack than previously suggested.26 In their analysis of alkyl trimethylammonium cations, the enhanced stability was ascribed to stabilizing sterical and inductive factors. In addition, density functional theory calculations by Pivovar et al. have shown that Hofmann elimination is the most harmful degradation pathway for alkyl trimethylammonium cations.28 Still, because of steric effects, the energy barrier against elimination increases drastically when the number of carbon atoms in the alkyl chain is increased from 2 to 4 and became stable from 4 to 6.28
The synthetic strategy of using flexible spacer units can also be expected to increase the OH− conductivity. The presence of flexible spacers will increase the local mobility of the cations, which in turn facilitates clustering of the ions in the AEM.13,14 This will favor the formation of a well hydrated and percolating OH− conducting phase domain. One strategy to further enhance the ionic conductivity is to place several QA cations on each spacer unit to form polyionic side chains. This provides an opportunity to increase the ion exchange capacity (IEC, meq. g−1) without increasing the degree of functionalization (i.e., the number of side chain attachment sites) of the polymer backbone. Hence, the polymer segments between the side chains can be kept long enough to form large hydrophobic domains which resist excessive water uptake and swelling of the AEM. This strategy has been reported previously, but only with polycationic side chains attached via sensitive benzylic QA cations that are susceptible to degradation.29–32
In the present approach we have prepared PPOs carrying linear polyionic side chains attached via stable heptyl spacer units. In order to systematically study the properties of these materials we prepared three series of polymers to vary the number of methylene units in between the QA cations (Series 1), the ionic content (Series 2) and the number of QA cations per side chain (Series 3). The side chains of the polymers were prepared by successively reacting bromoalkylated PPOs with tertiary diaminoalkanes and dibromohexane, followed by a final Menshutkin reaction with either iodomethane or trimethylamine to form the terminal QA cation. AEMs of these cationic polymers were cast from solutions and studied with respect to morphology, thermal stability, alkaline stability up to 90 °C, water uptake, and OH− conductivity to establish their structure–property relationships.
Experimental section
Materials
Tetrahydrofuran (THF, HPLC grade, Honeywell) was dried over molecular sieves (Acros; 4 Å, 8–12 mesh) before use. Poly(2,6-dimethyl-1,4-phenylene oxide) (PPO, Sigma-Aldrich, Mn = 20 kg mol−1, MwMn−1 = 2.3), n-butyllithium (n-BuLi, 2.5 M, solution in hexanes, Acros), dimethyl sulfoxide-d6 (99+%, Sigma-Aldrich), chloroform-d (99+%, Sigma-Aldrich), 1,6-dibromohexane (98%, Acros), N-methyl-2-pyrrolidone (NMP, reagent grade, Acros), trimethyl amine (TMA, 7.3 M aq. solution, Acros), N,N,N′,N′-tetramethylethylenediamine (99%, Sigma-Aldrich), N,N,N′,N′-tetramethyl-1,3-propanediamine (99+%, Sigma-Aldrich), N,N,N′,N′-tetramethyl-1,4-butanediamine (98%, Sigma-Aldrich), N,N,N′,N′-tetramethyl-1,6-hexanediamine (99%, Sigma-Aldrich), iodomethane (99%, Sigma-Aldrich), diethyl ether (99+%, Sigma-Aldrich), sodium nitrate (99%, Sigma), sodium bromide (99.5%, Sigma-Aldrich), methanol (MeOH, HPLC grade, Honeywell) and 2-propanol (IPA, HPLC grade, Honeywell) were all used as received. Silver nitrate (99.995%, Sigma-Aldrich) was dried under vacuum in the dark before use.Polymer synthesis
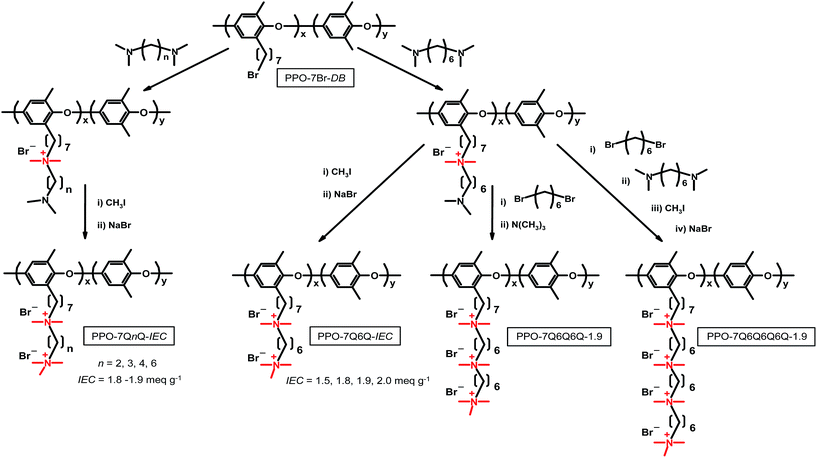
The different polymers were prepared using an approach in which a family of tertiary α,ω-diaminoalkanes and 1,6-dibromohexane were successively employed to build up the target side chains from bromoheptyl functionalized PPO backbones, as outlined in Scheme 1. The IEC values of the final materials were controlled by the degree of bromoalkylation of the PPO precursor. The number of QA cations per side chains was varied by the number of sequential quaternization reactions. The samples containing 2, 3 and 4 QA cations per side chain were designated as PPO-7QnQ-IEC, PPO-7QnQnQ-IEC and 7QnQnQnQ-IEC, respectively, where n is the number of carbon atoms in the alkyl chain between 2 adjacent QA cations, and IEC is the value of the material in the OH− form.Precursor bromoheptyl PPOs with a degree of bromination of 10, 11, 15, 17, 19, and 29% (DB, percentage of bromoalkylated repeating units of the PPO) were prepared via lithiation of PPO and reaction with 1,6-dibromohexane, as described previously.13 The value of DB was controlled by the degree of lithiation, and the samples were designated as PPO-7Br-DB. Here follows a description of the synthesis of PPO-7Br-11. A 4-neck 500 mL round bottomed flask attached to an argon/vacuum line and fitted with a rubber septum and a thermometer was charged with native PPO (4 g, 33.29 mmol repeat units) and dry THF (400 mL). After dissolution under stirring, the solution was first degassed 3 times, heated to 60 °C and then kept for about 40 min to completely dissolve the PPO. The homogeneous solution was allowed to cool to room temperature and was then degassed using 7 vacuum–argon cycles. Subsequently, a few droplets of n-Buli were added until the solution turned faintly yellow in order to consume remaining impurities. Next, 10 mL of n-BuLi (25 mmol) were slowly added drop-wise to the solution, which quickly turned yellow to indicate the formation of lithiated PPO. The reaction was left to proceed at room temperature under stirring for 3 h during which time the solution turned orange-red. The solution was then cooled to −70 °C in an isopropanol-dry ice bath, and a 200% molar excess of 1,6-dibromohexane was quickly added all at once to quench the lithiated sites. The color of the solution immediately turned light yellow to indicate that the alkylation reaction had occurred. The reaction was allowed to proceed overnight under stirring to obtain a colorless solution. Next, the product was precipitated in methanol to isolate a fine white powder which was washed extensively with methanol and then dried under vacuum for 2 days to a constant weight. In all the bromoalkylation reactions, the yield was approximately 100% and no gel formation was detected in any of the products.
The synthesis of the four samples in Series 1 (PPOs having side chains with two QA cations with n = 2, 3, 4 and 6, respectively) was carried out by the reaction of PPO-7Br-15 with N,N,N′,N′-tetramethylethylenediamine, N,N,N′,N′-tetramethyl-1,3-propanediamine, N,N,N′,N′-tetramethyl-1,4-butanediamine, and N,N,N′,N′-tetramethyl-1,6-hexanediamine, respectively. This reaction was followed by a reaction with iodomethane to produce the di-quaternized side chains (Scheme 1). As an example, the synthesis of sample PPO-7Q2Q-1.9 is as follows. An amount of 0.8 g of PPO-7Br-15 (0.78 mmol of Br) was first dissolved in 16 g NMP. The polymer solution was then added drop-wise to N,N,N′,N′-tetramethylethylenediamine (1.3 mL, 8.58 mmol, 1000% excess) and kept at 60 °C for 3 days under stirring. The homogeneous orange-red solution was poured into diethyl ether to precipitate the intermediate as a light yellow powder which was collected by filtration and dried under vacuum at room temperature for 2 days. In the next step, a 5 wt% solution of the polymer in NMP was prepared and a 200% excess of iodomethane was added. The reaction solution was kept in the dark and under stirring at 40 °C for 2 days in order to fully quaternize the terminal amine groups of the side chains. Subsequently, the orange-red solution was poured into diethyl ether to precipitate the final product. The yellow powder was carefully washed with diethyl ether, filtered out and dried under vacuum at room temperature. In order to obtain the pure Br− form of the polymer, the powder was immersed in 200 mL of 1 M aq. NaBr for 2 days at 50 °C under stirring. Next, the polymer was washed extensively with de-ionized water and finally dried under vacuum at room temperature for 2 days before further use. The four samples in Series 2 (PPOs having side chains with two QA cations spaced by 6 carbon atoms) were prepared in a similar way using N,N,N′,N′-tetramethyl-1,6-hexanediamine instead of N,N,N′,N′-tetramethylethylenediamine, and different PPO-7Br-DB precursors to obtain IEC values between 1.5 and 2.0 meq. g−1.
The synthesis of the four samples in Series 3 (PPOs carrying side chains containing 1, 2, 3 and 4 QA cations, respectively, with n = 6) was carried out in a similar way to that in Series 1 and 2, however using sequential quaternizations involving N,N,N′,N′-tetramethyl-1,6-hexanediamine and 1,6-dibromohexane. The synthesis of sample PPO-7Q-1.8 with one QA cation per side chain has been described previously.13,14 Here, an example is given for the synthesis of PPO-7Q6Q6Q-1.9 in three reaction steps. To perform the first step, 0.8 g of PPO-7Br-11 (0.61 mmol of Br) was dissolved in 16 g of NMP. The solution was added drop-by-drop into N,N,N′,N′-tetramethyl-1,6-hexanediamine (1.46 mL, 6.71 mmol) and the resulting solution was kept at 60 °C under stirring for 3 days. The orange solution was poured into diethyl ether to precipitate the first intermediate (designated as PPO-7Q6N). After careful washing in diethyl ether, the intermediate was collected by filtration and dried at room temperature for 2 days. In order to carry out the second step, a 5 wt% solution of PPO-7Q6N in NMP was prepared and slowly added to 1,6-dibromohexane (1.08 mL, 6.71 mmol). The solution was kept at 60 °C under stirring for 3 days to produce the second intermediate (designated as PPO-7Q6Q6Br). This product was precipitated in diethyl ether, filtered out, and dried under vacuum at room temperature for 2 days. In the third reaction step, PPO-7Q6Q6Br was dissolved in NMP to form a solution containing approximately 3 wt% polymer, before adding a 200% excess of trimethylamine. The solution was kept at 40 °C under stirring for 4 days to produce the final product. In order to obtain the pure Br− form, the final product was first precipitated in diethyl ether, then filtered out and extensively washed with diethyl ether, again filtered, and finally dried under vacuum at room temperature until a constant weight was obtained.
Structural characterization
1H-NMR spectra were collected using a Bruker DRX 400 spectrometer, operating at 400.13 MHz, using CDCl3 or DMSO-d6 solutions of the polymers. The Mn and Mw values of the bromoalkylated PPOs were measured by employing a size-exclusion chromatograph system combining a series of three Shodex gel columns (KF-805, -804 and -802.5) and a refractive index detector. For calibration, polystyrenes with low polydispersities (Mn = 650 kg mol−1 from Water Associates, and Mn = 96 and 30 kg mol−1 from Polymer Laboratories, and Mn = 3.18 kg mol−1 from Agilent Technologies) were employed. Dry samples were dissolved in 2 mL of HPLC-grade chloroform and filtered (pore size 0.45 μm). SEC measurements were then performed at room temperature using HPLC-grade chloroform as the mobile phase at a flow rate of 1.0 mL min−1.Membrane preparation
An amount of 0.15 g polymer in the Br− form was first dissolved in 3 g of NMP at room temperature under stirring. The homogeneous solution was carefully poured onto a Petri dish with a diameter of 5 cm and placed in a well-ventilated casting oven at 80 °C for 48 h to complete the casting. The tough, transparent yellow AEM was removed from the Petri dish by immersion in water, washed several times, and stored in de-ionized water at room temperature before further analysis. The average thickness of the wet membranes was ∼60 μm. To convert the AEMs to the OH− form, the samples were fully immersed in 1 M aq. NaOH at room temperature for at least 48 h under nitrogen. In order to ensure complete conversion and removal of any traces of Br−, the NaOH solution was exchanged at least 3 times during the ion-exchange process.Thermal characterization
The thermal stability of the polymers under a nitrogen atmosphere was studied using a TA instruments TGA Q500. The sample was dried in a vacuum oven at 50 °C for at least 48 h until a constant weight was obtained. Subsequently, the sample was pre-heated at 150 °C for 10 min in the TGA furnace to remove possible traces of water before the data collection (pre-heating at 100 °C produced identical results, indicating no degradation at 150 °C). TGA data were then recorded between 50 and 600 °C at a heating rate of 10 °C min−1 under a constant nitrogen flow of 60 mL min−1. The thermal decomposition temperature (Td,95) was noted when the weight loss had reached 5%. The glass transition temperature (Tg) of the bromoalkylated polymers was determined by using differential scanning calorimetry (DSC) on a model Q2000 DSC analyzer from TA instruments. The upper temperature limit of the DSC experiment was set to 280 °C, based on the Td,95 values of the polymers. DSC analysis was performed during the thermal cycle: 20 → 280 → 50 → 280 °C.Determination of ion exchange capacity and water uptake
From the 1H NMR data, the theoretical IEC (IECNMR) of the final quaternized polymers was calculated based on the DB of the respective PPO-7Br precursor polymer assuming full displacement of the Br atoms. The experimental IEC (IECtitr) of the AEMs was determined by Mohr titrations, as described here. The AEM sample in Br− form was dried under vacuum at 50 °C for at least 48 h. Next, 0.050 g of the sample was immersed in 0.2 M NaNO3 (25.00 mL) under stirring for 48 h to fully leach out all the free Br− ions from the polymer to the solution. A volume of 5.0 mL was extracted from the solution and then titrated with aq. AgNO3 (0.01 M) using K2CrO4 as the indicator. The titration was repeated at least 3 times to calculate an average value of IECtitr.AEM samples in the Br− form were dried at 50 °C for at least 48 h to determine the dry weight (WBr). The dry weight in OH− form (WOH) was then precisely calculated using the value of the previously determined IECtitr and the dry weight WBr. In order to measure the wet weight in the OH− form, the dried membrane in Br− form was immersed in 200 mL of 1 M degassed aq. NaOH solution in a desiccator for at least 24 h under a nitrogen atmosphere. The sample was then quickly transferred to a beaker containing 200 mL of de-ionized water and stored for at least 2 h under a nitrogen atmosphere. The transfer/storage procedure was repeated 4–6 times until the wash water maintained neutral pH. Finally, the sample was stored in de-ionized water for at least 24 h to reach equilibrium at room temperature under nitrogen flow. The sample was taken out, wiped with tissue paper, and quickly weighed to determine W′OH. The water uptake (WUOH) was calculated as:
 | (1) |
Using a similar procedure, the water uptake was measured at 40, 60, and 80 °C by employing a heated 100 mL round-bottomed flask with an argon/vacuum inlet/outlet. The hydration number (λ), defined as the number of water molecules per functional group, was calculated as:
 | (2) |
Conductivity measurements
The OH− conductivity of the AEMs was determined by using electrochemical impedance spectroscopy (EIS) using a Novocontrol high resolution dielectric analyzer 1.01S in the frequency range 10−1 to 10−7 Hz at 50 mV. The membrane sample (1.4 cm × 1.4 cm) was placed in a closed glass vial containing 100 mL of 1 M aq. NaOH for at least 24 h under a nitrogen atmosphere to completely convert to the OH− form. In order to ensure complete conversion and removal of any traces of Br−, the NaOH solution was exchanged at least 3 times during the ion-exchange process.31 Next, the sample was transferred to a beaker containing 200 mL of degassed de-ionized water and stored for at least 2 h under a nitrogen atmosphere. The transferring/storing procedure was repeated 4–6 times until the wash water remained neutral. The OH− conductivity values were determined using a two-probe method under fully immersed conditions during the thermal cycle: 20 → 80 → −20 → 80 °C.Small angle X-ray scattering
The morphology of the AEMs was studied by small-angle X-ray scattering (SAXS) analysis. Membrane samples (2 cm × 0.5 cm) in the Br− form were first properly dried under vacuum at 50 °C. SAXS measurements were performed using a SAXSLab ApS instrument (JJ-Xray, Denmark) combined with a microfocus sealed X-ray tube and a Pilatus detector. The scattering vector (q) was calculated as: | (3) |
 | (4) |
Evaluation of alkaline stability
The stability of the membranes under alkaline conditions was studied by 1H NMR spectroscopy, as well as by IEC, OH− conductivity and thermal decomposition measurements.Three weighed samples (∼10 mg) of each membrane were immersed in 350 mL of 1 M aqueous NaOH. The solutions were then degassed and left under nitrogen at 60 or 90 °C. The NaOH solution was exchanged at least 3 times during the test period. After 1, 4 and 8 days of immersion, respectively, samples were taken out, washed carefully with deionized water, and immersed in 1 M aq. NaBr at 60 °C for at least 48 h under stirring to obtain the Br− form. To remove any traces of other anions, the NaBr solutions were exchanged at least 3 times during the ion-exchange process. The samples were then extensively washed to remove any traces of NaBr and stored in deionized water under stirring for at least 24 h at room temperature. After drying at least 24 h at 50 °C under vacuum, the samples were analyzed by TGA and dissolved in DMSO-d6 with gentle heating for 1H NMR measurements.
For the conductivity measurements, samples were kept in a large excess of 1 M NaOH at 90 °C for 8 days, and each sample was then transferred to 100 mL of degassed 1 M aq. NaOH, and stored at room temperature for at least 24 h under nitrogen. The NaOH solution was replaced at least 3 times during the ion-exchange process. Next, the samples were washed intensively with degassed de-ionized water and kept in 100 mL degassed de-ionized water for at least 3 h. The washing and storing were repeated at least 5 times. Finally, the conductivity measurements at 90 °C were carried out under immersed conditions as described above.
Regarding the IEC measurements, samples were kept in a large excess of 1 M NaOH at 90 °C for 8 days under nitrogen. The samples were then washed intensively with de-ionized water before being immersed in 100 mL 1 M NaBr at 60 °C under stirring for 2 days. The NaBr solution was replaced at least 3 times during the ion-exchange process. Subsequently, each sample was washed intensively with degassed de-ionized water and kept in 200 mL degassed de-ionized water for 24 h before being dried at 50 °C for 2 days. The Mohr titrations were finally carried out as described above.
Results and discussion
Polymer synthesis and characterization
The different polymers with polycationic side chains were prepared using an approach in which a series of tertiary α,ω-diaminoalkanes and 1,6-dibromohexane were successively employed in efficient Menshutkin reactions to build up the target side chains from bromoheptyl functionalized PPO backbones, as outlined in Scheme 1. The number of QA cations per side chain was varied by the number of sequential quaternization reactions, and the IEC values of the final AEMs were controlled by the degree of bromoalkylation of the PPO precursor.Using this synthetic procedure, three different series of PPOs carrying multiple QA cations per alkyl side chain were prepared in order to study the effect of (1) the number of carbon atoms in between the QA cations (n), (2) the ionic content, and (3) the number of QA cations per side chain (Scheme 1). In Series 1, the side chains of the PPOs contained two QA cations spaced by n = 2, 3, 4 and 6 methylene units, respectively, while the IECs were kept in the narrow range 1.8–1.9 meq. g−1. Series 2 comprised of PPOs having side chains with two QA cations (n = 6) with IEC values between 1.5 and 2.0 meq. g−1. Finally, Series 3 included PPOs with side chains containing 1, 2, 3 and 4 QA cations, respectively (all with n = 6). Just like in Series 1, the IEC values in this series were kept in a narrow range around 1.9 meq. g−1.
The bromoalkylated PPO-7Br-DB precursor polymers were synthesized by lithiation of native PPO in THF using n-BuLi at −70 °C under argon and then reacted with an excess of 1,6-dibromohexane, as described in our previous reports.13,14 Altogether 6 samples were prepared with DB values between 10 and 29 bromoalkyl side chains per 100 PPO repeating units (Table 1). The successful bromoalkylation of PPO was confirmed by 1H NMR analysis, and the DB value was calculated using the signal from the aromatic protons at 6.4 ppm and that of the –CH2Br protons at 3.4 ppm (ESI, Fig. S1†). In general, the Mn and MwMn−1 values were found to increase after the bromoalkylation (Table 1), indicating limited branching via intermolecular coupling reactions where both the Br atoms of dibromohexane molecules were displaced. No gel fraction was detected in any of the samples, which formed optically clear and filterable (0.25 μm) solutions. In addition, both Td,95 and Tg decreased with increasing DB, as expected (Table 1 and ESI, Fig. S2 and S3,† respectively).
| Sample | M n [kg mol−1] | M w M n −1 [kg mol−1] | DB [%] | T g [°C] | T d,95 [°C] |
|---|---|---|---|---|---|
| a Measured by SEC using polystyrene standards. b Measured by TGA under N2. | |||||
| PPO | 20 | 2.3 | 0 | 216 | 419 |
| PPO-7Br-10 | 29 | 2.6 | 10 | 178 | 365 |
| PPO-7Br-11 | 19 | 2.8 | 11 | 175 | 374 |
| PPO-7Br-15 | 25 | 5.1 | 15 | 173 | 361 |
| PPO-7Br-17 | 28 | 2.8 | 17 | 172 | 364 |
| PPO-7Br-19 | 26 | 9.1 | 19 | 160 | 351 |
| PO-7Br-29 | 22 | 3.8 | 29 | 147 | 345 |
The polymers of Series 1 were prepared by first reacting the PPO-7Br-15 precursor polymer with N,N,N′,N′-tetramethylethylenediamine, N,N,N′,N′-tetramethyl-1,3-propanediamine, N,N,N′,N′-tetramethyl-1,4-butanediamine, and N,N,N′,N′-tetramethyl-1,6-hexanediamine, respectively, in NMP at 60 °C (Scheme 1). This was followed by reactions with iodomethane in NMP at 40 °C to produce the PPO-7QnQ-IEC samples. The 1H NMR spectra shown in Fig. 1 indicated the successful formation of the side chains by the appearance of two new signals at 3.0 and 3.1 ppm arising from the in-chain –N+(CH3)2– and the terminal –N+(CH3)3 protons of the di-QA side chains. The spectrum of PPO-7Q2Q-1.9 showed a characteristic band at 3.9 ppm originating from the four methylene protons in between the QA cations, in α and β positions, respectively, to the two ionic centers. For the other polymers in the series, the signal from the methylene protons in α positions to the QA cations appeared at ∼3.3 ppm and was overlapped by the water signal. The relative intensity of the signal at 1.66 ppm was found to increase with the number of the methylene protons in the β position of QA cations, i.e., it increased with the use of the butyl- and hexyldiamines. Likewise, the intensity of the signal at 1.42 ppm increased with the number of the methylene protons in the γ position of the QA cations. As seen in Table 2, the theoretical IECNMR values corresponded very well with the values obtained by Mohr titrations of the AEMs.
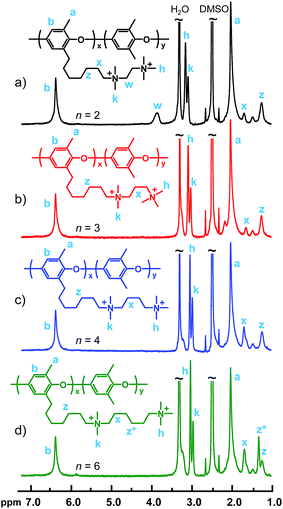 | ||
| Fig. 1 1H NMR spectra of the polymers in Series 1: (a) PPO-7Q2Q-1.9, (b) PPO-7Q3Q-1.8, (c) PPO-7Q4Q-1.8 and (d) PPO-7Q6Q-1.8. | ||
| AEM in OH− form | Precursor polymer | IECNMRa [meq. g−1] | IECtitra [meq. g−1] | T d,95 [°C] | q max [nm−1] | d [nm] | λ |
|---|---|---|---|---|---|---|---|
| a IEC in the OH− form (values within parenthesis are in the Br− form). b Measured by TGA. c Immersed in OH− form at 20 °C. | |||||||
| Series 1 | |||||||
| PPO-7Q2Q-1.9 | PPO-7Br-15 | 1.8 (1.6) | 1.9 (1.7) | 235 | 1.51 | 4.2 | 2 |
| PPO-7Q3Q-1.8 | PPO-7Br-15 | 1.8 (1.6) | 1.8 (1.6) | 242 | 1.46 | 4.3 | 4 |
| PPO-7Q4Q-1.8 | PPO-7Br-15 | 1.8 (1.6) | 1.8 (1.6) | 244 | 1.48 | 4.2 | 6 |
| PPO-7Q6Q-1.8 | PPO-7Br-15 | 1.8 (1.6) | 1.8 (1.6) | 248 | 1.43 | 4.4 | 10 |
![[thin space (1/6-em)]](https://www.rsc.org/images/entities/char_2009.gif) |
|||||||
| Series 2 | |||||||
| PPO-7Q6Q-1.5 | PPO-7Br-11 | 1.4 (1.3) | 1.5 (1.4) | 248 | 1.30 | 4.8 | 10 |
| PPO-7Q6Q-1.8 | PPO-7Br-15 | 1.8 (1.6) | 1.8 (1.6) | 248 | 1.35 | 4.6 | 10 |
| PPO-7Q6Q-1.9 | PPO-7Br-17 | 2.0 (1.8) | 1.9 (1.7) | 252 | 1.40 | 4.5 | 10 |
| PPO-7Q6Q-2.0 | PPO-7Br-19 | 2.2 (1.9) | 2.0 (1.8) | 248 | — | — | 13 |
![[thin space (1/6-em)]](https://www.rsc.org/images/entities/char_2009.gif) |
|||||||
| Series 3 | |||||||
| PPO-7Q-1.8 | PPO-7Br-29 | 1.8 (1.6) | 1.8 (1.6) | 241 | 1.71 | 3.7 | 13 |
| PPO-7Q6Q-1.9 | PPO-7Br-17 | 2.0 (1.8) | 1.9 (1.7) | 252 | 1.40 | 4.5 | 10 |
| PPO-7Q6Q6Q-1.9 | PPO-7Br-11 | 2.0 (1.8) | 1.9 (1.7) | 241 | 1.15 | 5.5 | 12 |
| PPO-7Q6Q6Q6Q-1.95 | PPO-7Br-10 | 2.2 (1.9) | 1.95 (1.75) | 248 | 0.85 | 7.4 | 14 |
The PPO-7Q6Q-IEC samples in Series 2 were prepared in a similar way to that described for Series 1, but utilizing different PPO-7Q-DB precursors to adjust the IEC value to between 1.5 and 2.0 meq. g−1 (Table 2), and using only diaminohexane. The 1H NMR spectra were very similar to those shown in Fig. 1d and, as expected, varied only in the relative intensity of the signals of the side chain protons in relation to the polymer backbone signals. Table 2 shows that the theoretical IECNMR values agreed reasonably well with values obtained by Mohr titrations.
The polymers in Series 3 were prepared in a sequence of Menshutkin reactions with diaminohexane and dibromohexane, finishing with either iodomethane or trimethylamine to form the terminal QA cation of the side chain (Scheme 1). The DB values of the precursor PPO-7Br-DB polymers were selected so that all the final samples would have an IEC close to 1.9 meq. g−1 (Table 2). The synthesis of sample PPO-7Q-1.8, carrying one QA cation per side chain, was prepared as described previously.13,14 As seen in Fig. 2, the 1H NMR spectra of the polymers in Series 3 show the same basic features as those in Series 1 and 2. As expected, in the region between 3.02 and 3.05 ppm the signals from the “in-chain” –N+(CH3)2– protons appeared at lower ppm values than the terminal –N+(CH3)3 protons observed between 3.06 and 3.09 ppm. However, as the number of QA cations per side chain was increased from 1 to 4, the relative intensity of the signal from the “in-chain” –N+(CH3)2– protons increased gradually because the fraction of these QA cations increased (ESI, Fig. S4†). Moreover, this signal was clearly divided into separate shifts for the slightly chemically dissimilar “in-chain” QA cations in the tri- and tetra-QA side chains of PPO-7Q6Q6Q-1.9 and PPO-7Q6Q6Q6Q-1.9, respectively. As mentioned above, the signal from the methylene protons in α positions to the QA cations at ∼3.3 ppm was overlapped by the water signal. The signals from the other methylene protons of the side chains appeared between 1 and 1.75 ppm. As an example, the 1H NMR spectra of the different intermediates obtained in the synthesis of sample PPO-7Q6Q6Q6Q-1.9 are shown in the ESI (Fig. S5†). As in Series 1 and 2, the theoretical IECNMR values of the final polymers agreed quite well with values obtained by Mohr titrations, which indicated complete substitution of the Br atoms in the Menshutkin reactions (Table 2).
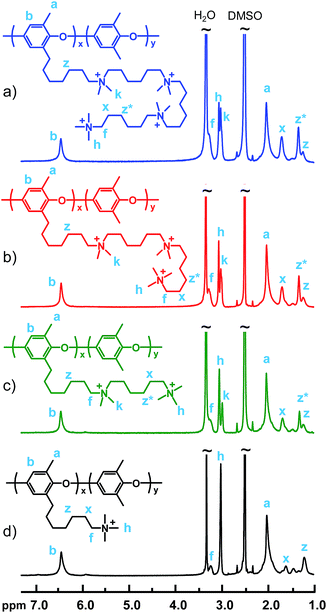 | ||
| Fig. 2 1H NMR spectra of the polymers in Series 3: (a) PPO-7Q6Q6Q6Q-1.9, (b) PPO-7Q6Q6Q-1.9, (c) PPO-7Q6Q-1.9 and (d) PPO-7Q-1.8. | ||
All the samples of Series 1, 2 and 3 were soluble in solvents such as methanol, DMSO, and NMP, but were insoluble in water at 90 °C. This ensures straight-forward processing to, for example, produce AEMs and catalyst layers for different electrochemical devices.
Membrane morphology
Flexible, transparent, mechanically tough and ∼60 μm thick AEMs were cast at 80 °C from NMP solutions of the different cationic polymers (Fig. 3 and ESI, Fig. S6†). The morphology of dry membranes in the Br− form was investigated by small angle X-ray scattering (SAXS). In general, the formation of a morphology with distinct ionic clusters during the membrane casting process greatly facilitates the development of a percolating well-hydrated phase domain for efficient ion transport.33 The characteristic separation distance (d) between the ion-rich domains in a matrix of non-ionic polymer segments can be calculated from the position (qmax) of the so-called ionomer peak.33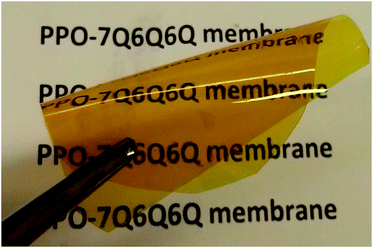 | ||
| Fig. 3 Photographic image of a folded (180°) PPO-7Q6Q6Q-1.9 membrane, showing the excellent flexibility and yellow transparent appearance typical of the present AEMs. | ||
Fig. 4 shows the SAXS data of the different AEMs and the values of qmax and d are collected in Table 2. As seen, the AEMs in Series 1 with di-QA side chains and different values of n showed very similar profiles with distinct ionomer peaks at qmax ∼1.5 nm−1, corresponding to d ∼4 nm. This indicated efficient cluster formation with a rather high level of organization of the QA cations. The peak of PPO-7Q6Q-1.8, with the highest value of n, is positioned at a slightly lower qmax value (1.35 nm−1) indicating d = 4.7 nm. Still, the results showed that the small variation in the distance between the QA cations in the AEMs in Series 1 did not significantly influence the ionic clustering. The SAXS profiles of the AEMs in Series 2 with different IEC values were also very similar. The value of qmax decreased slightly with increasing IEC, from 1.3 to 1.4 nm−1, which gave d = 4.5–4.8 nm. This indicated somewhat larger ionic clusters, and/or larger inter-cluster spacings, at the higher ionic contents.
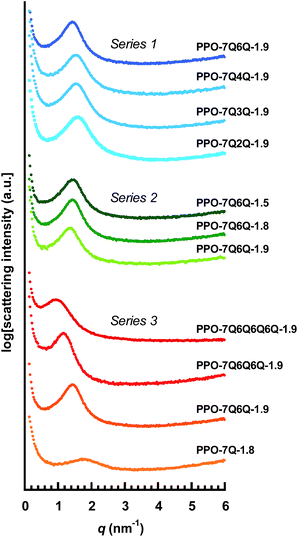 | ||
| Fig. 4 SAXS profiles of dry AEMs based on the different PPOs functionalized with polyionic side chains. The data were measured with the AEMs in the Br− form and have been shifted vertically for clarity. The corresponding values of qmax and d are found in Table 2. | ||
The SAXS profiles of Series 3 with different numbers of QA cations per side chain showed clear differences in the ionic clustering in the four AEMs (Fig. 4). The ionomer peaks of the membranes with mono-, di-, tri- and tetra-QA side chains appeared at qmax = 1.7, 1.4, 1.2 and 0.85 nm−1, which approximately corresponded to d = 3.7, 4.5, 5.5 and 7.4 nm (Table 2). Consequently, the d-value increased distinctly with the number of QA cations per side chain, as seen in Fig. 5. Hence, the concentration of the QA cations onto fewer side chains in the polymer structure favored the hydrophilic–hydrophobic phase separation, i.e., the formation of large ionic clusters.
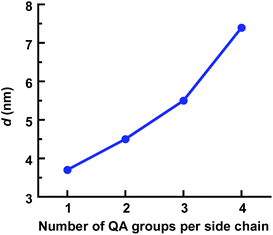 | ||
| Fig. 5 Variation of the d-spacing with the number of QA cations per side chain for the AEMs in Series 3, as evaluated by SAXS. | ||
Water uptake and OH− conductivity
It is vital that the AEMs contain sufficient concentrations of water to facilitate ion dissociation, i.e., creation of charge carriers, and to form a percolating hydrated phase domain for fast transport of the anions. At the same time, it is important to avoid excessive water uptake that causes unacceptable dimensional swelling and impairs the mechanical properties.The water uptake of the AEMs fully immersed in water between 20 and 80 °C is plotted in Fig. 6. As expected, the water uptake increased with temperature. For the AEMs in Series 1 it was clearly observed that, even though the ionic contents of the AEMs were very similar, the water uptake increased progressively with the value of n (Fig. 6a). At 80° C, the AEMs with n = 2, 3, 4 and 6 took up 9, 15, 31 and 61 wt% water, respectively, corresponding to λ values (number of H2O per QA cations) of 3, 5, 10, and 19. It may be that the slightly larger ionic domains indicated by the SAXS data were able to accommodate larger water-rich domains to increase the water uptake. However, a more likely reason was the very close proximity of the QA cations at the low values of n. This most probably caused limitations in the ion dissociation because of electrostatic reasons,34–37 and hence led to lower concentrations of free ions to drive the water uptake by osmosis. This also had a marked influence on the conductivity, as further discussed below.
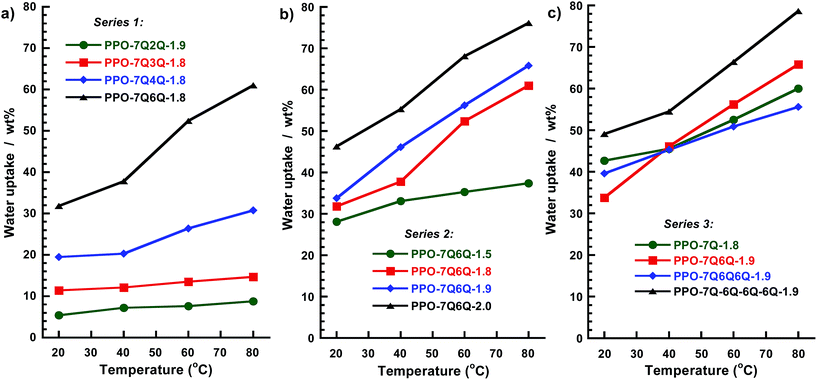 | ||
| Fig. 6 Water uptake of the AEMs in the OH− form in (a) Series 1, (b) Series 2 and (c) Series 3, measured under fully hydrated (immersed) conditions. | ||
As anticipated, the water uptake of the AEMs in Series 2 increased with the IEC value (Fig. 6b). At 80 °C, membrane PPO-7Q6Q-1.5 and PPO-7Q6Q-2.0 took up 37 and 76 wt%, respectively, corresponding to λ values of 14 and 21. Although the SAXS data showed that the d spacing increased with the number of QA cations per side chain, the water uptake data of the AEMs in Series 3 gave no clear trend. Still, PPO-7Q6Q6Q6Q-1.9 took up the most water (79 wt% at 80 °C). Notably, none of the membranes in the three series showed excessive and accelerating water uptake with the temperature.
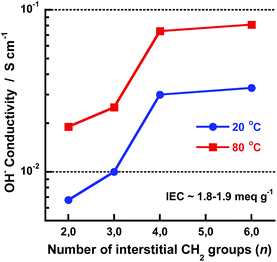
The OH− conductivity data of the AEMs fully immersed in water were measured between −20 and 80 °C by EIS using a sealed two-probe cell. The measurements were performed with a N2 atmosphere in the cell in order to exclude CO2 and avoid carbonate formation. Fig. 7 shows Arrhenius OH− conductivity plots of the AEMs in the three series. As seen, the conductivity increased sharply for some of the membranes between −20 and +20 °C because of melting of frozen water. Above 20 °C, the conductivity showed Arrhenius behaviour with an apparent activation energy of ∼15 kJ mol−1. This was on a par with previously reported values and indicated decoupling from the slow polymer chain dynamics. As seen in Fig. 7a, the conductivity of the membranes in Series 1 increased with the number of methylene groups in between the QA cations (n). Moreover, a large jump in the conductivity was noted when increasing n from 3 to 4 methylene units. At 80 °C, the conductivity of the AEMs with n = 2, 3, 4 and 6 was 19, 25, 74 and 81 mS cm−1, respectively, revealing a 200% increase in conductivity when n increased from 3 to 4 at constant IEC. Fig. 8 shows the OH− conductivity at 20 and 80 °C as a function of n and shows more clearly the distinct increase in the conductivity up to n = 4 whereafter the conductivity reached a plateau. As already mentioned above, the close proximity of the QA cations at low n values most probably caused polyelectrolyte effects which resulted in incomplete ion dissociation and hence reduced conductivity. Theoretically the results may be explained by counter-ion condensation which occurs because of incomplete electrostatic screening when the distance between the ionic charges in the polyelectrolyte falls below the so-called Bjerrum length, determined by the permittivity of the solvent.34 The Bjerrum length in water at 25 °C is ∼7.1 Å.34 This approximately corresponds to the distance between the charged centers of the two QA cations when separated by n = 4 interstitial methylene units. Consequently, when n is larger the ion dissociation should not be limited by electrostatics and the conductivity should not depend on n, just as observed in the present case. We have previously reported on similar effects for hypersulfonated polysulfones34,35 and polysulfones densely functionalized with QA cations on the backbone.36,37
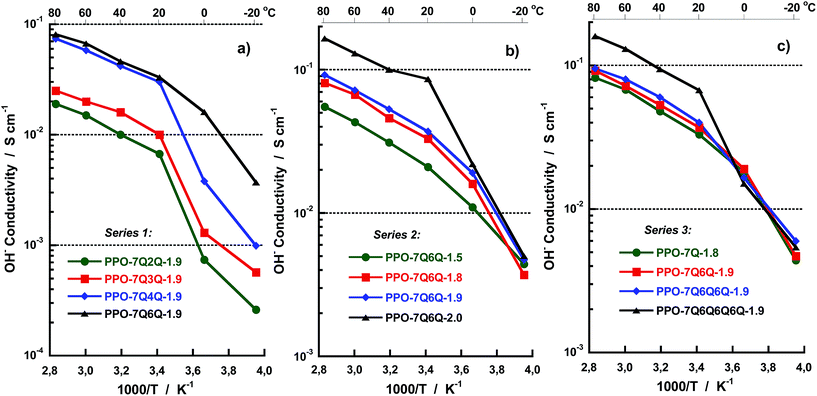 | ||
| Fig. 7 Arrhenius plots of the OH− conductivity of the AEMs in (a) Series 1, (b) Series 2 and (c) Series 3, measured by EIS under fully hydrated (immersed) conditions. | ||
As expected, the conductivity of the AEMs in Series 2 increased with the IEC value above 20 °C, thus following the same trend as the water uptake. Sample PPO-7Q6Q-2.0 reached high conductivities, 86 and 165 mS cm−1 at 20 and 80 °C, respectively (Fig. 7b). The data also suggested that the conductivity increased progressively with the IEC at values above 1.9 meq. g−1 which is expected because the degree percolation of the ion conducting domain typically increases with the IEC in a highly nonlinear way.38
The conductivity data of Series 3 showed quite similar values for the AEMs with mono-, di- and tri-QA side chains, increasing only slightly with the number of QA cations per side chain (Fig. 7c). For example, at 80 °C these AEMs had conductivities in the quite narrow range between 82 and 95 mS cm−1. As mentioned above, the water uptake data showed no clear trend for these AEMs. On the other hand, PPO-7Q6Q6Q6Q-1.9, with tetra-QA side chains, contained almost 80 wt% water and reached a significantly higher value, 160 mS cm−1. Most probably the pronounced ionic clustering and high water content of this AEM led to the formation of even more efficient water channels with a high degree of percolation for ion transport. In fact, very similar results have been reported by Yan and co-workers for PPOs with polycationic side chains attached via benzylic QA cations.29 They found a sharp increase in the hydroxide conductivity when the number of QA cations per side-chain was increased from 3 to 4, and showed by microscopy that this coincided with a distinct increase in the connectivity of the hydrophilic domains when the number of QA groups per side chain exceeded 3. Hence, despite the difference in morphology indicated by the SAXS results, there was only a small difference in the conductivity of PPO-7Q-1.8, PPO-7Q6Q-1.9 and PPO-7Q6Q6Q6Q-1.9. The results thus showed that the presence of spacer units between the polymer backbone and the QA cation in these polymers already ensured an efficient ionic clustering and formation of conduction pathways, and that at least four QA cations per side chain were necessary in order to obtain appreciably larger hydrated domains to promote the conductivity significantly beyond that of PPO-7Q-1.8.
Previously, we have shown that AEMs based on PPO with QA cations placed in benzylic positions directly on the polymer backbone (without spacers) gave rise to only very weak (if any) ionomer peaks by SAXS, and showed significantly lower OH− conductivity than corresponding AEMs where single QA cations were placed via pentyl or heptyl spacer units.14
Membrane PPO-7Q6Q6Q6Q-1.9 showed OH− conductivities of 67 and 160 mS cm−1 at 20 and 80 °C, respectively. The water uptake was then 50 and 78 wt%, respectively. This may be compared with previously reported data on AEMs based on PPO carrying poly-QA side chains attached via benzylic QA cations.29–31 For an AEM with tri-QA side chains, Hickner and co-workers reported conductivities of 72 and 176 mS cm−1 at 20 and 80 °C, respectively, at IEC = 2.74 meq. g−1.31 The water uptake of this membrane was 135 wt% at room temperature, and presumably much higher at 80 °C. Yan et al. prepared PPOs functionalized with side chains having up to six QA cations.29 They reported an decrease in the water uptake with the number of QA cations per side chain, and measured a conductivity of 60 mS cm−1 at 70% water uptake for a membrane with tetra-QA side chains and IEC = 3.05 meq. g−1. Finally, Xu and co-workers reported OH− conductivities of 69 and 119 mS cm−1 at 25 and 80 °C, respectively, for a PPO membrane with tri-QA side chains (IEC = 2.24 meq. g−1).30 Given the comparatively low IEC value and water uptake, membrane PPO-7Q6Q6Q6Q-1.9 of the present work compares quite favourably.
Thermal and alkaline stability
The thermal stability of all AEMs in the Br− form was studied by TGA under N2 at a heating rate of 10 °C min−1 (Fig. 9), and the decomposition temperatures (Td,95) are collected in Table 2. All the membranes degraded in two distinct steps with the first weight loss starting between Td,95 = 240 and 250 °C, ascribed to the loss of the ionic groups. The second weight loss began at around 400 °C when the polymer backbone was degraded. This may be compared with Td,95 = 419 °C for the unmodified PPO.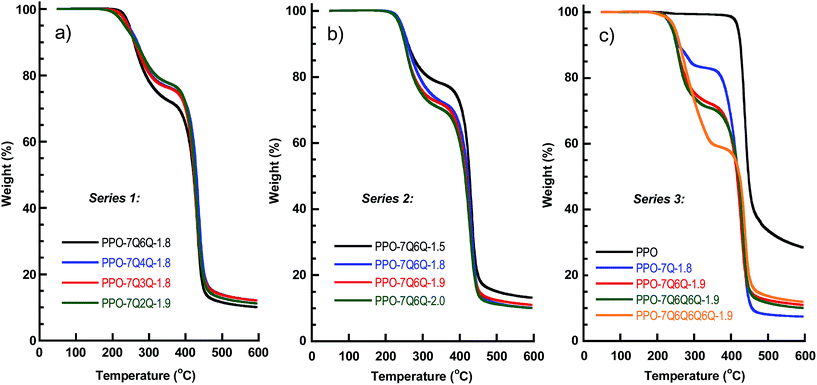 | ||
| Fig. 9 TGA traces of the AEMs in (a) Series 1, (b) Series 2 and (c) Series 3. Samples were measured under N2 at 10 °C min−1. | ||
Considering the AEMs in Series 1, the thermal stability was found to increase with n and Td,95 was 235, 242, 244 and 248 °C for the AEMs with n = 2, 3, 4 and 6, respectively. Clearly, a too close proximity of the positively charged and electron withdrawing QA cations destabilized the side chains. In Series 2, the AEMs with different IEC values all showed the same Td,95 value (∼250 °C). However, as expected, the magnitude of the first weight loss increased with increasing IEC, i.e., increasing concentration of QA cations. The TGA analysis of the AEMs in Series 3 also indicated the same Td,95 value for all membranes. Strikingly, the magnitude of the first weight loss increased markedly with the number of QA cations per side chain. This hinted that the QA cations, together with the alkyl chains in between the ionic groups, were lost in the first degradation step, but seemingly not the spacer units attached to the polymer backbone. In conclusion, the value of Td,95 was between 240 and 250 °C for the AEMs with n = 6, which was well above the typical operating temperatures of most electrochemical energy systems.
The assessment of the alkaline stability of the current AEMs was first performed by immersing the membranes in 1 M aq. NaOH at 60 °C under N2. Samples were extracted after designated periods, ion exchanged to the Br− form, and dissolved in DMSO-d6 before analysis by 1H NMR spectroscopy to identify possible degradation of the polymer structure. Fig. 10a and b show the spectra collected during the evaluation of PPO-7Q2Q-1.9 and PPO-7Q3Q-1.8 in Series 1. As seen, the spectra of these two AEMs clearly changed with the immersion time, involving, e.g., the signals of the benzylic methyl group at 2 ppm, the signals from the QA cations at 3.4 ppm, and the aromatic signal at 6.4 ppm. In addition, in the spectra of PPO-7Q2Q-1.9, the signal of the two methylene groups in between the QA cations at 3.9 ppm had completely disappeared (Fig. 10a). Instead, new signals started to appear at 5.55, 5.72 and 3.01 ppm after 24 h storage, which was consistent with the formation of N+(CH3)2–CH![[double bond, length as m-dash]](https://www.rsc.org/images/entities/char_e001.gif) CH2 groups on the side chains as a result of Hofmann elimination of terminal QA cations. Unfortunately, the signals were rather weak which prevented a definite conclusion. Hofmann elimination can occur on all sides of the two QA cations on the side chains, but the methylene groups in between the ionic groups can be expected to be especially activated and vulnerable for attack by OH−. After 96 h storage in 1 M aq. NaOH at 60 °C membrane PPO-7Q2Q-1.9 became insoluble which prevented further analysis. The spectra of PPO-7Q3Q-1.8 showed similar trends with new signals appearing at 3.9 (2H), 6.0 (1H), 5.6 (2H) and 2.95 ppm (6H) after 24 h storage (Fig. 10b). These signals were stronger than those in the case of PPO-7Q2Q-1.9 and clearly indicated the formation of N+(CH3)2–CH2–CH
CH2 groups on the side chains as a result of Hofmann elimination of terminal QA cations. Unfortunately, the signals were rather weak which prevented a definite conclusion. Hofmann elimination can occur on all sides of the two QA cations on the side chains, but the methylene groups in between the ionic groups can be expected to be especially activated and vulnerable for attack by OH−. After 96 h storage in 1 M aq. NaOH at 60 °C membrane PPO-7Q2Q-1.9 became insoluble which prevented further analysis. The spectra of PPO-7Q3Q-1.8 showed similar trends with new signals appearing at 3.9 (2H), 6.0 (1H), 5.6 (2H) and 2.95 ppm (6H) after 24 h storage (Fig. 10b). These signals were stronger than those in the case of PPO-7Q2Q-1.9 and clearly indicated the formation of N+(CH3)2–CH2–CH![[double bond, length as m-dash]](https://www.rsc.org/images/entities/char_e001.gif) CH2 groups on the side chains as a result of Hofmann elimination of terminal QA cations (Scheme 2). Comparison with the integral of the aromatic signal at 6.5 ppm revealed that approximately 80% of the side chains had been degraded by this mechanism after 24 h. After 96 h storage, the degradation of the membrane had increased further and additional signals emerged at, e.g., 4.2 and 4.7 ppm. Obviously, at n = 2 and 3 methylene groups in between the QA cations, the side chains were highly activated for Hofmann elimination, and this degradation route was unambiguously revealed by the NMR analysis, most clearly in the case of PPO-7Q3Q-1.8. Still, it cannot be excluded that also other degradation routes were active, such as nucleophilic substitution on QA methyl groups and different rearrangements. It should be clarified that any degradation products not covalently bonded to the polymers would likely be leached out during the ion-exchange step before the NMR analysis.
CH2 groups on the side chains as a result of Hofmann elimination of terminal QA cations (Scheme 2). Comparison with the integral of the aromatic signal at 6.5 ppm revealed that approximately 80% of the side chains had been degraded by this mechanism after 24 h. After 96 h storage, the degradation of the membrane had increased further and additional signals emerged at, e.g., 4.2 and 4.7 ppm. Obviously, at n = 2 and 3 methylene groups in between the QA cations, the side chains were highly activated for Hofmann elimination, and this degradation route was unambiguously revealed by the NMR analysis, most clearly in the case of PPO-7Q3Q-1.8. Still, it cannot be excluded that also other degradation routes were active, such as nucleophilic substitution on QA methyl groups and different rearrangements. It should be clarified that any degradation products not covalently bonded to the polymers would likely be leached out during the ion-exchange step before the NMR analysis.
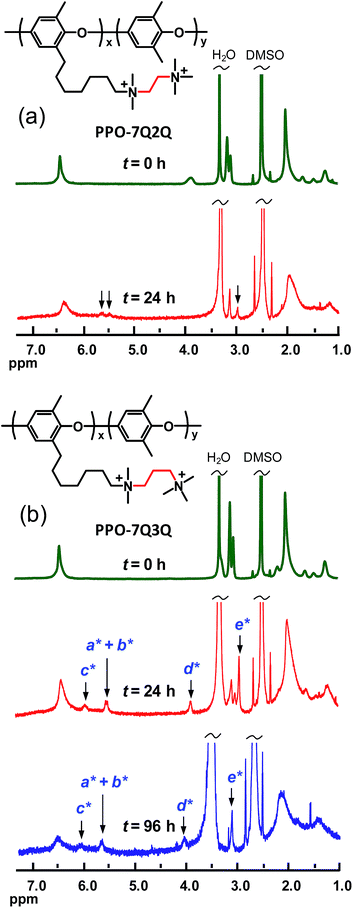 | ||
| Fig. 10 1H NMR spectra of (a) PPO-7Q2Q-1.9 and (b) PPO-7Q3Q-1.8 after up to 96 h storage in 1 M aq. NaOH solution at 60 °C. New signals arising because of degradation through Hofmann eliminations are indicated by arrows (designations viaScheme 2). | ||
 | ||
| Scheme 2 Degradation of the di-QA side chains of PPO-7Q3Q in Series 1 via Hofmann elimination. The 1H NMR signals of the indicated protons are indicated by arrows in Fig. 10. | ||
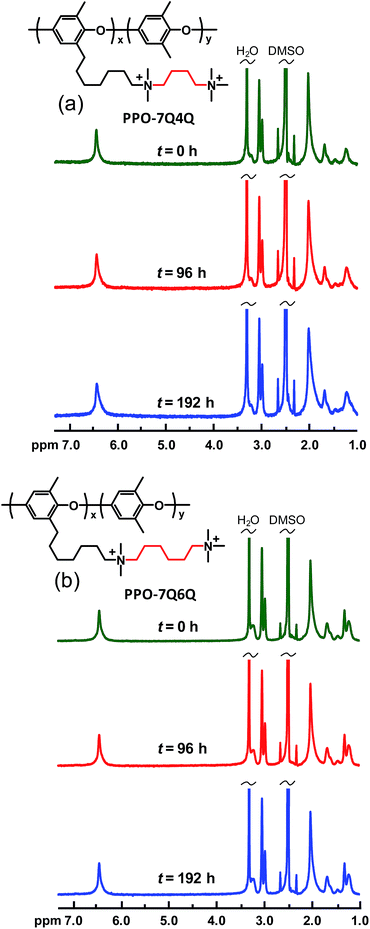
Membranes PPO-7Q4Q-1.8 and PPO-7Q6Q-1.8 were also analyzed after storage in 1 M aq. NaOH at 60 °C. In sharp contrast to PPO-7Q2Q-1.9 and PPO-7Q3Q-1.8, these two AEMs did not show any signs of degradation, and all the NMR signals remained the same with respect to both the position and intensity after 192 h (not shown). In order to further assess the alkaline stability of the AEMs with n = 4 and 6, these membranes were also analyzed after immersion in 1 M aq. NaOH at 90 °C under N2. As seen in Fig. 11, the spectra of PPO-7Q4Q-1.8 and PPO-7Q6Q-1.8 showed no detectable changes after 192 h storage under these conditions. Similarly, none of the AEMs from Series 2 and 3 (all with n = 6) showed any signs of degradation by NMR spectroscopy after storage in 1 M aq. NaOH at 90 °C for 192 h. The spectra of PPO-7Q6Q6Q6Q-1.9 are given in the ESI (Fig. S7†). This was in accordance with our previous results on the AEMs based on PPO-7Q,13,14 and demonstrated the excellent alkaline stability of AEMs with sufficiently long alkyl chains between the PPO backbone and the QA cations, as well as between the QA cations themselves.
Unfortunately, there are no reported NMR studies following the degradation of AEMs based on PPO carrying poly-QA side chains attached via benzylic QA cations. However, Yan and co-workers reported a loss of ∼75% of the conductivity for AEMs based on PPO with di- and tri-QA side chains attached in benzylic sites after storage in 1 M NaOH at 80 °C over 504 h, while the loss was ∼50% for AEMs with tetra- and hexa-QA side chains.29 We have previously reported that the attachment of long alkyl chains to benzylic QA cations on PPO gives only a marginal improvement in alkaline stability.14 This has recently been corroborated in studies of low molecular weight model cations by Hickner et al.27
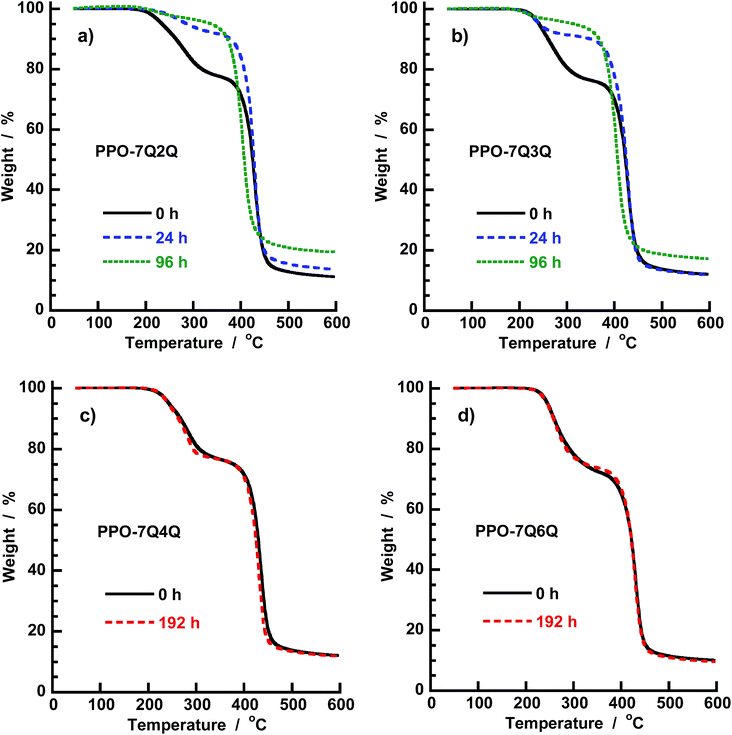
The AEMs kept in 1 M aq. NaOH at 60 and 90 °C, respectively, for different time periods were also analyzed by TGA which is sensitive for the QA content. As seen in Fig. 12a and b, the magnitude of the first degradation step, connected with the loss of the QA functional side chains, decreased with increasing storage time at 60 °C for the PPO-7Q2Q-1.9 and PPO-7Q3Q-1.8 membranes. This was consistent with the decrease of the QA concentration shown by the NMR data. In line with the NMR data, the TGA results indicated that most of the QA cations of these AEMs degraded during the first 24 h. The TGA traces of PPO-7Q4Q-1.8 and PPO-7Q6Q-1.8 after 192 h storage at 90 °C are displayed in Fig. 12c and d. As seen, the traces virtually overlapped with the traces of the original membranes, which strongly indicated that no degradation had occurred during the alkaline treatment. Thus, TGA analysis of AEMs tested for alkaline stability is an excellent complement to NMR data, perhaps especially to confirm that no degradation has occurred.
In addition to the NMR and TGA study, the AEMs of Series 1 were also analysed by IEC and OH− conductivity measurements after 8 day's storage in 1 M aqueous NaOH at 90 °C. As seen in Fig. 13a, the IEC values of PPO-7Q2Q-1.9 and PPO-7Q3Q-1.8 decreased by more than 90% after the test, while PPO-7Q6Q-1.8 and PPO-7Q4Q-1.8 only showed a slight decrease (<6%).
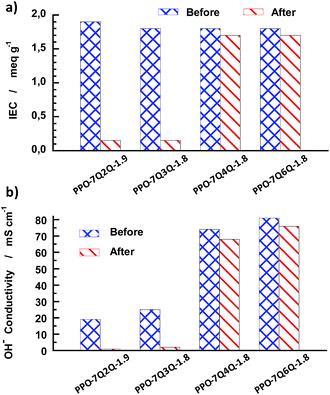 | ||
| Fig. 13 Comparison of the IEC (a) and OH− conductivity at 90 °C (b) before and after 8 days of storage in 1 M aq. NaOH solution at 90 °C. | ||
The conductivity results followed the same trend as the IEC data with a sharp decrease in the values of PPO-7Q2Q-1.9 and PPO-7Q3Q-1.8 by approximately 95 and 92%, respectively (Fig. 13b). In contrast, the OH− conductivity of PPO-7Q4Q-1.8 and PPO-7Q6Q-1.8 merely decreased by 8 and 6%, respectively. Because no degradation or change of the molecular structure was detected by NMR spectroscopy after the alkaline treatment PPO-7Q4Q-1.8 and PPO-7Q6Q-1.8, we attribute the minor decrease in the IEC and conductivity values to morphological changes in these membranes, similar to those that normally follow a conditioning process, and not to macromolecular structure degradation.
Conclusions
We have designed and synthesized PPOs carrying polycationic side chains via heptyl spacer units with the aim to prepare high-performance AEMs. Starting from bromoheptyl functionalized PPO, the side chains were successively built up by reactions with 1,6-dibromohexane and different ternary diaminoalkanes, relying on efficient Menshutkin reactions. In order to clarify the structure–property relationships of these materials we systematically varied the number of methylene units in between the QA cations, the membrane IEC and the number of QA cations per side chain, respectively. SAXS results showed that the characteristic separation distance markedly increased with the number of QA cations per side chain, while the two other parameters gave only a moderate increase. The QA cations of the side chains had to be separated by at least 4 methylene units in order to maximize the conductivity by avoiding counter-ion condensation. The conductivity increased only moderately with the number of QA cations up to three, whereafter the value increased markedly when increasing from 3 to 4. The reason may be that the presence of the spacer already induced an efficient phase separation when the side chain contains one QA cation. The AEMs reached very high OH− conductivities, up to 160 mS cm−1 with tetra-QA side chains. Side chains with less than 4 methylene units in between the QA cations were activated for Hofmann elimination and degraded quickly in 1 M NaOH at 60 °C. It is possible that the increased proximity of the OH− and QA cations in these materials because of counter-ion condensation contributed to the degradation. Side chains with 4 or more methylene units in between the QA cations were very stable and showed no degradation by NMR and TGA analysis after storage in 1 M NaOH up to at least 90 °C. The present work demonstrated that a molecular architecture with poly-QA side chains attached via flexible spacer units affords AEMs that combine efficient phase separation, high alkaline stability and OH− conductivity at moderate water uptake, provided that the side chains are properly designed to avoid Hofmann eliminations and counter ion condensation.Acknowledgements
We thank the Swedish Energy Agency and the Swedish Research Council for Environment, Agricultural Sciences and Spatial Planning for financial support. We are also grateful to Tommy Garting for assistance with SAXS measurements and data treatment.Notes and references
- U. Lucia, Renewable Sustainable Energy Rev., 2014, 30, 164 CrossRef CAS.
- T. Yoshida and K. Kojima, Electrochem. Soc. Interface, 2015, 24, 45 CAS.
- J. R. Varcoe, P. Atanassov, D. R. Dekel, A. M. Herring, M. A. Hickner, P. A. Kohl, A. R. Kucernak, W. E. Mustain, K. Nijmeijer, K. Scott, T. W. Xu and L. Zhuang, Energy Environ. Sci., 2014, 7, 3135 CAS.
- N. W. Li and M. D. Guiver, Macromolecules, 2014, 47, 2175 CrossRef CAS.
- M. A. Hickner, A. M. Herring and E. B. Coughlin, J. Polym. Sci., Part B: Polym. Phys., 2013, 51, 1727 CrossRef CAS.
- G. Couture, A. Alaaeddine, F. Boschet and B. Ameduri, Prog. Polym. Sci., 2011, 36, 1521 CrossRef CAS.
- G. Merle, M. Wessling and K. Nijmeijer, J. Membr. Sci., 2011, 377, 1 CrossRef CAS.
- S. A. Nunez and M. A. Hickner, ACS Macro Lett., 2013, 2, 49 CrossRef CAS.
- A. D. Mohanty and C. Bae, J. Mater. Chem. A, 2014, 2, 17314 CAS.
- C. G. Arges and V. Ramani, Proc. Natl. Acad. Sci. U. S. A., 2013, 110, 2490 CrossRef CAS PubMed.
- Z. J. Yang, J. H. Zhou, S. W. Wang, J. Q. Hou, L. Wu and T. W. Xu, J. Mater. Chem. A, 2015, 3, 15015 CAS.
- J. Wang, H. B. Wei, S. Z. Yang, H. G. Fang, P. Xu and Y. S. Ding, RSC Adv., 2015, 5, 93415 RSC.
- H.-S. Dang, E. A. Weiber and P. Jannasch, J. Mater. Chem. A, 2015, 3, 5280 CAS.
- H.-S. Dang and P. Jannasch, Macromolecules, 2015, 48, 5742 CrossRef CAS.
- H.-S. Dang and P. Jannasch, J. Mater. Chem. A, 2016, 4, 11924 CAS.
- L. Zhu, J. Pan, C. M. Christensen, B. Lin and M. A. Hickner, Macromolecules, 2016, 49, 3300 CrossRef CAS.
- W. H. Lee, A. D. Mohanty and C. Bae, ACS Macro Lett., 2015, 4, 453 CrossRef CAS.
- B. C. Lin, L. H. Qiu, B. Qiu, Y. Peng and F. Yan, Macromolecules, 2011, 44, 9642 CrossRef CAS.
- M. Zhang, J. L. Liu, Y. G. Wang, L. A. An, M. D. Guiver and N. W. Li, J. Mater. Chem. A, 2015, 3, 12284 CAS.
- Y. Z. Zhuo, A. L. Lai, Q. G. Zhang, A. M. Zhu, M. L. Ye and Q. L. Liu, J. Mater. Chem. A, 2015, 3, 18105 CAS.
- E. A. Weiber and P. Jannasch, Macromol. Chem. Phys., 2016, 217, 1108 CrossRef.
- W. H. Lee, Y. S. Kim and C. Bae, ACS Macro Lett., 2015, 4, 814 CrossRef CAS.
- M. Tomoi, K. Yamaguchi, R. Ando, Y. Kantake, Y. Aosaki and H. Kubota, J. Appl. Polym. Sci., 1997, 64, 1161 CrossRef CAS.
- M. R. Hibbs, J. Polym. Sci., Part B: Polym. Phys., 2013, 51, 1736 CrossRef CAS.
- A. D. Mohanty, C. Y. Ryu, Y. S. Kim and C. Bae, Macromolecules, 2015, 48, 7085 CrossRef CAS.
- M. G. Marino and K. D. Kreuer, ChemSusChem, 2015, 8, 513 CrossRef CAS PubMed.
- S. A. Nuñez, C. Capparelli and M. A. Hickner, Chem. Mater., 2016, 28, 2589 CrossRef.
- H. Long, K. Kim and B. S. Pivovar, J. Phys. Chem. C, 2012, 116, 9419–9426 CAS.
- J. Wang, S. Gu, R. Xiong, B. Zhang, B. Xu and Y. Yan, ChemSusChem, 2015, 8, 4229 CrossRef CAS PubMed.
- Y. He, J. Pan, L. Wu, Y. Zhu, X. Ge, J. Ran, Z. Yang and T. Xu, Sci. Rep., 2015, 5, 13417 CrossRef CAS PubMed.
- L. Zhu, J. Pan, Y. Wang, J. Han, L. Zhuang and M. A. Hickner, Macromolecules, 2016, 49, 815 CrossRef CAS.
- Y. B. He, J. J. Si, L. Wu, S. L. Chen, Y. Zhu, J. F. Pan, X. L. Ge, Z. J. Yang and T. W. Xu, J. Membr. Sci., 2016, 515, 189 CrossRef CAS.
- G. Gebel and O. Diat, Fuel Cells, 2005, 5, 261 CrossRef CAS.
- A. Wohlfarth, J. Smiatek, K. D. Kreuer, S. Takamuku, P. Jannasch and J. Maier, Macromolecules, 2015, 48, 1134 CrossRef CAS.
- S. Takamuku, A. Wohlfarth, A. Manhart, P. Räder and P. Jannasch, Polym. Chem., 2015, 6, 1267 RSC.
- E. A. Weiber and P. Jannasch, J. Membr. Sci., 2015, 481, 164 CrossRef CAS.
- E. A. Weiber and P. Jannasch, ChemSusChem, 2014, 7, 2621 CrossRef CAS PubMed.
- K. D. Kreuer, Chem. Mater., 2014, 26, 361 CrossRef CAS.
Footnote |
| † Electronic supplementary information (ESI) available. See DOI: 10.1039/c6ta05939b |
| This journal is © The Royal Society of Chemistry 2016 |

