 Open Access Article
Creative Commons Attribution 3.0 Unported Licence
Extending the cycle life of Na3V2(PO4)3 cathodes in sodium-ion batteries through interdigitated carbon scaffolding†
Xi
Jiang
,
Liuqing
Yang
,
Bo
Ding‡
,
Baihua
Qu§
,
Ge
Ji
and
Jim Yang
Lee
*
Department of Chemical and Biomolecular Engineering, National University of Singapore, 10 Kent Ridge Crescent, Singapore 119260, Singapore. E-mail: cheleejy@nus.edu.sg; Fax: +65 6779 1936; Tel: +65 6516 2899
First published on 26th August 2016
Abstract
The increasing interest in Na-ion batteries is based on their lower projected cost relative to Li-ion batteries and hence are more economically viable for the large-scale storage of electrical energy. Similar to Li-ion batteries, the capacity of Na-ion batteries is cathode-limited. Na3V2(PO4)3 (NVP), a prevalent cathode candidate and one of the most stable Na-ion host materials, still exhibits capacity losses in prolonged cycling. We report herein a method which can improve the durability of NVP in extended use. This is done by using a carbon scaffold to constrain the movement of NVP during charge and discharge reactions. The procedure consists of the sol–gel synthesis of densely aligned dense NVP nanofibers under hydrothermal conditions, followed by sucrose infiltration into the interstices of these fibers to form an interdigitated carbon scaffold after calcination. The NVP-carbon nanocomposite fabricated as such shows ultra-stable cycling performance at very high C-rates, 99.9% capacity retention at 20C for more than 10![[thin space (1/6-em)]](https://www.rsc.org/images/entities/char_2009.gif) 000 cycles, thereby demonstrating the effectiveness of the materials design principles behind this modification strategy.
000 cycles, thereby demonstrating the effectiveness of the materials design principles behind this modification strategy.
Introduction
While lithium-ion batteries (LIBs) are still the most pervasive battery technology for the large scale storage of electrical energy, anxieties about lithium supply due to its region-specific availability and unconfirmed resource estimates have raised concerns about the technology sustainability of lithium chemistry. The interest in (and re-emergence of) sodium ion batteries (NIBs) is therefore motivated by the abundance and ubiquity of sodium resources. The NIB technology was developed in 1980s and shares the same “rocking chair” storage mechanism as LIBs. The standard reduction potential of Na+/Na is only 0.3 V lower than that of Li+/Li, making the switch from LIB to NIB technologically less punishing1 especially if NIBs can be designed to have a long cycle life.Na3V2(PO4)3 (NVP) is a prominent NIB cathode material that has been researched for some time. It features a flat voltage plateau at 3.4 V vs. Na+/Na and a theoretical capacity of 117 mA h g−1 based on the V4+/V3+ redox reaction.2 The research done to date has focused on overcoming the low electronic conductivity of NVP in order to improve its rate performance in battery applications. Nanosizing and carbon coating,3–11 which have been successfully used to address a similar material issue in LiFePO4,12–14 were also applied to NVP. By comparison the cyclability of NVP has received less attention and as such has not improved much over the years. For example, Saravanan et al.7 observed a 50% loss of the initial capacity after cycling at 40C for 30![[thin space (1/6-em)]](https://www.rsc.org/images/entities/char_2009.gif) 000 cycles. Fang et al.4 reported 54% capacity retention after 20
000 cycles. Fang et al.4 reported 54% capacity retention after 20![[thin space (1/6-em)]](https://www.rsc.org/images/entities/char_2009.gif) 000 cycles at 30C. These numbers imply that half of the initial capacity would be lost in less than two months of operation at these rates. This is also an indication that the NVP modification techniques developed to date have not been optimized for cycle stability.
000 cycles at 30C. These numbers imply that half of the initial capacity would be lost in less than two months of operation at these rates. This is also an indication that the NVP modification techniques developed to date have not been optimized for cycle stability.
Capacity loss upon cycling is commonly caused by irreversible side reactions with the electrolyte15 or the dissolution of the active material in the electrolyte.16 For NVP which operates in the moderate voltage window of 2.6 V to 3.8 V (narrower than that of LiFePO4), side reactions are less likely to occur in the common battery electrolyte.15 The stability of the NVP structure also categorically dismisses dissolution in the electrolyte as the major cause for capacity fading. Hence capacity loss is more likely caused by the deterioration of the electrical contact between the active material (NVP) and carbon conducting additive leading to an increase in cell internal resistance with time. The smaller the NVP nanoparticles, the more susceptible they are to the connectivity loss since there are fewer points of contact with the conducting additive and a minor shift in the particle location has a higher probability of losing electrical contact with the surrounding conductive material totally.
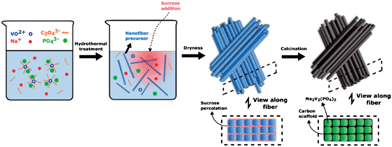
With these considerations we have developed a method which can effectively inhibit the movement of the active material by building an interdigitated carbon scaffold around it. A hydrothermal synthesis is first used to form the active material as high aspect ratio nanofibers (Scheme 1). The ease of high aspect-ratio particles to form arrayed structures is then used to restrain relative particle movement without compromising the nanoscale advantage. This is followed by sol–gel processing with a sucrose solution, and calcination thereafter, to form a connected conducting carbon network which not only facilitates electron transport but also further inhibits the movements of the NVP nanofibers in the bundled structure. The NVP–carbon nanocomposite fabricated as such displays ultra-stable cycling performance at high rates, 99.9% capacity retention at 20C for more than 10![[thin space (1/6-em)]](https://www.rsc.org/images/entities/char_2009.gif) 000 cycles, and validates the materials design principles behind this modification strategy.
000 cycles, and validates the materials design principles behind this modification strategy.
Experimental
Chemicals
Vanadium(V) oxide (V2O5, >98%), ammonium phosphate monobasic (NH4H2PO4, >98%), sucrose (C11H22O11, >99.5%), fluoroethylene carbonate (FEC, C3H3FO3, 99%) and propylene carbonate (PC, C4H5O3, 99.7%) from Sigma Aldrich, sodium carbonate anhydrous (Na2CO3, >99.5%) from Merck, oxalic acid di-hydrate (C2H2O4·2H2O, >99.5%) from Fluka and sodium perchlorate anhydrous (NaClO4, 98.0 wt% min) from Alfa Aesar were used as received.Hydrothermal synthesis of Na3V2(PO4)3 nanofibers
727.52 mg of V2O5 and 1512.84 mg of C2H2O4·2H2O were added to 20 mL deionized water, stirred and heated at 70 °C to form a dark blue transparent solution (A). Separately 635.94 mg of Na2CO3 and 1380.36 mg of NH4H2PO4 were dissolved in 20 mL of deionized water to form solution B. Solution B was slowly drip-added to solution A with stirring and a dark blue colloid was formed. The colloidal mixture was allowed to stir for 1 h and then transferred to a Teflon-lined autoclave where it was heated at 180 °C for 16 h. The resultant light blue suspension after cooling to room temperature was ultra-sonicated for 15 minutes.Carbon coated Na3V2(PO4)3/C composites
Sucrose was used as the carbon source in this study. Na3V2(PO4)3/C composites with different carbon contents were prepared by adding different amounts of sucrose to a NVP solution. In an example synthesis, 200 mg of sucrose was dissolved in the above NVP solution and heated at 80 °C on a hotplate to evaporate the water. The remaining solid was ground and calcined in flowing Ar/H2 (5 vol% 0.1 L min−1) at 150 °C for 2 h and then at 800 °C for 8 h. The Na3V2(PO4)3@C composite formed as such was cooled to room temperature naturally and ground into a fine powder. For comparison a Na3V2(PO4)3 sample without carbon content was also prepared by omitting the use of sucrose.Characterization
The particle morphology was examined by field emission scanning electron microscopy (FESEM) (on a JEOL JSM-6700F) and field emission transmission electron microscopy (FETEM) (on a JEOL 2100F). The phase purity of Na3V2(PO4)3/C was assayed by XRD on a Bruker D8 advance X-ray diffractometer using Cu Kα radiation (1.5405 Å). The carbon content of Na3V2(PO4)3/C was measured by thermogravimetry (TGA) in N2 on a Shimadzu DTG-60H using the temperature range of 20–600 °C and a ramp rate of 10 °C min−1. Tap density was measured by tapping 1 g Na3V2(PO4)3/C 3000 times in a cylindrical container.Electrochemical measurements
An electrode slurry was prepared by mixing Na3V2(PO4)3/C, polyvinylidene fluoride (PVDF) and Super-P in an 8![[thin space (1/6-em)]](https://www.rsc.org/images/entities/char_2009.gif) :
:![[thin space (1/6-em)]](https://www.rsc.org/images/entities/char_2009.gif) 1
1![[thin space (1/6-em)]](https://www.rsc.org/images/entities/char_2009.gif) :
:![[thin space (1/6-em)]](https://www.rsc.org/images/entities/char_2009.gif) 1 ratio by weight in N-methylpyrrolidone (NMP) and stirred vigorously for 8 h. The slurry was applied to an Al foil to an areal density of ∼2 mg cm−2. The counter electrode was a sodium metal foil and the separator was a Whatman glass microfiber paper. The electrolyte was 1 M NaClO4 in PC/FEC (95
1 ratio by weight in N-methylpyrrolidone (NMP) and stirred vigorously for 8 h. The slurry was applied to an Al foil to an areal density of ∼2 mg cm−2. The counter electrode was a sodium metal foil and the separator was a Whatman glass microfiber paper. The electrolyte was 1 M NaClO4 in PC/FEC (95![[thin space (1/6-em)]](https://www.rsc.org/images/entities/char_2009.gif) :
:![[thin space (1/6-em)]](https://www.rsc.org/images/entities/char_2009.gif) 5 v/v) and 1 M NaClO4 in EC/DEC (1
5 v/v) and 1 M NaClO4 in EC/DEC (1![[thin space (1/6-em)]](https://www.rsc.org/images/entities/char_2009.gif) :
:![[thin space (1/6-em)]](https://www.rsc.org/images/entities/char_2009.gif) 1 v/v). The electrodes were assembled into a type 2025 coin test cell in an Ar-filled glove box where the moisture and oxygen contents were below 1 ppm each. The cell was charged and discharged galvanostatically between 3.8 V and 2.6 V on a Neware BTS-5V-10 mA battery tester. Cyclic voltammetry was carried out on a μAutolab type III electrochemical workstation. Specific capacities were calculated based on the weight of Na3V2(PO4)3 only. N2 sorption isotherms were measured up to 1 bar using a Quantachrome Autosorb-iQ surface area and pore size analyzer. Pore size distributions were calculated from the N2 sorption isotherms based on the quenched solid density functional theory (QSDFT) model in the Quantachrome Autosorb-iQ software package.
1 v/v). The electrodes were assembled into a type 2025 coin test cell in an Ar-filled glove box where the moisture and oxygen contents were below 1 ppm each. The cell was charged and discharged galvanostatically between 3.8 V and 2.6 V on a Neware BTS-5V-10 mA battery tester. Cyclic voltammetry was carried out on a μAutolab type III electrochemical workstation. Specific capacities were calculated based on the weight of Na3V2(PO4)3 only. N2 sorption isotherms were measured up to 1 bar using a Quantachrome Autosorb-iQ surface area and pore size analyzer. Pore size distributions were calculated from the N2 sorption isotherms based on the quenched solid density functional theory (QSDFT) model in the Quantachrome Autosorb-iQ software package.
Results and discussion
High aspect ratio Na3V2(PO4)3(NVP) nanoparticles were formed in the first synthesis step. NVP is a NASICON (sodium superionic conductor) structured material with a highly covalent 3D framework and R![[3 with combining macron]](https://www.rsc.org/images/entities/char_0033_0304.gif) c space group symmetry. It consists of [VO6] octahedrons and [PO4] tetrahedrons connected through corner-sharing oxygen to form the [V2(PO4)3]3− framework, and distinct Na+ sites [Na(1), Na(2)] in the interstitial channels which are partially occupied.17 The complexity of the NASICON structure easily leads to non-stoichiometry and difficulties in single crystal formation.18 The direct hydrothermal synthesis of Na3V2(PO4)3 crystals with the desired morphology is a challenging undertaking. In this study we adapted the hydrothermal synthesis of high aspect ratio Li3V2(PO4)3 (ref. 19) to NVP. The hydrothermal synthesis produced a viscous blue suspension; which was found by TEM to consist of fairly long and straight nanofibers (Fig. 1a). The SEM image (Fig. 1b and S1b†) of the nanofibers after drying shows them to be aligned lengthwise which are then stacked into raft-like layers. The nanofibers have a diameter of about 30 nm and a length of 1 to 6 μm; resulting in an aspect ratio ranging from 30 to a few hundreds. The alignment and layering of the nanofibers are expected to be promoted by the straightness of the nanofibers and their high aspect ratios. A carbon coating was used to hold the nanofibers together by adding sucrose to a NVP suspension post-synthesis. During drying, the dissolved sucrose gels formed a continuous network between the nanofibers as shown in Scheme 1, which was then converted into an interpenetrating network of connected carbon after calcination to finalize the preparation of the Na3V2(PO4)3/C composite. The low-magnification SEM image (Fig. 1c) shows NVP/C as 20–30 μm particles with a rough morphology. Due to the dense alignment and the formation of large secondary particles, this nanostructured composite shows a high tap density of ∼1.14 mg cm−3. A higher magnification view of one of such particles (Fig. 1d) shows that it is a secondary particle which preserves the morphology, alignment and close packing of the NVP nanofibers. A closer examination (Fig. 1d inset) confirms the retention of the nanofiber morphology. However, the high calcination temperature has significantly roughened the NVP/C surface relative to the original NVP nanofibers.
c space group symmetry. It consists of [VO6] octahedrons and [PO4] tetrahedrons connected through corner-sharing oxygen to form the [V2(PO4)3]3− framework, and distinct Na+ sites [Na(1), Na(2)] in the interstitial channels which are partially occupied.17 The complexity of the NASICON structure easily leads to non-stoichiometry and difficulties in single crystal formation.18 The direct hydrothermal synthesis of Na3V2(PO4)3 crystals with the desired morphology is a challenging undertaking. In this study we adapted the hydrothermal synthesis of high aspect ratio Li3V2(PO4)3 (ref. 19) to NVP. The hydrothermal synthesis produced a viscous blue suspension; which was found by TEM to consist of fairly long and straight nanofibers (Fig. 1a). The SEM image (Fig. 1b and S1b†) of the nanofibers after drying shows them to be aligned lengthwise which are then stacked into raft-like layers. The nanofibers have a diameter of about 30 nm and a length of 1 to 6 μm; resulting in an aspect ratio ranging from 30 to a few hundreds. The alignment and layering of the nanofibers are expected to be promoted by the straightness of the nanofibers and their high aspect ratios. A carbon coating was used to hold the nanofibers together by adding sucrose to a NVP suspension post-synthesis. During drying, the dissolved sucrose gels formed a continuous network between the nanofibers as shown in Scheme 1, which was then converted into an interpenetrating network of connected carbon after calcination to finalize the preparation of the Na3V2(PO4)3/C composite. The low-magnification SEM image (Fig. 1c) shows NVP/C as 20–30 μm particles with a rough morphology. Due to the dense alignment and the formation of large secondary particles, this nanostructured composite shows a high tap density of ∼1.14 mg cm−3. A higher magnification view of one of such particles (Fig. 1d) shows that it is a secondary particle which preserves the morphology, alignment and close packing of the NVP nanofibers. A closer examination (Fig. 1d inset) confirms the retention of the nanofiber morphology. However, the high calcination temperature has significantly roughened the NVP/C surface relative to the original NVP nanofibers.
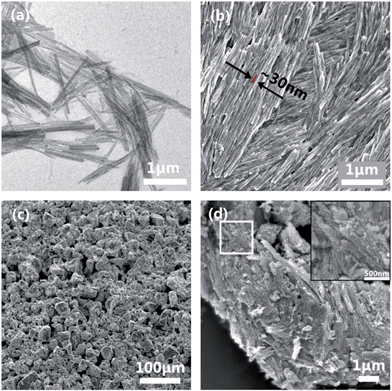 | ||
| Fig. 1 (a and b) TEM and SEM images of the as-synthesized NVP nanofibers; (c) carbon-coated secondary particles after calcination (C8) and (d) a magnified view of a typical secondary particle (C8). | ||
Two Na3V2(PO4)3/C samples with different carbon contents, denoted as C2 and C8 respectively, were produced by varying the amount of sucrose added to the NVP suspension (200 and 800 mg per 1824 mg Na3V2(PO4)3). They were used to measure the impact of carbon content on the rate performance and cycle life. Rietveld refinement of the XRD patterns was used to determine the product phase purity and the crystal structure of NVP. The XRD patterns in Fig. 2a could be indexed to a trigonal lattice in the rhombohedral R![[3 with combining macron]](https://www.rsc.org/images/entities/char_0033_0304.gif) c space group without any other crystalline impurity. The calculated lattice parameters in Table S1† correspond well with the results from a previous report.17 On the whole the XRD data confirm the synthesis of phase pure NASICON Na3V2(PO4)3. The carbon content was measured by TGA in flowing air. Fig. 2b shows that Na3V2(PO4)3/C is stable up to 330 °C, indicating that Na3V2(PO4)3 is safe to use as a sodium-ion cathode material up to a reasonably high temperature. Weight loss began at 330 °C and was maximum at about 460 °C. The carbon contents calculated from these measurements were 1.74 wt% for C2 and 6.95 wt% for C8. A separate measurement indicated that about 17 wt% of carbon was converted from the sucrose source under the prevailing preparation conditions. The Brunauer–Emmett–Teller (BET) surface area and the pore structure of C8 were measured by using the nitrogen adsorption–desorption isotherms. The results in Fig. S7a† were used to derive a surface area of 84.25 m2 g−1 and from Fig. S7b† a pore size distribution dominated by <2 nm micropores. The large surface area and microporous structure are beneficial to support an extensive electrode–electrolyte contact.
c space group without any other crystalline impurity. The calculated lattice parameters in Table S1† correspond well with the results from a previous report.17 On the whole the XRD data confirm the synthesis of phase pure NASICON Na3V2(PO4)3. The carbon content was measured by TGA in flowing air. Fig. 2b shows that Na3V2(PO4)3/C is stable up to 330 °C, indicating that Na3V2(PO4)3 is safe to use as a sodium-ion cathode material up to a reasonably high temperature. Weight loss began at 330 °C and was maximum at about 460 °C. The carbon contents calculated from these measurements were 1.74 wt% for C2 and 6.95 wt% for C8. A separate measurement indicated that about 17 wt% of carbon was converted from the sucrose source under the prevailing preparation conditions. The Brunauer–Emmett–Teller (BET) surface area and the pore structure of C8 were measured by using the nitrogen adsorption–desorption isotherms. The results in Fig. S7a† were used to derive a surface area of 84.25 m2 g−1 and from Fig. S7b† a pore size distribution dominated by <2 nm micropores. The large surface area and microporous structure are beneficial to support an extensive electrode–electrolyte contact.
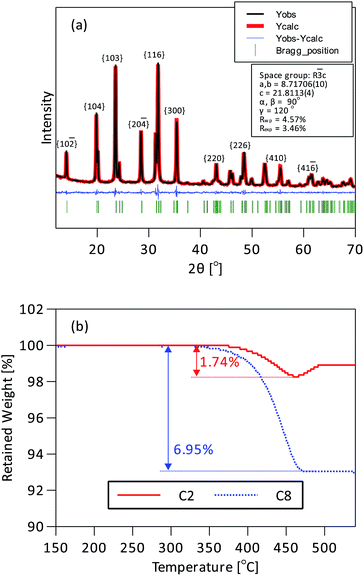 | ||
| Fig. 2 (a) XRD pattern of C8 and its Rietveld refinement. (b) TGA profiles of C2 and C8 between 150° and 550°. | ||
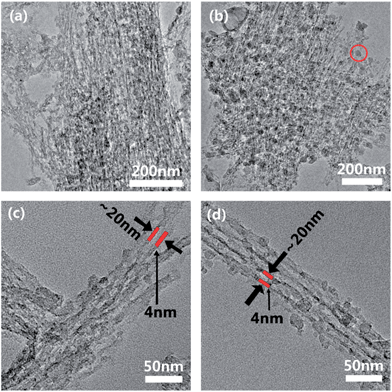
The existence of an extensive interconnected carbon network in the composite was exposed after equilibrating C2 and C8 in 1 mol L−1 HCl solution for 3 days to etch away the Na3V2(PO4)3. The TEM images in Fig. 3a, c and b, d show the residual carbon skeletons in C2 and C8 respectively. The carbon coatings in both cases formed a consolidated network with a similar bundled aligned nanofiber appearance and size as the secondary NVP particles (even after the ultra-sonication in the preparation of TEM samples). The close-up TEM images in Fig. 3c and d confirm the majority of carbon as aligned nanotubes. Independent of the carbon content, the carbon nanofibers were all ∼4 nm in thickness. These observations indicate that the carbon coating filled not only the interstitial space between the neighboring NVP nanofibers but also the free volume in the stacked structure. This formed an interdigitated structure where the NVP nanofibers and the carbon coating were interlocked. Sucrose was essential to retaining the NVP stacked structure as it held the nanofibers in position and prevented their amalgamation during calcination. In the absence of sucrose, the nanofibers amalgamated during calcination to form irregularly shaped particles (Fig. S1†). The carbon content changed mostly the density of the carbon assembly but not the individual fiber-like carbon morphology. The low carbon content in C2 resulted in a looser assembly than in C8 (Fig. 3a–c). The close-up images in Fig. 3b and d confirm the dense packing of carbon surrounding the NVP fibers. The use of excess sucrose in C8 also resulted in the formation of some discrete carbon nanoparticles. These nanoparticles could provide extra electron transport pathways. The width of the carbon-encapsulated Na3V2(PO4)3 was around 12 nm, smaller than that of the nanofibers assembled by using sucrose (∼30 nm) before carbonization.
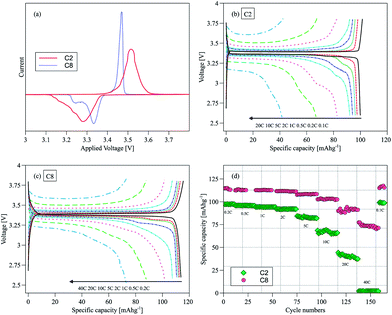
The electrochemical performance of NVP/C was evaluated in half cells using sodium metal as the counter electrode. Fig. 4a shows the cyclic voltammogram (CV) of C2 and C8 in the 2.6–3.8 V voltage window at 0.1 mV s−1. The sharper and more intense redox peaks in C8 (the sample with the higher carbon content) suggest a facile Na+ insertion/extraction process. The narrower separation between the oxidation and reduction peaks is yet another indication of a small electrode polarization. In contrast, the broader and more drawn out voltammetric response of C2 is typical of overall more sluggish kinetics. The oxidation peak at ∼3.45 V and the two distinct reduction peaks at ∼3.20 V and 3.33 V can be assigned to the de-intercalation/intercalation of Na+ as a result of the V4+/V3+ redox reaction.20 In particular the reduction peak at 3.2 V may be associated with the rearrangement in the local redox environment caused by the transfer from Na(1) to Na(2), as has been found in other NASICON Na3M2(PO4)3 (M: Sc, Cr, Fe) structured frameworks.21 In the constant current discharge/charge curves, a peak appeared at 3.2 V initially and shifted progressively towards 3.33 V before it disappeared completely after a few cycles. This was observed for both C2 and C8 samples (Fig. S2a and b†). Interestingly this phenomenon did not affect the cell capacity, as shown in Fig. S3.† There was no similar observation during oxidation. The first cycle efficiencies calculated from the charge and discharge curves in Fig. S4† are 95.3% for C2 and 94% for C8. The first cycle activation process in Fig. S2b† may have contributed to the slightly lower first cycle efficiency of C8.
Rate capability is another important material performance indicator for grid electricity storage. The rate capabilities of C2 and C8 as shown by the discharge curves of both samples at different C rates (1C = 117 mA g−1) are compared in Fig. 4b and c. The rate capability of pure NVP without the carbon scaffold was also measured (Fig. S6a†). The latter delivered ∼90 mA h g−1 at 0.2C and showed large polarization at higher C-rates. The specific capacity of C2 is ∼100 mA h g−1 at the 0.1C rate, indicating that the carbon coating on C2 is inadequate to activate all NVP to deliver the theoretical capacity of 117 mA h g−1. By comparison C8 could deliver 15% more capacity (114 mA h g−1) at twice the C-rate (0.2C). C8 distances even more from C2 in terms of performance at higher rates – delivering 76 mA h g−1 at 40C. Hence the performance of C2 is most likely limited by its low carbon content. The higher carbon content in C8 gave rise to a more extensive carbon surface coating of NVP; and the bridging of neighboring carbon coatings through intervening carbon nanoparticles also formed contiguous networks to facilitate electron and ion transport. Fig. 4d shows the specific capacities of C2 and C8 cycled at different C rates. C2 could only be used at rates lower than 20C while C8 could sustain a 40C operation. The capacity could be restored to its initial value even after cycling at different C rates, which is another indication of the good stability of the material.
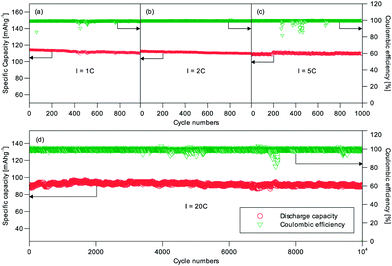
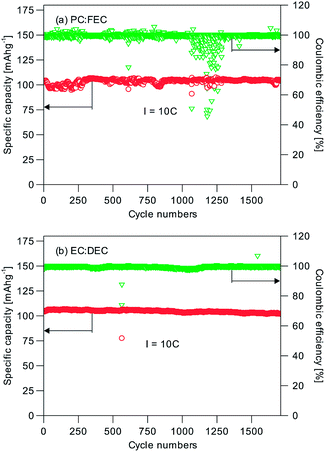
The long-term cycling performance of C2 and C8 was also measured. Fig. 5 shows the results for C8 at the 1C, 2C, 5C and 20C rates. Impressively C8 showed very little capacity difference at these rates. At least 96.1% of the initial capacity was still available after 1000 cycles of operation at the 1C, 2C and 5C (Fig. 5a–c) rates; and 99.9% of the initial capacity was available after 10![[thin space (1/6-em)]](https://www.rsc.org/images/entities/char_2009.gif) 000 cycles at 20C (Fig. 5d). The average coulombic efficiency was close to 100%. It can therefore be concluded that the NVP/C made this way is highly cyclable. The good capacity retention performance represents a notable improvement over previous research in the open literature (Table 1). We have also tested the cells with an alternative electrolyte of 1 M NaClO4/EC
000 cycles at 20C (Fig. 5d). The average coulombic efficiency was close to 100%. It can therefore be concluded that the NVP/C made this way is highly cyclable. The good capacity retention performance represents a notable improvement over previous research in the open literature (Table 1). We have also tested the cells with an alternative electrolyte of 1 M NaClO4/EC![[thin space (1/6-em)]](https://www.rsc.org/images/entities/char_2009.gif) :
:![[thin space (1/6-em)]](https://www.rsc.org/images/entities/char_2009.gif) DEC at 10C. 99.6% of the initial capacity was retained after 1700 cycles (Fig. 6), and hence the different electrolytes used (1 M NaClO4/EC
DEC at 10C. 99.6% of the initial capacity was retained after 1700 cycles (Fig. 6), and hence the different electrolytes used (1 M NaClO4/EC![[thin space (1/6-em)]](https://www.rsc.org/images/entities/char_2009.gif) :
:![[thin space (1/6-em)]](https://www.rsc.org/images/entities/char_2009.gif) DEC vs. 1 M NaClO4/PC
DEC vs. 1 M NaClO4/PC![[thin space (1/6-em)]](https://www.rsc.org/images/entities/char_2009.gif) :
:![[thin space (1/6-em)]](https://www.rsc.org/images/entities/char_2009.gif) FEC) are not the reason for the performance difference. When a C2 sample was tested likewise at the 1C, 2C and 5C rates, Fig. S5† also shows a similar excellent capacity retention; albeit at lower specific capacities. The capacity loss of the NVP without the carbon scaffold was ∼10% at 5C (from 76 mA h g−1 to 68 mA h g−1). Hence the important function of the carbon scaffold to provide a high capacity retention and a long cycle life could be realized even with a low carbon content (1.74 wt%, C2). The combination of stacked raft-like nanofibers and an interdigitated carbon scaffold is therefore an effective means of preserving the active material and extracting the best performance from it. The random drops in efficiency in Fig. 5 and 6 could be caused by some temporary short-circuiting arising from microscopic Na dendrites which penetrated through the glass fiber separator.
FEC) are not the reason for the performance difference. When a C2 sample was tested likewise at the 1C, 2C and 5C rates, Fig. S5† also shows a similar excellent capacity retention; albeit at lower specific capacities. The capacity loss of the NVP without the carbon scaffold was ∼10% at 5C (from 76 mA h g−1 to 68 mA h g−1). Hence the important function of the carbon scaffold to provide a high capacity retention and a long cycle life could be realized even with a low carbon content (1.74 wt%, C2). The combination of stacked raft-like nanofibers and an interdigitated carbon scaffold is therefore an effective means of preserving the active material and extracting the best performance from it. The random drops in efficiency in Fig. 5 and 6 could be caused by some temporary short-circuiting arising from microscopic Na dendrites which penetrated through the glass fiber separator.
| Reference | Active material![[thin space (1/6-em)]](https://www.rsc.org/images/entities/char_2009.gif) : :![[thin space (1/6-em)]](https://www.rsc.org/images/entities/char_2009.gif) carbon black carbon black![[thin space (1/6-em)]](https://www.rsc.org/images/entities/char_2009.gif) : :![[thin space (1/6-em)]](https://www.rsc.org/images/entities/char_2009.gif) binder (by weight) binder (by weight) |
Carbon content | Electrolyte | Capacity retention |
|---|---|---|---|---|
| 7 | 75![[thin space (1/6-em)]](https://www.rsc.org/images/entities/char_2009.gif) : :![[thin space (1/6-em)]](https://www.rsc.org/images/entities/char_2009.gif) 15 15![[thin space (1/6-em)]](https://www.rsc.org/images/entities/char_2009.gif) : :![[thin space (1/6-em)]](https://www.rsc.org/images/entities/char_2009.gif) 10 10 |
6 wt% | 1 M NaClO4/PC![[thin space (1/6-em)]](https://www.rsc.org/images/entities/char_2009.gif) : :![[thin space (1/6-em)]](https://www.rsc.org/images/entities/char_2009.gif) EC (1 EC (1![[thin space (1/6-em)]](https://www.rsc.org/images/entities/char_2009.gif) : :![[thin space (1/6-em)]](https://www.rsc.org/images/entities/char_2009.gif) 1 v/v) 1 v/v) |
1000 cycles at 1C, 86.7%; 1000 cycles at 10C, 84.9%; 3500 cycles at 20C, 89.7%; 30![[thin space (1/6-em)]](https://www.rsc.org/images/entities/char_2009.gif) 000 cycles at 40C, 50% 000 cycles at 40C, 50% |
| 4 | 70![[thin space (1/6-em)]](https://www.rsc.org/images/entities/char_2009.gif) : :![[thin space (1/6-em)]](https://www.rsc.org/images/entities/char_2009.gif) 20 20![[thin space (1/6-em)]](https://www.rsc.org/images/entities/char_2009.gif) : :![[thin space (1/6-em)]](https://www.rsc.org/images/entities/char_2009.gif) 10 10 |
6.41 wt% | 1 M NaClO4/EC![[thin space (1/6-em)]](https://www.rsc.org/images/entities/char_2009.gif) : :![[thin space (1/6-em)]](https://www.rsc.org/images/entities/char_2009.gif) DEC (1 DEC (1![[thin space (1/6-em)]](https://www.rsc.org/images/entities/char_2009.gif) : :![[thin space (1/6-em)]](https://www.rsc.org/images/entities/char_2009.gif) 1 v/v) 1 v/v) |
10![[thin space (1/6-em)]](https://www.rsc.org/images/entities/char_2009.gif) 000 cycles at 20C, 70%; 20 000 cycles at 20C, 70%; 20![[thin space (1/6-em)]](https://www.rsc.org/images/entities/char_2009.gif) 000 cycles at 30C, 54%; 10 000 cycles at 30C, 54%; 10![[thin space (1/6-em)]](https://www.rsc.org/images/entities/char_2009.gif) 000 cycles at 50C, 57% 000 cycles at 50C, 57% |
| 5 | 80![[thin space (1/6-em)]](https://www.rsc.org/images/entities/char_2009.gif) : :![[thin space (1/6-em)]](https://www.rsc.org/images/entities/char_2009.gif) 10 10![[thin space (1/6-em)]](https://www.rsc.org/images/entities/char_2009.gif) : :![[thin space (1/6-em)]](https://www.rsc.org/images/entities/char_2009.gif) 10 10 |
12.5 wt% | 1 M NaClO4/PC | 700 cycles at 5C, 96.1% |
| This work | 80![[thin space (1/6-em)]](https://www.rsc.org/images/entities/char_2009.gif) : :![[thin space (1/6-em)]](https://www.rsc.org/images/entities/char_2009.gif) 10 10![[thin space (1/6-em)]](https://www.rsc.org/images/entities/char_2009.gif) : :![[thin space (1/6-em)]](https://www.rsc.org/images/entities/char_2009.gif) 10 10 |
6.95 wt% | 1 M NaClO4/PC![[thin space (1/6-em)]](https://www.rsc.org/images/entities/char_2009.gif) : :![[thin space (1/6-em)]](https://www.rsc.org/images/entities/char_2009.gif) FEC (95 FEC (95![[thin space (1/6-em)]](https://www.rsc.org/images/entities/char_2009.gif) : :![[thin space (1/6-em)]](https://www.rsc.org/images/entities/char_2009.gif) 5 v/v) 5 v/v) |
1000 cycles at 1C, 96.1%; 1000 cycles at 2C, 97.5%; 1000 cycles at 5C, 101%; 1700 cycles at 10C, 99.62%; 10![[thin space (1/6-em)]](https://www.rsc.org/images/entities/char_2009.gif) 000 cycles at 20C, 99.9% 000 cycles at 20C, 99.9% |
Conclusions
Densely packed aligned Na3V2(PO4)3 (NVP) nanofibers with a high tap density (1.14 g cm−3) and an interdigitated carbon scaffold were produced by a hydrothermal – sol–gel processing method. They exhibited both excellent rate capability (−65% of the theoretical capacity retention at 40C) and an outstanding cycle life (99.9% of the initial capacity retention after 10![[thin space (1/6-em)]](https://www.rsc.org/images/entities/char_2009.gif) 000 cycles at 20C). The good application performance could be attributed to the synergy in integrating an assembled nanofiber structure with an interconnecting and interpenetrating carbon network to maximize the utility of NVP. Stable cycling could be realized even with a very low carbon content (1.74 wt% as in the C2 sample). Increasing the carbon content simply improves the available capacity and the rate capability.
000 cycles at 20C). The good application performance could be attributed to the synergy in integrating an assembled nanofiber structure with an interconnecting and interpenetrating carbon network to maximize the utility of NVP. Stable cycling could be realized even with a very low carbon content (1.74 wt% as in the C2 sample). Increasing the carbon content simply improves the available capacity and the rate capability.
Acknowledgements
X. J. acknowledges the National University of Singapore for his research scholarship.Notes and references
- S.-W. Kim, D.-H. Seo, X. Ma, G. Ceder and K. Kang, Adv. Energy Mater., 2012, 2, 710–721 CrossRef CAS.
- Z. Jian, L. Zhao, H. Pan, Y.-S. Hu, H. Li, W. Chen and L. Chen, Electrochem. Commun., 2012, 14, 86–89 CrossRef CAS.
- C. Zhu, K. Song, P. A. van Aken, J. Maier and Y. Yu, Nano Lett., 2014, 14, 2175–2180 CrossRef CAS PubMed.
- Y. Fang, L. Xiao, X. Ai, Y. Cao and H. Yang, Adv. Mater., 2015, 27, 5895–5900 CrossRef CAS PubMed.
- W. Duan, Z. Zhu, H. Li, Z. Hu, K. Zhang, F. Cheng and J. Chen, J. Mater. Chem. A, 2014, 2, 8668–8675 CAS.
- Y. Jiang, Z. Yang, W. Li, L. Zeng, F. Pan, M. Wang, X. Wei, G. Hu, L. Gu and Y. Yu, Adv. Energy Mater., 2015, 5, 1402104 CrossRef.
- K. Saravanan, C. W. Mason, A. Rudola, K. H. Wong and P. Balaya, Adv. Energy Mater., 2013, 3, 444–450 CrossRef CAS.
- P. Hu, X. Wang, T. Wang, L. Chen, J. Ma, Q. Kong, S. Shi and G. Cui, Adv. Sci., 2016, 1600112 CrossRef.
- P. Nie, Y. Zhu, L. Shen, G. Pang, G. Xu, S. Dong, H. Dou and X. Zhang, J. Mater. Chem. A, 2014, 2, 18606–18612 CAS.
- P. Hu, X. Wang, J. Ma, Z. Zhang, J. He, X. Wang, S. Shi, G. Cui and L. Chen, Nano Energy, 2016, 26, 382–391 CrossRef CAS.
- J. Fang, S. Wang, Z. Li, H. Chen, L. Xia, L. Ding and H. Wang, J. Mater. Chem. A, 2016, 4, 1180–1185 CAS.
- B. Ding, G. Ji, Y. Ma, P. Xiao, L. Lu and J. Y. Lee, J. Power Sources, 2014, 247, 273–279 CrossRef CAS.
- B. Ding, W. C. Tang, G. Ji, Y. Ma, P. Xiao, L. Lu and J. Y. Lee, J. Power Sources, 2014, 265, 239–245 CrossRef CAS.
- J. Wang and X. Sun, Energy Environ. Sci., 2012, 5, 5163–5185 CAS.
- K. Edström, T. Gustafsson and J. O. Thomas, Electrochim. Acta, 2004, 50, 397–403 CrossRef.
- Y. Xia, Y. Zhou and M. Yoshio, J. Electrochem. Soc., 1997, 144, 2593–2600 CrossRef CAS.
- I. V. Zatovsky, Acta Crystallogr., Sect. E: Struct. Rep. Online, 2010, 66, i12 CAS.
- K. Byrappa and M. Yoshimura, Handbook of Hydrothermal Technology. A Technology for Crystal Growth and Materials Processing, Byrappa M Yoshimura-Noyes Publ, Park Ridge NJ, 2001 Search PubMed.
- Q. Wei, Q. An, D. Chen, L. Mai, S. Chen, Y. Zhao, K. M. Hercule, L. Xu, A. Minhas-Khan and Q. Zhang, Nano Lett., 2014, 14, 1042–1048 CrossRef CAS PubMed.
- S. Y. Lim, H. Kim, R. A. Shakoor, Y. Jung and J. W. Choi, J. Electrochem. Soc., 2012, 159, A1393–A1397 CrossRef CAS.
- C. Masquelier, C. Wurm, J. Rodríguez-Carvajal, J. Gaubicher and L. Nazar, Chem. Mater., 2000, 12, 525–532 CrossRef CAS.
Footnotes |
| † Electronic supplementary information (ESI) available. See DOI: 10.1039/c6ta05030a |
| ‡ Present address: School of Materials Science and Engineering, Nanyang Technological University, Block N4.1, Nanyang Avenue, Singapore 639798, Singapore. |
| § Present address: Pen-Tung Sah Institute of Micro-Nano Science and Technology, Xiamen University, No. 422, Siming South Road, Xiamen 361005, PR China. |
| This journal is © The Royal Society of Chemistry 2016 |

