 Open Access Article
Creative Commons Attribution 3.0 Unported Licence
A symmetric organic-based nonaqueous redox flow battery and its state of charge diagnostics by FTIR†
Wentao
Duan‡
 ab,
Rama S.
Vemuri‡
ab,
Jarrod D.
Milshtein
ab,
Rama S.
Vemuri‡
ab,
Jarrod D.
Milshtein
 ac,
Sydney
Laramie
ad,
Rylan D.
Dmello
ae,
Jinhua
Huang
af,
Lu
Zhang
af,
Dehong
Hu
b,
M.
Vijayakumar
ab,
Wei
Wang
ab,
Jun
Liu
ab,
Robert M.
Darling
ag,
Levi
Thompson
ad,
Kyle
Smith
ae,
Jeffery S.
Moore
ae,
Fikile R.
Brushett
*ac and
Xiaoliang
Wei
*ab
aJoint Center for Energy Storage Research (JCESR), USA
bPacific Northwest National Laboratory, 902 Battelle Blvd, Richland, WA 99352, USA. E-mail: Xiaoliang.Wei@pnnl.gov
cMassachusetts Institute of Technology, 77 Massachusetts Ave, Cambridge, MA 02139, USA. E-mail: brushett@mit.edu
dUniversity of Michigan, 500 S State St, Ann Arbor, MI 48109, USA
eUniversity of Illinois Urbana-Champaign, 405 North Mathews Ave, Urbana, IL 61801, USA
fArgonne National Laboratory, 9700 South Cass Ave, Lemont, IL 60439, USA
gUnited Technologies Research Center, 411 Silver Lane, East Hartford, CT 06108, USA
First published on 10th March 2016
Abstract
Redox flow batteries have shown outstanding promise for grid-scale energy storage to promote utilization of renewable energy and improve grid stability. Nonaqueous battery systems can potentially achieve high energy density because of their broad voltage window. In this paper, we report a new organic redox-active material for use in a nonaqueous redox flow battery, 2-phenyl-4,4,5,5-tetramethylimidazoline-1-oxyl-3-oxide (PTIO) that has high solubility (>2.6 M) in organic solvents. PTIO exhibits electrochemically reversible disproportionation reactions and thus can serve as both anolyte and catholyte redox materials in a symmetric flow cell. The PTIO flow battery has a moderate cell voltage of ∼1.7 V and shows good cyclability under both cyclic voltammetry and flow cell conditions. Moreover, we demonstrate that FTIR can offer accurate estimation of the PTIO concentration in electrolytes and determine the state of charge of the PTIO flow cell, suggesting FTIR as a powerful online battery status sensor. This study is expected to inspire more insights in this under-addressed area of state of charge analysis aiming at operational safety and reliability of flow batteries.
Introduction
Redox flow batteries (RFBs) show great promise for grid energy storage by enabling reliable integration of intermittent renewable energy and improving grid stability and efficiency.1–3 RFBs store energy in externally contained liquid-phase electrolytes that are circulated through the electrodes for energy conversion. Thus, energy and power of RFBs can be independently controlled by scaling the tank size and the reactor area, respectively. Such features afford high scalability and modular manufacturing suitable for large-scale stationary applications. Despite significant advances, aqueous RFBs are generally limited by the narrow electrochemical window to avoid electrolysis of water (∼1.5 V).4–6 In contrast, nonaqueous electrolytes can provide broader voltage windows (2–5 V) that may enable energy-dense, low-cost storage systems.7 As such, nonaqueous RFBs have attracted considerable attention.8–10 A wide spectrum of nonaqueous flow chemistries in various cell designs have been investigated including metal-coordinated complexes,11,12 metal ionic liquids,13,14 all-organic,15–18 semi-solid,19,20 redox active polymers,21 and Li metal hybrid flow batteries22 (such as Li/polysulfide23,24 and Li/organic25–29). Among them, organic-based electroactive compounds are particularly attractive due to their structural diversity, molecular tailorability, environmental benignity, and potentially low cost.30,31 Because of these assets, even water-soluble organic electroactive materials have been developed for aqueous RFBs.32–36Despite the attractive features of nonaqueous RFBs, large technical hurdles still exist. The first one is the low concentrations of redox materials demonstrated in these systems, typically near 0.1 M translating to energy densities no higher than 5 Wh L−1. New redox materials with high solubility must be identified to develop high-energy RFB systems. Second, electrolyte viscosity and ionic resistance increase rapidly as the redox material concentration increases in nonaqueous electrolytes, which substantially deteriorates the rate performance of nonaqueous RFBs. Overcoming these limitations requires improvement in flow cell design and development of high-performance membranes to allow for high concentration cell cycling.37
Another aspect that seems to be under-addressed is quantitative diagnostics of flow battery status such as state of charge (SOC). Real-time control and monitoring are required to maintain safe RFB operation and deliver reliable service. Accurate determination of SOC is essential to detect potential risks such as overcharge, gas evolution, electrolyte imbalance, material decomposition, etc., before reaching threatening levels. For example, the vanadium flow battery typically operates within a SOC range of <80%, beyond which gas evolution and V2O5 precipitation may occur and jeopardize the overall system.38 In addition, to decrease total costs, the optimum SOC range may vary according to the energy to power (E/P) ratio required for specific applications.39 SOC diagnostic methods should be reliable, robust, fast, low-cost, and facile for online integration. However, there are very few reports to this end,40–43 especially in nonaqueous flow batteries.25 Spectrophotoscopic methods are suitable candidate techniques, such as ultraviolet-visible (UV-vis) spectroscopy that was attempted in aqueous all-vanadium RFBs to monitor SOC.44–46
To address some of the limitations of nonaqueous RFBs, we report a new redox active material, 2-phenyl-4,4,5,5-tetramethylimidazoline-1-oxyl-3-oxide (PTIO), for use in a symmetric nonaqueous RFB. PTIO is a nitronyl nitroxide radical and has high solubility; for example, we measured a solubility of 2.6 M in acetonitrile (MeCN) as shown in Fig. S1 in the ESI.† Nitronyl nitroxide-containing compounds and polymers have been investigated in a variety of new applications such as batteries, memory devices, and molecular magnets.47–50 As shown in Scheme 1, PTIO undergoes electrochemically reversible disproportionation reactions and exhibits two reversible redox pairs that are decently separated in redox potentials. Thus, PTIO can be used as an ambipolar redox material in a symmetric flow battery.51 When charged, PTIO is converted to the aminoxyl anion (PTIO−) at the anolyte side and to the oxoammonium cation (PTIO+) at the catholyte side. Cyclic voltammetry (CV) and flow cell tests were carried out to evaluate the electrochemical performance of the PTIO flow chemistry. Moreover, we demonstrate that Fourier transform infrared spectroscopy (FTIR) can effectively monitor the SOC, which is cross-validated with electron spin resonance (ESR) microscopy.
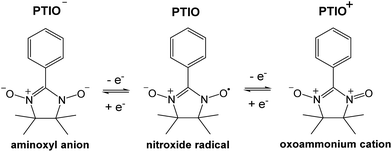 | ||
| Scheme 1 The electrochemical reactions of the PTIO-based symmetric flow chemistry. Active sites for both reactions are at the N–O bond. | ||
Experimental section
Materials
All chemicals were used as received without further purification. PTIO (>98.0%) was purchased from TCI America. Tetrabutylammonium hexafluorophosphate (TBAPF6, electrochemical grade) was purchased from Sigma-Aldrich. Battery grade MeCN was purchased from BASF (Cleveland, OH).CV tests
Preparation of electrolyte samples, CV tests and flow cell tests were performed in an argon-filled MBraun® glove box (Stratham, NH, USA) with both H2O and O2 levels below 1 ppm. A 3-electrode configuration was set up with a glassy carbon working electrode, a graphite felt (GFD, SGL Group, Germany) strip counter electrode and an Ag/AgNO3 reference electrode. The CV tests were performed at various potential sweep rates at room temperature.Flow cell tests
The flow cell was assembled with two graphite felt electrodes sandwiching a Daramic® (a registered trademark of Daramic LLC) porous separator (Owensboro KY). The separator had a median pore size of 0.15 μm and a porosity of 57%.52 The active area of the flow cell was 10 cm2. An electrolyte solution (4 mL) containing 0.1 M or 0.5 M PTIO in 1.0 M TBAPF6/MeCN was added to each reservoir and was circulated through the cell by a Masterflex® L/S® peristaltic pump (Cole-Parmer, Vernon Hills, IL) at a flow rate of 20 mL min−1. Galvanostatic charge/discharge cycling was performed with constant current mode using a LAND® battery tester (LanHe instruments, China).FTIR measurements
The electrolyte sample was added to a sealed FTIR cell with KBr windows and a path length of 0.2 mm in the Ar-filled glove box. A SampleSaver™ storage container was used when the sample was transported outside the glove box. The FTIR cell was mounted to a Bruker VERTEX 70 spectrometer and the spectrum was collected at room temperature. For the calibration curve, samples containing 0.05 M, 0.1 M, 0.15 M, 0.2 M, 0.25 M, 0.3 M, 0.35 M, 0.4 M, 0.45 M and 0.5 M PTIO in the same 1.0 M TBAPF6/MeCN supporting electrolyte were used.A flow cell using an electrolyte of 0.5 M PTIO in 1.0 M TBAPF6 (11 mL) in each reservoir was galvanostatically charged at 10 mA cm−2. At time intervals of 0, 18, 36, 54, and 72 minutes, small sample aliquots (0.2 mL) were taken out from both reservoirs and were subjected to both FTIR and ESR measurements at room temperature. The samples were denoted as sample #0, #1, #2, #3, and #4, respectively.
ESR tests
A small amount (∼10 μL) of each sample aliquot was sealed in a PTFE tubing (1/16′′ OD and 1/32′′ ID) with CRITOSEAL at both ends, which was then double sealed in a quartz ESR tube (4 mm diameter) to avoid exposure to air. The ESR measurements were performed on a Bruker Elexsys 580 spectrometer fitted with an SHQE resonator with microwave frequency ∼9.85 GHz (X band). The concentration of unreacted PTIO in each sample was obtained from the integral of its ESR spectrum. The original 0.5 M PTIO in 1.0 M TBAPF6 solution was used to calibrate the PTIO concentration.Results and discussion
Electrochemical performance of PTIO
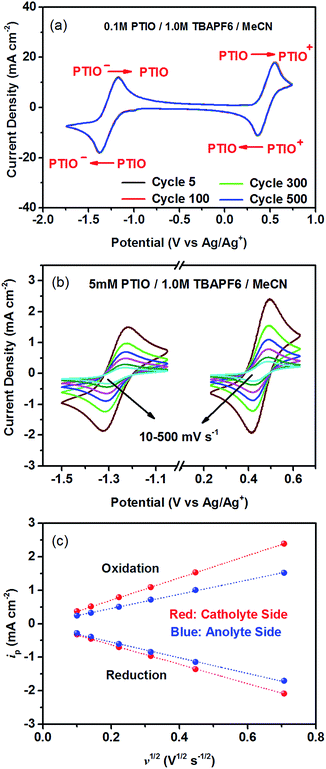
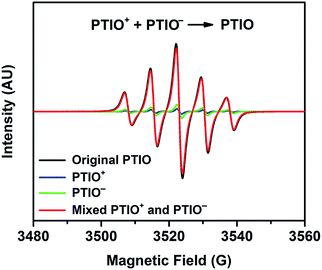
To identify redox states and determine the redox potentials of PTIO, CV was performed in a three-electrode configuration. The supporting electrolyte was 1.0 M TBAPF6 in MeCN. Fig. 1a plots repeated CV scans over 500 cycles at a potential sweep rate of 100 mV s−1. The CV curves display two pairs of well-defined, reversible redox peaks, corresponding to the two electrochemical reactions shown in Scheme 1. The respective half-wave potentials of these two redox couples, calculated by averaging the oxidation and reduction peaks of each couple, are determined to be −1.27 V and 0.46 V, both versus Ag/Ag+. These values yield a theoretical cell voltage of 1.73 V for this PTIO flow battery chemistry. More importantly, the CV curves of these 500 cycles almost completely overlap with each other (see Fig. S2 in the ESI for expanded view†). This result demonstrates the high stability of the two redox couples of PTIO under CV scan conditions. Fig. 1b plots the CV curves of both PTIO electrochemical reactions at various potential sweeping rates (ν) ranging from 10–500 mV s−1, and Fig. 1c shows the derived linear relationship between the peak current (ip) and the square root of sweeping rate (ν1/2). According to the Randles–Sevcik equation, a diffusion coefficient of ∼6.2 × 10⁻⁶ cm2 s−1 was obtained from the linear ip–ν1/2 relationship.The PTIO-based symmetric RFB design has attractive operational benefits.51 First, the crossover of charged PTIO species (PTIO+ or PTIO−) does not result in disparate chemicals and irreversible side reactions. Both electrochemical reactions of PTIO occur at the same N–O bond and the reaction between PTIO+ and PTIO− regenerates the original PTIO. This argument is confirmed with ESR thanks to the unpaired electron in PTIO. As shown in Fig. 2, mixing the PTIO+ and PTIO− samples caused almost complete recovery of the ESR signal of the original PTIO, demonstrating negligible side reactions. During flow cell operation, the crossover species (PTIO+ or PTIO−) will react with the host species (PTIO− or PTIO+) to convert back to PTIO, which leads to minimal irreversible crossover. The second benefit is the high effective concentrations of redox materials that can reach as high as their nominal solubilities in supporting electrolytes. In contrast, RFBs that pair two different redox substances usually use mixed-reactant electrolytes to reduce crossover, which however greatly sacrifices the effective redox concentrations demonstrated in flow cells.16,53,54
The cycling performance of the PTIO flow chemistry was evaluated galvanostatically in flow cells that used a Daramic® porous separator. The separator enabled relatively high cell conductivity because of its large pore size. Fig. 3 displays the cell efficiencies and capacities at the PTIO concentrations ([PTIO]) of 0.1 M for 35 cycles and 0.5 M for 15 cycles, respectively. The voltage curves are shown in Fig. S3a and b in the ESI.† Longer cycling performance (100 cycles) is shown in Fig. S3c.† The PTIO flow cells obtained an area-specific resistivity (ASR) of 18.3 Ω cm2 at 0.1 M PTIO and 21.2 Ω cm2 at 0.5 M PTIO. The flow cells at both PTIO concentrations were able to operate at a high cycling current density of 20 mA cm−2 compared with other nonaqueous RFB reports. At 0.1 M PTIO, the flow cell achieved an average CE of ∼96% and VE of 75%, yielding an EE of ∼72%. At 0.5 M, the cell efficiencies were generally lower, with CE of ∼90%, VE of 67%, and EE of 60%. The flow cell with 0.5 M PTIO demonstrated an initial energy density of 9 Wh L−1 during charge and of 5 Wh L−1 during discharge, which correspond to 77% and 43% of the theoretical value (11.6 Wh L−1), respectively. The CE decreased at 0.5 M PTIO because of increased crossover during longer charge/discharge times. The increase in electrolyte viscosity at higher PTIO concentration led to lower ionic conductivity and greater transport loss, which caused the increase in ASR and decrease in VE. Nevertheless, such redox material concentrations, rate performance, and cell efficiencies demonstrated in the PTIO flow cells are significantly higher than those in other reported nonaqueous RFBs which operated typically near 0.1 M concentrations, with current densities less than 0.5 mA cm−2, and/or EEs no higher than 60%.13,17,55,56
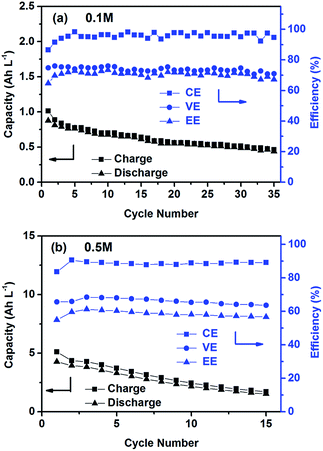 | ||
| Fig. 3 Cycling efficiencies and capacities of the PTIO flow cells using a supporting electrolyte of 1.0 M TBAPF6/MeCN at a current density of 20 mA cm−2: (a) 0.1 M PTIO; and (b) 0.5 M PTIO. | ||
As shown in Fig. 3, the PTIO flow cells exhibited continuous capacity loss during cycling. Understanding the capacity decay mechanism would be a key first step towards improving capacity retention. The exact mechanism is still under investigation, but is speculated to be closely associated with either electrolyte imbalance,57,58 or chemical instability of charged species,16,59 or both. Further study will confirm which factors dominate. If the former is the dominant factor, electrolyte remixing maintenance or hydraulic pressure regulation across the porous separator can be carried out to recover the capacity, similar to the strategy adopted in separator-based vanadium flow batteries.60–62 But if the latter is the dominant factor, molecular engineering and electrolyte optimization become necessary to improve the chemical stability of the charged redox species, as demonstrated in other systems.16,63 In addition, this result suggests that the CV performance does not always predict the flow cell performance because of the significantly different features in flow cells such as porous electrodes, flowing electrolytes, longer time scale, larger amount of electroactive materials involved, crossover transport of charge carriers and redox materials, etc.
It is noteworthy that the tested PTIO concentrations have not yet reached the solubility limit (∼2.6 M) in the flow cell. Cell demonstration at PTIO concentrations higher than 0.5 M is quite challenging. First, the redox material crossover across the porous separator would lead to low CE at high PTIO concentrations. Second, the high electrolyte viscosity and resistance would result in low VE. These two drawbacks are the major limiting factors for cycling the PTIO flow cell at >0.5 M concentrations. Solving these limitations to fully demonstrate the promise of this new PTIO battery chemistry indeed relies on development of high-performance membranes,64,65 enhancement of rheological and electrical properties of high concentration electrolytes,66,67 and improvement of cell designs.68 These are among the most urgent research needs for nonaqueous flow batteries.
SOC diagnostics using FTIR
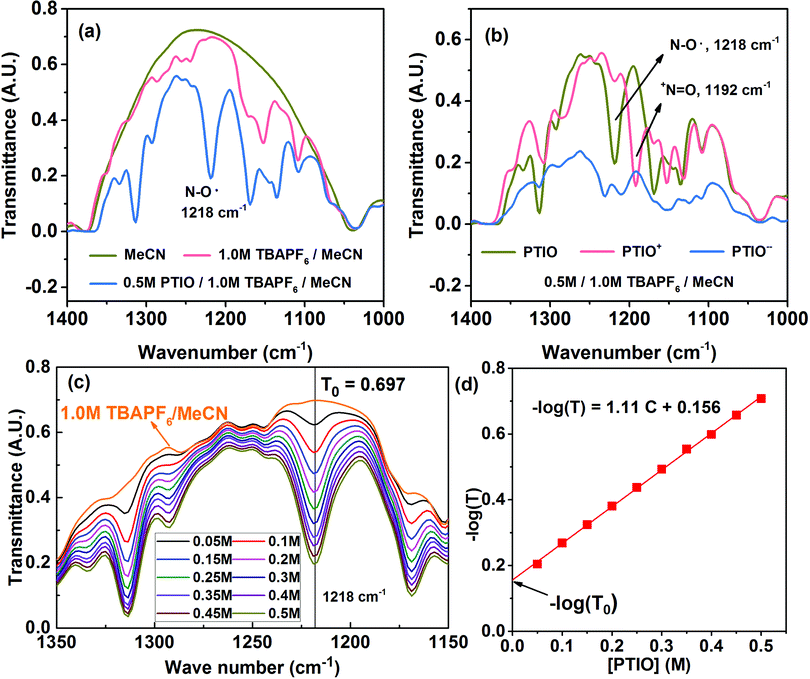
Many spectroscopic techniques can offer structural information for redox molecules because of their characteristic interactions with functional groups present in these redox molecules. There are several critical requirements for a suitable SOC diagnostic tool. First, the technique should differentiate among the PTIO, the solvent (MeCN), and the salt (TBAPF6). Second, the technique should distinguish among the three redox states of PTIO. Third, the technique must display spectral features that can be quantitatively related to the PTIO concentration. Fourth, during charge/discharge, the TBAPF6 salt concentration continuously swings at both sides of the flow cell because of transfer of the TBA+ and PF6− ions for charge balance, but such changes must not generate interfering, non-negligible spectral fluctuations at the spectral positions of interest. We successfully demonstrate that FTIR could fulfill these requirements and therefore was chosen for this study. ESR was used as a secondary diagnostic method to cross-validate the results obtained from FTIR.Fig. S4a† and 4a show the full-range and expanded view (1400–1000 cm−1) of the FTIR spectra of the PTIO electrolyte systems: the MeCN solvent, 1.0 M TBAPF6/MeCN, and 0.5 M PTIO in 1.0 M TBAPF6/MeCN, respectively. Only in expanded wavelength range did PTIO exhibit characteristic transmittance peaks, i.e., 1314 cm−1 and 1218 cm−1, that could be completely isolated from the background peaks of 1.0 M TBAPF6/MeCN. These two peaks belong to PTIO according to the Spectral Database for Organic Compounds (SDBS) of National Institute of Advanced Industrial Science and Technology (AIST, Japan).69 The other two peaks at 1169 cm−1 and 1135 cm−1 also belong to PTIO, but are overlapped with peaks associated with TBAPF6 at 1171 cm−1 and 1152 cm−1. When charged in a flow cell, the catholyte side contained the PTIO+ and unreacted PTIO while the anolyte side contained the PTIO− and unreacted PTIO. To determine whether FTIR can distinguish the three PTIO species, solutions of 0.5 M PTIO+ and PTIO− in the same 1.0 M TBAPF6/MeCN electrolyte were electrochemically prepared in a flow cell and then were subjected to FTIR analysis. Fig. S4b† and 4b show the full range and expanded view of their FTIR spectra. Due to an inability to charge the cell completely to 100%, a small amount of residual PTIO remained unreacted in both the anolyte and catholyte. Note that, when PTIO was converted to PTIO+, the peak at 1218 cm−1 almost disappeared and a completely new peak emerged at 1192 cm−1. Considering the structural change from PTIO to PTIO+ in Scheme 1, the peak at 1218 cm−1 could probably be assigned to the N–O˙ bond and the new peak at 1192 cm−1 to the +N![[double bond, length as m-dash]](https://www.rsc.org/images/entities/char_e001.gif) O bond. The peak at 1314 cm−1 also considerably reduced its intensity, but its identity is difficult to assign. On the other hand, when PTIO was converted to PTIO−, the transmittance became lower as a whole in the range of 1400–1000 cm−1 and most peaks became indistinguishable. But a completely new peak appeared at 2126 cm−1, presumably associated with the N–O− bond (Fig. S4b†).
O bond. The peak at 1314 cm−1 also considerably reduced its intensity, but its identity is difficult to assign. On the other hand, when PTIO was converted to PTIO−, the transmittance became lower as a whole in the range of 1400–1000 cm−1 and most peaks became indistinguishable. But a completely new peak appeared at 2126 cm−1, presumably associated with the N–O− bond (Fig. S4b†).
For a flow cell employing an electrolyte of 0.5 M PTIO in 1.0 M TBAPF6/MeCN, the [PTIO] swings maximally between 0–0.5 M at both the anolyte and catholyte sides during cell charge/discharge. In the meanwhile, the concentration of the TBAPF6 salt also varies approximately between 0.5–1.0 M. To determine how much the change of the TBAPF6 concentration affects the FTIR background, the FTIR spectra of the supporting electrolytes containing 0.5 M and 1.0 M TBAPF6 in MeCN are shown in Fig. S5 in the ESI.† At the four spectral positions of interest, i.e. 1218 (PTIO), 1314 (PTIO), 1192 (PTIO+) and 2126 (PTIO−) cm−1, the TBAPF6 exhibited a negligible drop (<2.5%) in its transmittance when its concentration changed from 0.5 M to 1.0 M. Thus, the spectrum of 1.0 M TBAPF6/MeCN was used as a universal background in ensuing SOC determination. Moreover, Fig. 4c displays the FTIR spectra of a series of PTIO electrolytes with the [PTIO] ranging from 0.05 M to 0.5 M in 0.05 M increments in 1.0 M TBAPF6/MeCN. Clearly, the intensities of both 1314 and 1218 cm−1 peaks are directly correlated with the [PTIO].
By now, we have demonstrated that FTIR satisfies the above-stated requirements for a suitable SOC diagnostic technique. FTIR distinguishes among PTIO's three redox states, has negligible interference from the supporting electrolyte, and displays [PTIO] dependence. We used the 1218 cm−1 peak for SOC determination because of its well-defined peak margins and belonging to the original PTIO. According to the Beer–Lambert law, the logarithm of the FTIR transmittance (T) is proportional to the [PTIO]. Shown in Fig. 4d, a linear −log(T) vs. [PTIO] calibration curve was achieved through fitting the transmittance data obtained in Fig. 3c, which follows eqn (1):
| −log(T) = 1.11[PTIO] + 0.156 | (1) |
Based on the equation derivation in Scheme S1 in the ESI,† the Y-axis intercept (0.156) reflects the background transmittance (T0) at the position of 1218 cm−1: −log(T0) = 0.156. Thus, T0 was calculated as 0.698 from the calibration curve, in near-perfect agreement with the value recorded on the FTIR spectrum (0.697). This indicates the high reliability of this calibration curve.
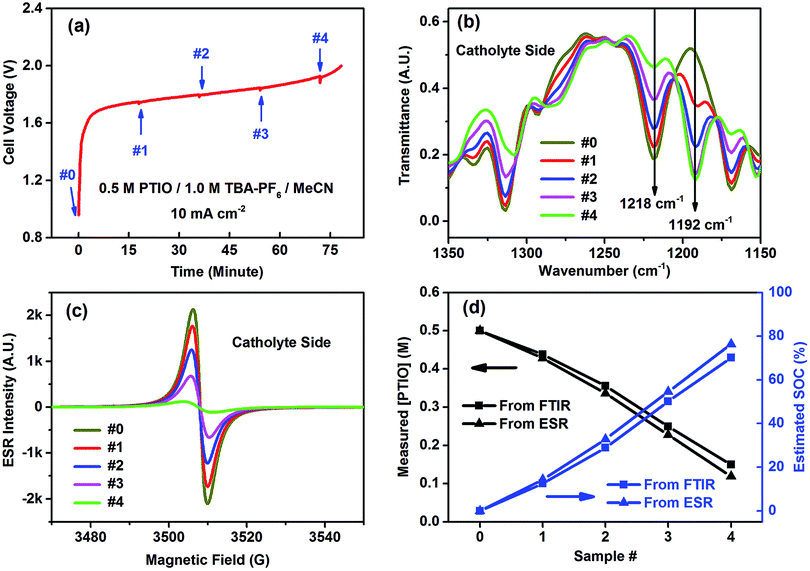
The catholyte side was selected to demonstrate FTIR in determining the flow cell's SOC because of the conspicuous spectral change at the N–O˙ bond (1218 cm−1). The flow cell using an initial electrolyte solution of 0.5 M PTIO in 1.0 M TBAPF6/MeCN was galvanostatically charged at 10 mA cm−2. Small aliquots of the electrolytes were extracted from both the catholyte and anolyte sides to maintain electrolyte balance at a time interval of ∼18 minutes, which corresponded to a capacity of ∼15 mA h, as indicated by the small bumps on the voltage curve in Fig. 5a. The samples, labeled as #0–4, were analyzed by both FTIR and ESR (Fig. 5b and c). (The FTIR spectra of the samples from the anolyte side are shown in Fig. S6.†) As the charging proceeded, PTIO was gradually converted to PTIO+ at the catholyte side, with the ESR-active N–O˙ radical transformed to the ESR-inactive +N![[double bond, length as m-dash]](https://www.rsc.org/images/entities/char_e001.gif) O cation. Accordingly, the FTIR peaks at 1314, 1218 and 1168 cm−1 gradually decreased while the 1192 cm−1 peak intensity increased, in good agreement with the projection shown in Fig. 4b. In the meanwhile, the ESR peak intensity decreased from sample #0 to #4 as the remaining [PTIO] decreased during the charging process. The FTIR transmittance at 1218 cm−1 of each sample was collected, from which each [PTIO] was calculated from the calibration curve. Using the original 0.5 M PTIO as the baseline, ESR was employed to measure the [PTIO] in these samples by the integrals of their ESR spectra.
O cation. Accordingly, the FTIR peaks at 1314, 1218 and 1168 cm−1 gradually decreased while the 1192 cm−1 peak intensity increased, in good agreement with the projection shown in Fig. 4b. In the meanwhile, the ESR peak intensity decreased from sample #0 to #4 as the remaining [PTIO] decreased during the charging process. The FTIR transmittance at 1218 cm−1 of each sample was collected, from which each [PTIO] was calculated from the calibration curve. Using the original 0.5 M PTIO as the baseline, ESR was employed to measure the [PTIO] in these samples by the integrals of their ESR spectra.
The SOC of the 0.5 M PTIO flow cell is defined as the percentage of the concentration of converted PTIO (i.e., [PTIO+]) to the concentration of overall PTIO species ([PTIO] + [PTIO+] = the very original PTIO concentration, i.e. 0.5 M). After the [PTIO] in each sample was determined through FTIR or ESR, the SOC was then calculated according to eqn (2):
 | (2) |
Fig. 5d shows the respective [PTIO] determined from FTIR and ESR and the calculated SOC of these samples. Based on FTIR, the [PTIO] in the #0–4 samples were 0.50 M, 0.44 M, 0.36 M, 0.25 M, and 0.15 M, corresponding to SOCs of 0%, 12%, 29%, 50%, and 70%, respectively. The results obtained from ESR closely agreed, albeit with slightly lower [PTIO] and higher SOC. The agreement between FTIR and ESR demonstrates the high feasibility of using either technique to non-invasively detect the SOC of the PTIO flow cell.
The results from the FTIR-based ex situ SOC diagnostics are encouraging, which can guide ensuing efforts of in situ and in operando studies in flow batteries, especially in scale-up battery stacks. FTIR has a number of attractive advantages such as ready accessibility, fast response, low cost, small space requirement, and being highly facile for online incorporation. In these regards, FTIR greatly exceeds ESR. Because of the ability to correlate structural information of organic redox materials, FTIR can be potentially applied to investigate the molecular evolution during flow battery operation and offer state of health information, which is a significant advantage over other spectrophotoscopic methods such as UV-vis. Fig. 6 shows the schematic of a proposed flow battery device equipped with online FTIR-based SOC sensors. FTIR cells with inlet and outlet ports to allow electrolyte flows can be installed on the flow pipelines. The flow battery and the FTIR measurement are operated independently. The FTIR data will be collected at times of need and sent to a computer-based spectral analyzer. Such a setup allows real-time monitoring of the flow battery SOCs to ensure that operations are stringently within a safe SOC range.
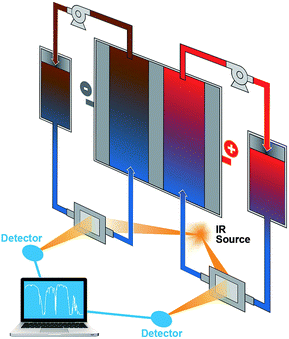 | ||
| Fig. 6 A schematic of the proposed flow battery device incorporated with online FTIR monitoring sensors. | ||
Conclusions
We have shown that the organic PTIO compound exhibits reversible electrochemical disproportionation reactions and can be used as both anolyte and catholyte materials in a nonaqueous symmetric flow battery. Utilization of the ambipolar PTIO is expected to eliminate irreversible crossover. The high solubility of PTIO will increase the effective electroactive material concentration in flow cells. Also, the PTIO flow battery features a moderate cell voltage of 1.73 V and good cyclability under both CV and flow cell conditions. In addition, we demonstrate that FTIR can measure the PTIO concentration and subsequently the SOC of the PTIO cell, which suggests FTIR as a viable yet underexplored tool for SOC determination. This technique could be applied as an online SOC sensor to ensure safe operation for RFBs using IR-active organic redox materials.The demonstrated cycling stability and energy density of this PTIO flow battery should be further improved for practical scale-up applications. Such improvements are highly dependent on the developmental progress in battery component materials and designs. For nonaqueous redox flow batteries, possible solutions include structural tuning of current and new electroactive materials to increase solubility and stability, rational engineering of electrolytes to reduce viscosity and ionic resistivity, development of ion-selective and low-resistance membranes, and optimization of flow cell architecture to increase efficiency and utilization.
It should be noted that the suitability of a particular diagnostic technique is highly dependent on the molecular structures of the organic redox materials. The N–O˙ bond in PTIO has a unique response upon IR light irradiation. Functional groups in other organics may respond better to different analytical techniques. The evaluation criteria similar to those stated in this work must be satisfied for a suitable SOC monitoring technique. With more flow battery demonstration systems installed nowadays,70 we hope our work in SOC diagnostics can trigger more attention to the area of safety and reliability, especially during long-term operations, in the flow battery community.
Acknowledgements
The flow chemistry development, electrochemistry study, and FTIR measurement in this research were financially supported by the Joint Center for Energy Storage Research (JCESR), an Energy Innovation Hub funded by the U.S. Department of Energy, Office of Science, Basic Energy Sciences. ESR measurement was supported by the William R. Wiley Environmental Molecular Sciences Laboratory (EMSL), a national scientific user facility sponsored by DOE's Office of Biological and Environmental Research, under Proposal # 48374 and 48293. The authors thank Dr Eric Walter for his kind help with ESR. PNNL is a multi-program national laboratory operated by Battelle for DOE under Contract DE-AC05-76RL01830.References
- B. Dunn, H. Kamath and J.-M. Tarascon, Science, 2011, 334, 928–935 CrossRef CAS PubMed.
- W. Wang, Q. Luo, B. Li, X. Wei, L. Li and Z. G. Yang, Adv. Funct. Mater., 2013, 23, 970–986 CrossRef CAS.
- Z. Yang, J. Zhang, M. C. W. Kintner-Meyer, X. Lu, D. Choi, J. P. Lemmon and J. Liu, Chem. Rev., 2011, 111, 3577–3613 CrossRef CAS PubMed.
- M. Skyllas-Kazacos, M. H. Chakrabarti, S. A. Hajimolana, F. S. Mjalli and M. Saleem, J. Electrochem. Soc., 2011, 158, R55–R79 CrossRef CAS.
- A. Weber, M. Mench, J. Meyers, P. Ross, J. Gostick and Q. Liu, J. Appl. Electrochem., 2011, 41, 1137–1164 CrossRef CAS.
- P. Leung, X. Li, C. P. de Leon, L. Berlouis, C. T. J. Low and F. C. Walsh, RSC Adv., 2012, 2, 10125–10156 RSC.
- R. M. Darling, K. G. Gallagher, J. A. Kowalski, S. Ha and F. R. Brushett, Energy Environ. Sci., 2014, 7, 3459–3477 CAS.
- K. Gong, Q. Fang, S. Gu, S. F. Y. Li and Y. Yan, Energy Environ. Sci., 2015, 8, 3515–3530 Search PubMed.
- J. Noack, N. Roznyatovskaya, T. Herr and P. Fischer, Angew. Chem., Int. Ed., 2015, 54, 9775–9808 CrossRef PubMed.
- G. L. Soloveichik, Chem. Rev., 2015, 115, 11533–11558 CrossRef CAS PubMed.
- P. J. Cappillino, H. D. Pratt, N. S. Hudak, N. C. Tomson, T. M. Anderson and M. R. Anstey, Adv. Energy Mater., 2014, 4, 1300566 Search PubMed.
- I. L. Escalante-Garcia, J. S. Wainright, L. T. Thompson and R. F. Savinell, J. Electrochem. Soc., 2015, 162, A363–A372 CrossRef CAS.
- S. Schaltin, Y. Li, N. R. Brooks, S. Jeroen, I. F. J. Vankelecom, K. Binnemans and J. Fransaer, Chem. Commun., 2016, 52, 414–417 RSC.
- H. D. Pratt, N. S. Hudak, X. Fang and T. M. Anderson, J. Power Sources, 2013, 236, 259–264 CrossRef CAS.
- F. R. Brushett, J. T. Vaughey and A. N. Jansen, Adv. Energy Mater., 2012, 2, 1390–1396 CrossRef CAS.
- X. Wei, W. Xu, J. Huang, L. Zhang, E. Walter, C. Lawrence, M. Vijayakumar, W. A. Henderson, T. Liu, L. Cosimbescu, B. Li, V. Sprenkle and W. Wang, Angew. Chem., Int. Ed., 2015, 54, 8684–8687 CrossRef CAS PubMed.
- Z. Li, S. Li, S. Q. Liu, K. Huang, D. Fang, F. Wang and S. Peng, J. Solid State Electrochem., 2011, 14, A171–A173 CrossRef CAS.
- J. Huang, L. Cheng, R. S. Assary, P. Wang, Z. Xue, A. K. Burrell, L. A. Curtiss and L. Zhang, Adv. Energy Mater., 2014, 5 DOI:10.1002/aenm.201401782.
- M. Duduta, B. Ho, V. C. Wood, P. Limthongkul, V. E. Brunini, W. C. Carter and Y. M. Chiang, Adv. Energy Mater., 2011, 1, 511–516 CrossRef CAS.
- F. Y. Fan, W. H. Woodford, Z. Li, N. Baram, K. C. Smith, A. Helal, G. H. McKinley, W. C. Carter and Y. M. Chiang, Nano Lett., 2014, 14, 2210–2218 CrossRef CAS PubMed.
- G. Nagarjuna, J. S. Hui, K. J. Cheng, T. Lichtenstein, M. Shen, J. S. Moore and J. Rodriguez-Lopez, J. Am. Chem. Soc., 2014, 136, 16309–16316 CrossRef CAS PubMed.
- Y. Zhao, Y. Ding, Y. Li, L. Peng, H. R. Byon, J. B. Goodenough and G. Yu, Chem. Soc. Rev., 2015, 44, 7968–7996 RSC.
- Y. Yang, G. Zheng and Y. Cui, Energy Environ. Sci., 2013, 6, 1552–1558 CAS.
- H. Pan, X. Wei, W. A. Henderson, Y. Shao, J. Chen, P. Bhattacharya, J. Xiao and J. Liu, Adv. Energy Mater., 2015, 5, 1500113 Search PubMed.
- X. Wei, W. Xu, M. Vijayakumar, L. Cosimbescu, L. Tianbiao, V. Sprenkle and W. Wang, Adv. Mater., 2014, 26, 7649–7653 CrossRef CAS PubMed.
- X. Wei, L. Cosimbescu, W. Xu, J. Z. Hu, M. Vijayakumar, J. Feng, M. Y. Hu, X. Deng, J. Xiao, J. Liu, V. Sprenkle and W. Wang, Adv. Energy Mater., 2015, 5, 1400678 Search PubMed.
- W. Wang, W. Xu, L. Cosimbescu, D. Choi, L. Li and Z. Yang, Chem. Commun., 2012, 48, 6669–6671 RSC.
- L. Cosimbescu, X. Wei, M. Vijayakumar, W. Xu, M. L. Helm, S. D. Burton, C. M. Sorensen, J. Liu, V. Sprenkle and W. Wang, Sci. Rep., 2015, 5, 14117 CrossRef CAS PubMed.
- Y. Zhao, Y. Ding, J. Song, G. Li, G. Dong, J. B. Goodenough and G. Yu, Angew. Chem., Int. Ed., 2014, 53, 11036–11040 CrossRef CAS PubMed.
- Z. Song and H. Zhou, Energy. Environ. Sci., 2013, 6, 2280–2301 CAS.
- Y. Liang, Z. Tao and J. Chen, Adv. Energy Mater., 2012, 2, 742–769 CrossRef CAS.
- B. Huskinson, M. P. Marshak, C. Suh, S. Er, M. R. Gerhardt, C. J. Galvin, X. Chen, A. Aspuru-Guzik, R. G. Gordon and M. J. Aziz, Nature, 2014, 505, 195–198 CrossRef CAS PubMed.
- T. Liu, X. Wei, Z. Nie, V. Sprenkle and W. Wang, Adv. Energy Mater., 2016, 6 DOI:10.1002/aenm.201501449.
- B. Yang, L. Hoober-Burkhardt, F. Wang, G. K. S. Prakash and S. R. Narayanan, J. Electrochem. Soc., 2014, 161, A1371–A1380 CrossRef CAS.
- T. Janoschka, N. Martin, U. Martin, C. Friebe, S. Morgenstern, H. Hiller, M. D. Hager and U. S. Schubert, Nature, 2015, 527, 78–81 CrossRef CAS PubMed.
- K. Lin, Q. Chen, M. R. Gerhardt, L. Tong, S. B. Kim, L. Eisenach, A. W. Valle, D. Hardee, R. G. Gordon, M. J. Aziz and M. P. Marshak, Science, 2015, 349, 1529–1532 CrossRef CAS PubMed.
- R. Darling, K. Gallagher, W. Xie, L. Su and F. Brushett, J. Electrochem. Soc., 2016, 163, A5029–A5040 CrossRef CAS.
- C. Ding, H. M. Zhang, X. Li, T. Liu and F. Xing, J. Phys. Chem. Lett., 2013, 4, 1281–1294 CrossRef CAS PubMed.
- V. Viswanathan, A. Crawford, D. Stephenson, S. Kim, W. Wang, B. Li, G. Coffey, E. Thomsen, G. Graff, P. Balducci, M. Kintner-Meyer and V. Sprenkle, J. Power Sources, 2014, 247, 1040–1051 CrossRef CAS.
- B. Xiong, J. Zhao, Z. Wei and M. Skyllas-Kazacos, J. Power Sources, 2014, 262, 50–61 CrossRef CAS.
- C. Jia, Q. Liu, C. Sun, F. Yang, Y. Ren, S. M. Heald, Y. Liu, Z. Li, W. Lu and J. Xie, ACS Appl. Mater. Interfaces, 2014, 6, 17920–17925 CAS.
- K. Ngamsai and A. Arpornwichanop, J. Power Sources, 2015, 298, 150–157 CrossRef CAS.
- W. Zhang, L. Liu and L. Liu, RSC Adv., 2015, 5, 100235–100243 RSC.
- M. Skyllas-Kazacos and M. Kazacos, J. Power Sources, 2011, 196, 8822–8827 CrossRef CAS.
- R. P. Brooker, C. J. Bell, L. J. Bonville, H. R. Kunz and J. M. Fenton, J. Electrochem. Soc., 2015, 162, A608–A613 CrossRef CAS.
- C. Petchsingh, N. Quill, J. T. Joyce, D. N. Eidhin, D. Oboroceanu, C. Lenihan, X. Gao, R. P. Lynch and D. N. Buckley, J. Electrochem. Soc., 2016, 163, A5068–A5083 CrossRef CAS.
- T. Suga, S. Sugita, H. Ohshiro, K. Oyaizu and H. Nishide, Adv. Mater., 2011, 23, 751–754 CrossRef CAS PubMed.
- J. Lee, E. Lee, S. Kim, G. S. Bang, D. A. Shultz, R. D. Schmidt, M. D. E. Forbes and H. Lee, Angew. Chem., Int. Ed., 2011, 50, 4414–4418 CrossRef CAS PubMed.
- T. Akita and K. Kobayashi, Adv. Mater., 1997, 9, 346–349 CrossRef CAS.
- Q. Huang, D. W. Choi, L. Cosimbescu and J. P. Lemmon, Phys. Chem. Chem. Phys., 2013, 15, 20921–20928 RSC.
- R. A. Potash, J. R. McKone, S. Conte and H. D. Abruña, J. Electrochem. Soc., 2016, 163, A338–A344 CrossRef CAS.
- X. Wei, L. Li, Q. Luo, Z. Nie, W. Wang, B. Li, G. Xia, E. Miller, J. Chambers and Z. G. Yang, J. Power Sources, 2012, 218, 39–45 CrossRef CAS.
- M. Lopezatalaya, G. Codina, J. R. Perez, J. L. Vazquez and A. Aldaz, J. Power Sources, 1992, 39, 147–154 CrossRef CAS.
- W. Wang, Z. Nie, B. Chen, F. Chen, Q. Luo, X. Wei, G. Xia, M. Skyllas-Kazacos, L. Li and Z. G. Yang, Adv. Energy Mater., 2012, 2, 487–493 CrossRef CAS.
- H. S. Kim, T. Yoon, J. Jang, J. Mun, H. Park, J. H. Ryu and S. M. Oh, J. Power Sources, 2015, 283, 300–304 CrossRef CAS.
- A. A. Shinkle, A. E. S. Sleightholme, L. D. Griffith, L. T. Thompson and C. W. Monroe, J. Power Sources, 2012, 206, 490–496 CrossRef CAS.
- Q. Luo, L. Li, Z. Nie, W. Wang, X. Wei, B. Li, B. Chen and Z. G. Yang, J. Power Sources, 2012, 218, 15–20 CrossRef CAS.
- Q. Luo, L. Li, W. Wang, Z. Nie, X. Wei, B. Li, B. Chen, Z. G. Yang and V. Sprenkle, ChemSusChem, 2013, 6, 268–274 CrossRef CAS PubMed.
- J. Huang, L. Su, J. A. Kowalski, J. L. Barton, M. Ferrandon, A. K. Burrell, F. R. Brushett and L. Zhang, J. Mater. Chem. A, 2015, 3, 14971–14976 CAS.
- X. Wei, B. Li and W. Wang, Polym. Rev., 2015, 55, 247–272 CrossRef CAS.
- B. Li, Q. Luo, X. Wei, Z. Nie, E. Thomsen, B. Chen, V. Sprenkle and W. Wang, ChemSusChem, 2014, 7, 577–584 CrossRef CAS PubMed.
- X. Wei, Z. Nie, Q. Luo, B. Li, B. Chen, K. Simmons, V. Sprenkle and W. Wang, Adv. Energy Mater., 2013, 3, 1215–1220 CrossRef CAS.
- C. S. Sevov, R. E. M. Brooner, E. Chénard, R. S. Assary, J. S. Moore, J. Rodríguez-López and M. S. Sanford, J. Am. Chem. Soc., 2015, 137, 14465–14472 CrossRef CAS PubMed.
- C. Jia, F. Pan, Y. Zhu, Q. Huang, L. Lu and Q. Wang, Sci. Adv., 2015, 1, e1500886 Search PubMed.
- C. Li, A. L. Ward, S. E. Doris, T. A. Pascal, D. Prendergast and B. A. Helms, Nano Lett., 2015, 15, 5724–5729 CrossRef CAS PubMed.
- L. Madec, M. Youssry, M. Cerbelaud, P. Soudan, D. Guyomard and B. Lestriez, ChemPlusChem, 2015, 80, 396–401 CrossRef CAS.
- L. F. Arenas, F. C. Walsh and C. P. de Leon, J. Electrochem. Soc., 2016, 163, A5170–A5179 CrossRef CAS.
- J. Houser, J. Clement, A. Pezeshki and M. M. Mench, J. Power Sources, 2016, 302, 369–377 CrossRef CAS.
- SDBS, http://sdbs.db.go.jp, accessed on January 7, 2016.
- DOE Global Energy Storage Database, Office of Electricity Delivery & Energy Reliability, accessed: January 31, 2016.
Footnotes |
| † Electronic supplementary information (ESI) available. See DOI: 10.1039/c6ta01177b |
| ‡ These authors contributed equally to this work. |
| This journal is © The Royal Society of Chemistry 2016 |

![[thin space (1/6-em)]](https://www.rsc.org/images/entities/char_2009.gif) :
: