
 Open Access Article
 This Open Access Article is licensed under a
 Creative Commons Attribution 3.0 Unported Licence
Oxidation behaviour of lattice oxygen in Li-rich manganese-based layered oxide studied by hard X-ray photoelectron spectroscopy†
Keiji
Shimoda
*a,
Taketoshi
Minato
a,
Koji
Nakanishi
a,
Hideyuki
Komatsu
a,
Toshiyuki
Matsunaga
a,
Hajime
Tanida
a,
Hajime
Arai
a,
Yoshio
Ukyo
a,
Yoshiharu
Uchimoto
b and
Zempachi
Ogumi
a
aOffice of Society-Academia Collaboration for Innovation, Center for Advanced Science and Innovation, Kyoto University, Gokashou, Uji, Kyoto 611-0011, Japan. E-mail: k-shimoda@saci.kyoto-u.ac.jp; Fax: +81-774-38-4996; Tel: +81-774-38-4967
bGraduate School of Human and Environment Studies, Kyoto University, Kyoto 606-8501, Japan
First published on 18th March 2016
Abstract
The oxidation/reduction behaviours of lattice oxygen and transition metals in a Li-rich manganese-based layered oxide Li[Li0.25Ni0.20Mn0.55]O1.93 are investigated by using hard X-ray photoelectron spectroscopy (HAX-PES). By making use of its deeper probing depth rather than in-house XPS analyses, we clearly confirm the formation of O− ions as bulk oxygen species in the active material. They are formed on the 1st charging process as a charge compensation mechanism for delithiation and decrease on discharging. In particular, the cation–anion dual charge compensation involving Ni and O ions is suggested during the voltage slope region of the charging process. The Ni ions in the material are considered to increase the capacity delivered by a reversible anion redox reaction with the suppression of O2 gas release. On the other hand, we found structural deterioration in the cycled material. The O− species are still observed but are electrochemically inactive during the 5th charge–discharge cycle. Also, the oxidation state of Ni ions is divalent and inactive, although that of Mn ions changes reversibly. We believe that this is associated with the structural rearrangement occurring after the activation process during the 1st charging, leading to the formation of spinel- or rocksalt-like domains over the sub-surface region of the particles.
1. Introduction
Rechargeable lithium ion batteries (LIBs) have been widely used as power sources for portable devices and now are available for applications to electric vehicles (EVs), which demand high power, high energy density, long-life, inexpensive, and safe batteries. So far, the most successful positive electrode materials have been layered transition-metal oxides such as LiCoO2 and its derivatives; however their electrochemical capacities are conventionally limited to ca. 150 mA h g−1 with a potential up to 4.2 V vs. Li/Li+.1 Lithium-rich manganese-based layered oxides (LLOs), commonly described as a composite xLi2MnO3·(1 − x)LiMO2 (M = Ni, Co, etc.), have been extensively studied as a preferred candidate material for next-generation LIB positive electrodes because they show a high reversible capacity beyond 200 mA h g−1 and consist of relatively inexpensive elements such as Mn and Ni.2–6 It is well known that LLOs show a characteristic irreversible voltage plateau at ca. 4.5 V vs. Li/Li+ in the initial charging process, which is considered to come from the activation of the nominally inactive Li2MnO3 component in the materials.3,5 Much attention has been paid to the origin of this plateau because it is the key behaviour explaining extra capacities in LLOs. The previous papers have related it to O2 gas release behaviour, which should be accompanied by structural rearrangement.7,8 The O2 release was evidenced by the gas chromatography (GC) or differential electrochemical mass spectrometry (DEMS) analyses.9–13 The oxygen loss from the material is consistent with a large irreversible capacity observed in the initial cycle, but the quantification of the released O2 is not so straightforward.9,11,14 As an alternative approach, the oxygen deficiency has been shown from X-ray diffraction data analysed by the Rietveld method.8,15,16 These studies have confirmed that the oxygen is more or less extracted from the structure. On the other hand, the first-principles calculations have suggested that the oxidation of oxygen anions without O2 release could explain the plateau profile.17,18 These theoretical studies indicate that the redox reaction of oxygen in lattice should be taken into account. Recently, we have reported evidence of peroxide formation in Li1.16Ni0.15Co0.19Mn0.50O2 at a charged state by using soft X-ray absorption spectroscopy (XAS) at the O K-edge.19 However, the detailed oxidation behaviour of the oxygen in lattice is not yet well understood during the charge–discharge process.X-ray photoelectron spectroscopy (XPS) is one of the unique techniques for obtaining chemical state information on a specific element in the battery materials. This technique is especially surface-sensitive, which usually has a probing depth of <ca. 5 nm using a conventional X-ray source (Al Kα radiation of 1.49 keV, for example), and is suitable for the chemical characterisation of the solid electrolyte interphase (SEI) comprising light elements (Li, C, O, and F) deposited on the electrode surface.20–22 Recently, Tarascon and coworkers used this technique to identify the oxidation of oxygen anions in positive electrode materials.23,24 They suggested the formation of peroxide species in Li2Ru1−yMnyO3 and Li2Ru1−ySnyO3 charged at 4.6 V from the O 1s XPS spectra with the aid of electron paramagnetic resonance (EPR) spectroscopy. More recently, Han et al. have compared the oxidation state of lattice oxygen among chemically delithiated and relithiated Li2MnO3, Li1.14Ni0.136Co0.136Mn0.544O2, LiNi0.5Co0.2Mn0.3O2, and LiCoO2 samples and suggested that the peroxide species were uniquely formed in the former two materials.25,26 However, because of its surface-sensitive nature, it is often the case that the O 1s XPS spectra were largely affected by electrolyte degradation products such as Li2CO3, which makes it difficult to validate the formation of peroxide species in the bulk. XPS measurements using synchrotron X-ray radiation are advantageous to probe the chemical state information from the deeper inside of the material (the probing depth of <ca. 50 nm),27 which enables us to focus on the lattice structure of the LIB active materials buried beneath the surface-deposited products. In this study, we have investigated the oxidation/reduction behaviours of lattice oxygen and transition metals in a lithium-rich manganese-based layered oxide Li[Li0.25Ni0.20Mn0.55]O1.93 during the irreversible initial charge–discharge cycle by using hard X-ray photoelectron spectroscopy (HAX-PES). A possible structural modification occurring during the charge–discharge cycles has also been examined for the material disassembled on the 5th cycle.
2. Experimental
Li[Li0.25Ni0.20Mn0.55]O1.93 was synthesised by a solid-state reaction at 900 °C for 12 h with the starting materials LiOH·H2O, Ni2CO3 (Wako Pure Chemical Industries), and MnCO3 (Kojundo Chemical Laboratory). Li2MnO3 (Li[Li0.33Mn0.67]O2) was also prepared at 900 °C by the same procedure as a reference material. From the scanning electron microscopic observation, the average particle size of Li[Li0.25Ni0.20Mn0.55]O1.93 was estimated to be ca. 5 μm, which consisted of small crystallites of ca. 200 nm in diameter. The chemical composition Li[Li0.25Ni0.20Mn0.55]O1.93 was determined from the inductively coupled plasma-atomic emission spectrometry (ICP-AES, ICPS-8100, Shimadzu) and the iodometric titration measurements that estimate the average oxidation states of the transition metals using 0.03 M Na2S2O3 solution. The materials were also characterised by X-ray diffraction and indexed to C2/m (Fig. S1†).A mixture of the active material (Li[Li0.25Ni0.20Mn0.55]O1.93 or Li2MnO3), acetylene black (Denki Kagaku Kogyo) and polyvinylidene difluoride (PVDF, Kureha) with a weight ratio of 80![[thin space (1/6-em)]](https://www.rsc.org/images/entities/char_2009.gif) :10:10 was spread onto an aluminium foil with 1-methyl-2-pyrrolidone (NMP) and then dried at 80 °C under vacuum overnight to constitute a positive electrode. The electrode was pressed to a typical thickness of 30–35 μm. A foil of metallic lithium (0.2 mm in thickness, >99.9%, Honjo Metal) was used as counter and reference electrodes. These components were assembled together with a Celgard 2500 separator and soaked in the electrolyte solution in an Ar-filled glove box, which were sealed in an aluminium-coated laminate-type cell. The electrolyte used in this study was 1 M LiPF6, which was dissolved in anhydrous ethylene carbonate (EC) and ethylmethyl carbonate (EMC) with a volumetric ratio of 3:7 (Kishida Chemical).
:10:10 was spread onto an aluminium foil with 1-methyl-2-pyrrolidone (NMP) and then dried at 80 °C under vacuum overnight to constitute a positive electrode. The electrode was pressed to a typical thickness of 30–35 μm. A foil of metallic lithium (0.2 mm in thickness, >99.9%, Honjo Metal) was used as counter and reference electrodes. These components were assembled together with a Celgard 2500 separator and soaked in the electrolyte solution in an Ar-filled glove box, which were sealed in an aluminium-coated laminate-type cell. The electrolyte used in this study was 1 M LiPF6, which was dissolved in anhydrous ethylene carbonate (EC) and ethylmethyl carbonate (EMC) with a volumetric ratio of 3:7 (Kishida Chemical).
The electrochemical measurements were performed at room temperature on an automatic cycling and data recording system (HJ1001SD8, Hokuto Denko). The cells were galvanostatically cycled between 4.8 and 2.0 V vs. Li/Li+ at a current rate of 10 mA g−1. A series of delithiated/relithiated samples were prepared for HAX-PES measurements by disassembling the cell at desired states of charge and discharge (Tables S1 and S2†). They were carefully disassembled in the glove box and rinsed with dimethyl carbonate (DMC) to remove the electrolyte residue.
The HAX-PES spectra were acquired at room temperature at BL28XU at SPring-8 (Hyogo, Japan). The electrode samples were placed onto a sample holder in the glove box and then transferred to an ultra-high vacuum sample chamber (<5 × 10⁻⁶ Pa) without exposing them to air. The incident photon energy was 7.94 keV. The detection depth was estimated to be ca. 50 nm from thickness-controlled oxidised Si wafers. The photoelectron analyser was a VG Scienta EW4000. The pass energy was set to 200 eV. The binding energies of all the spectra were calibrated with respect to the lattice oxygen peak of Li[Li0.25Ni0.20Mn0.55]O1.93 (529.4 eV relative to the C 1s signal from acetylene black at 284.5 eV) and Li2MnO3 (529.5 eV) in O 1s spectra, respectively. These values were carefully determined by applying a dual beam charge neutraliser (low energy electrons and Ar+ ions) on an in-house photoelectron spectrometer PHI5000 VersaProbe II (monochromated Al Kα radiation; 1486.6 eV, ULVAC-PHI.Inc). The spectra were analysed after the Shirley-type background subtraction.
First-principles calculations were performed based on the spin-polarised density functional theory (DFT) using the CASTEP code28 to obtain essential information about the electronic structure of LLOs from a theoretical point of view. The generalised gradient approximation with the Hubbard U correction (GGA+U) for Ni and Mn 3d states (Ueff = 4.5 eV) was employed. The Perdew–Burke–Ernzerhof potential was used for the exchange-correlation term.29 The plane-wave cut-off energy was set to 550 eV. The k point sampling for the Brillouin zone integration was done according to the Monkhorst–Pack scheme with a grid spacing of <0.04 Å−1.30 The model structure was constructed to reflect a minimal structural domain in the real material, which was prepared from a 2 × 1 × 2 supercell of the Li2MnO3 (C2/m) structure with 4Li+ ions in a transition-metal layer (LiMn2 layer) substituted by 2Ni2+ ions, making the composition Li28Ni2Mn16O48 in the cell (the chemical composition in the simulation is different from that in the experiments for simplification). Atomic positions and cell parameters were fully relaxed until the residual forces and stresses acting on each atom were less than 0.03 eV Å−1 and 0.05 GPa, respectively. Delithiated structures (Li24Ni2Mn16O48 and Ni2Mn16O48) were also simulated for the Bader charge analysis.31,32
3. Results and discussion
3.1. Chemical states in Li[Li0.25Ni0.20Mn0.55]O1.93 during the 1st charge–discharge cycle
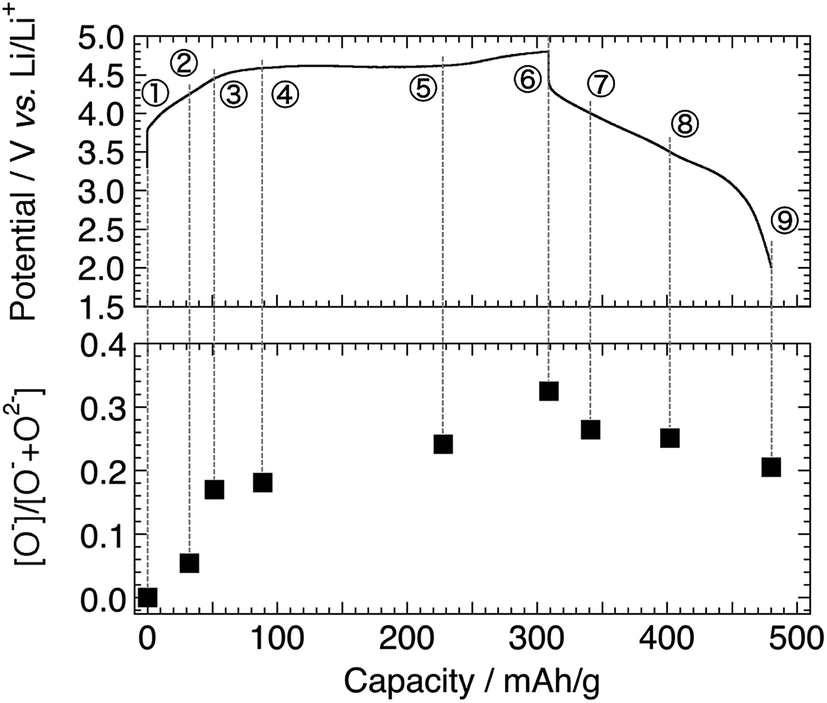
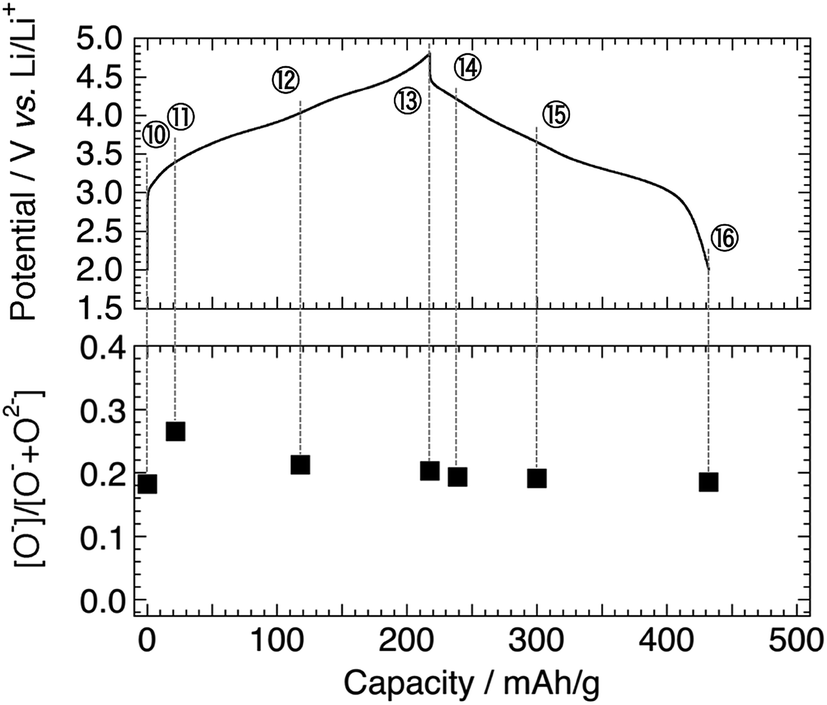
Fig. 1 shows the charge–discharge profiles of Li[Li0.25Ni0.20Mn0.55]O1.93 for the 1st and 5th cycles. The sampling points for HAX-PES measurements are marked on the figure. On the 1st charging process, a voltage slope is observed below 4.5 V, and a plateau is above 4.5 V, which is characteristic of the charging profile of LLOs.2,4 This plateau is irreversible and is not observed on the 1st discharging process and subsequent charge–discharge cycles. The charging and discharging capacities are 309 and 172 mA h g−1 for the 1st cycle and 218 and 215 mA h g−1 for the 5th cycle, respectively. These capacities are much higher than that of Li2MnO3 prepared under the same conditions (Fig. S2†).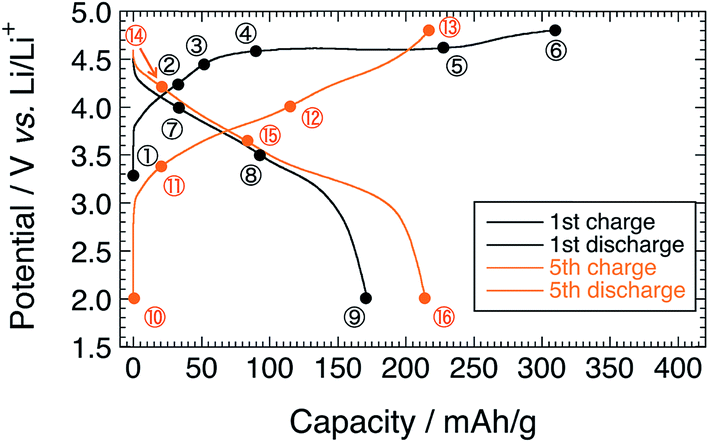 | ||
| Fig. 1 Charge–discharge profiles of the Li[Li0.25Ni0.20Mn0.55]O1.93 electrode for the 1st and 5th cycles. Sampling points for HAX-PES measurements are marked on the figure. | ||
Fig. 2a shows the Mn 2p3/2 HAX-PES spectra for the 1st cycle. Mn ions are mainly tetravalent in the pristine Li[Li0.25Ni0.20Mn0.55]O1.93 (sample #1) on the basis of the chemical shift references in the previous studies.33,34 The main peak remains almost unchanged on the charging to 4.8 V (Sps. #2–6), indicating that the tetravalent Mn ions have no contributions to charge compensation on the initial charging process. They remain unchanged during the discharging down to 3.5 V (Sps. #7 and 8), but there is an increase in intensity at lower energy between 639.0 and 641.0 eV at 2.0 V (Sp. #9). This indicates the increase of lower-valence components (Mn2+ and Mn3+) in a voltage window between 3.5 and 2.0 V. Some researchers also reported a similar reduction in the Mn oxidation state during discharging,15,23,35,36 suggesting the participation of the Mn redox reaction in the subsequent charge–discharge cycles. On the other hand, we found a different oxidation behaviour of Mn ions in Li2MnO3, where the increase of lower-valence components is shown on the charging process (especially, Sp. #2 in Fig. S3 and S4†). Carroll et al. reported this unusual behaviour for Li1.2Ni0.2Mn0.6O2 by using XPS and electron energy loss spectroscopy (EELS).37 They suggested that the Mn reduction on the charging process was a consequence of the charge compensation for oxygen vacancy formation. Therefore, our results imply that the O2 gas release is rather suppressed in Li[Li0.25Ni0.20Mn0.55]O1.93 than in Li2MnO3.
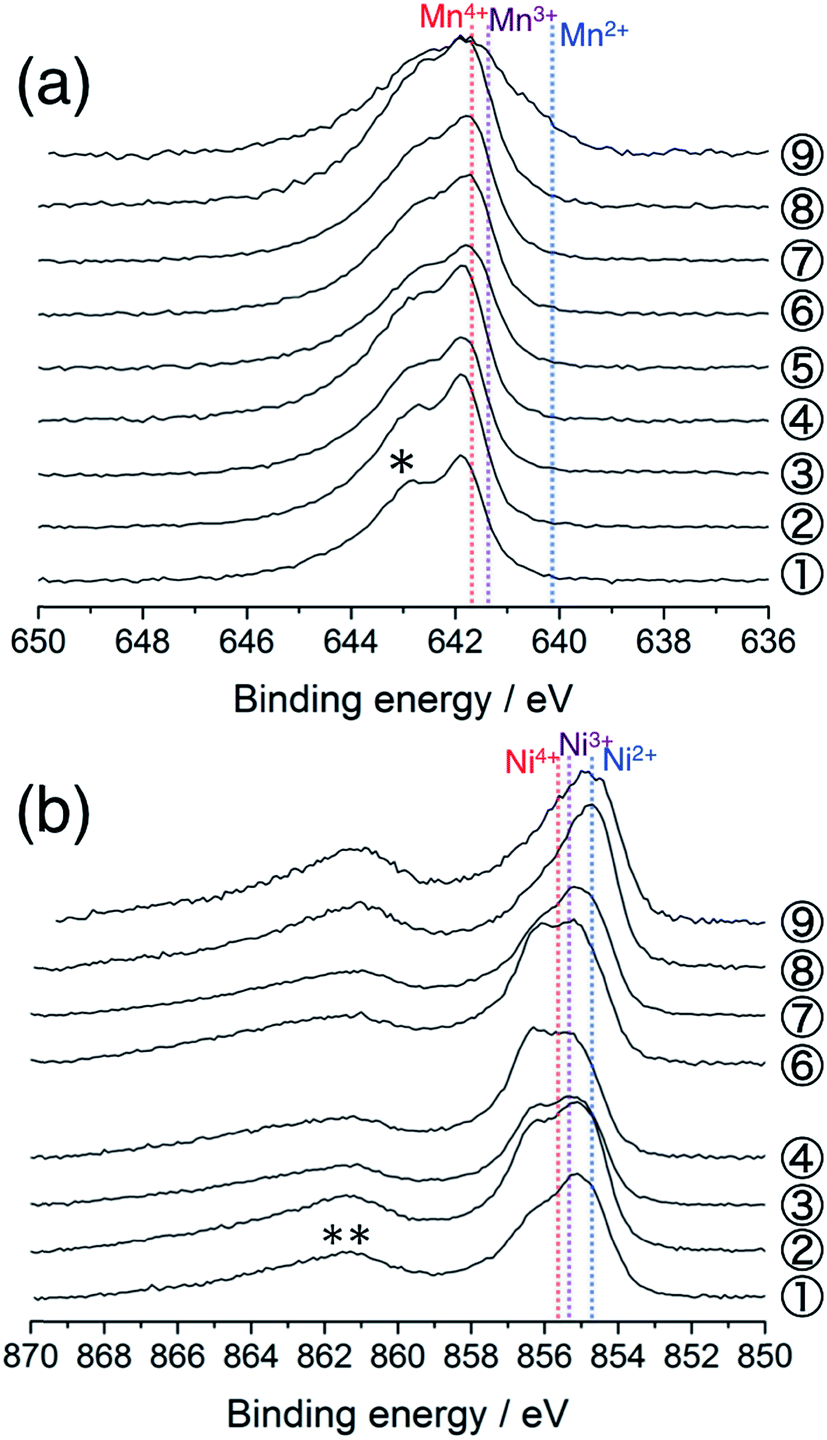 | ||
| Fig. 2 (a) Mn 2p3/2 and (b) Ni 2p3/2 photoelectron spectra of Li[Li0.25Ni0.20Mn0.55]O1.93 electrodes for the 1st cycle. The sampling points are cited from Fig. 1. The point #5 is excluded in (b) due to the acquisition failure. An asterisk in (a) and a double asterisk in (b) indicate the multiplet splitting and satellite peak, respectively. The vertical lines show the reference positions from ref. 33 and 38 rescaled with the acetylene black peak position at 284.5 eV in C 1s spectra. | ||
Fig. 2b shows the Ni 2p3/2 photoelectron spectra for the 1st cycle. The pristine sample consists of divalent and trivalent Ni ions (Sp. #1), although the chemical shifts for the divalent, trivalent, and tetravalent Ni references were very close to each other.38 The shoulder at the higher energy side increases in intensity during the voltage slope. This means the increase in the amount of tetravalent Ni ions up to 4.5 V (Sps. #2–4). In the plateau region, the peak shape is almost unchanged, indicating that Ni ions do not contribute to the charge compensation at this stage (Sp. #6). The high valence Ni ions are reduced to be divalent down to 3.5 V (Sps. #7 and 8). The peak position is unchanged in the voltage window between 3.5 and 2.0 V (Sp. #9). Similar behaviours were also reported in the previous XPS and XAS studies.37,39–41 We note that the Li 1s spectra show a monotonous decrease in intensity during the charging process up to 4.8 V (Fig. S5a†), indicating that the above spectral changes in Mn and Ni ions cannot explain the charge compensation in the voltage plateau region.
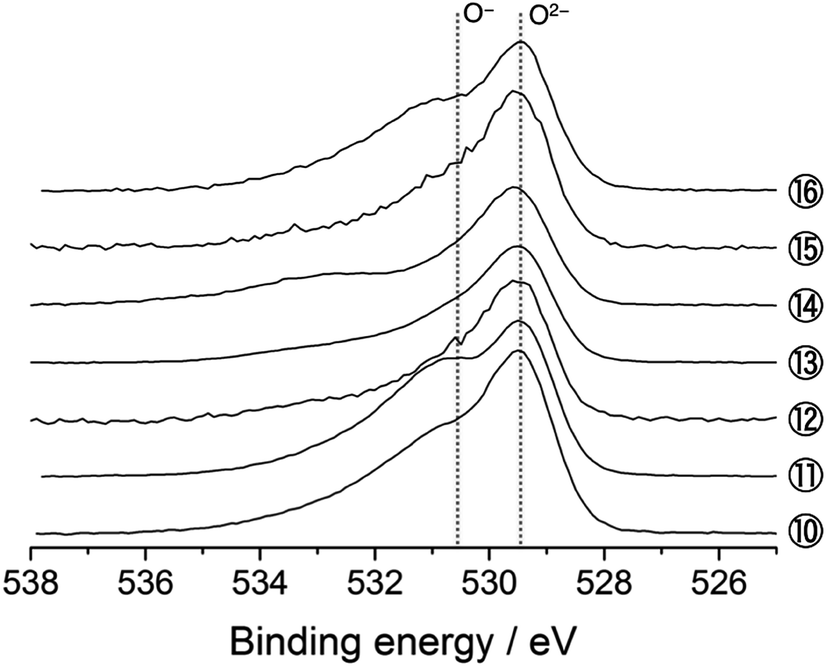
The O 1s photoelectron spectra are shown in Fig. 3. The prominent peak at 529.4 eV is assigned to the lattice oxide ions (O2−) in the pristine material (Sp. #1). The broader signal centred at 532.7 eV comes from the surface-deposited oxygen species. On delithiation, a shoulder signal arises at ca. 530.6 eV, the higher energy side of the oxide peak (Sps. #2–6). According to the previous studies, this signal corresponds to the more oxidised oxygen state than O2− ions in the material, i.e., peroxide-like O− ions (here, the term “peroxide” does not necessarily mean the molecular unit O22− as in Li2O2).23,42–44 They are also visible in the Li2MnO3 electrodes (Sps. #2 and 3 in Fig. S6†). We here emphasise that this O− signal is clearly visible and enhanced in the HAX-PES spectra rather than in the “surface-sensitive” in-house XPS spectra used in the previous studies,23–26 which strongly suggests that they are formed in the lattice structure and are not from the surface-deposited oxygenated product such as Li2O2. We note that the in-house XPS O 1s spectrum with Ar+ sputtering also gives clear evidence of the O− species in the bulk (Fig. S7†). Fig. 4 represents the evolution of O− ions relative to total lattice oxygen [O−]/[O− + O2−] in Li[Li0.25Ni0.20Mn0.55]O1.93. The details of the peak decomposition procedures are described in the ESI (Fig. S8†). The amount of O− species monotonously increases up to 33% at 4.8 V and then slightly decreases down to 2.0 V. A very recent XPS study on Li1.2Ni0.13Co0.13Mn0.54O2, as well as Li2Ru1−xMxO3 and Li2Ir1−xMxO3, has reported that ca. 40% of lattice oxygen was converted to the peroxide species in the voltage plateau region,45 which is consistent with our result. Our result also shows that the O− species are formed on the voltage slope during charging and seem to exist even at 2.0 V (Fig. 4). This suggests that the charge compensation is achieved not only by Ni ions but also by O anions in the slope region during the charging process. We therefore believe that the O− species formed in the slope region is attached to the Ni ions, and the cation–anion dual charge compensation mechanism works at this stage. On the other hand, the O− species formed in the plateau region can be related to the Mn ions, which are in the Li2MnO3- or Li2(Ni,Mn)O3-like domain assuming a nano-level composite structural model3,5 in Li[Li0.25Ni0.20Mn0.55]O1.93.
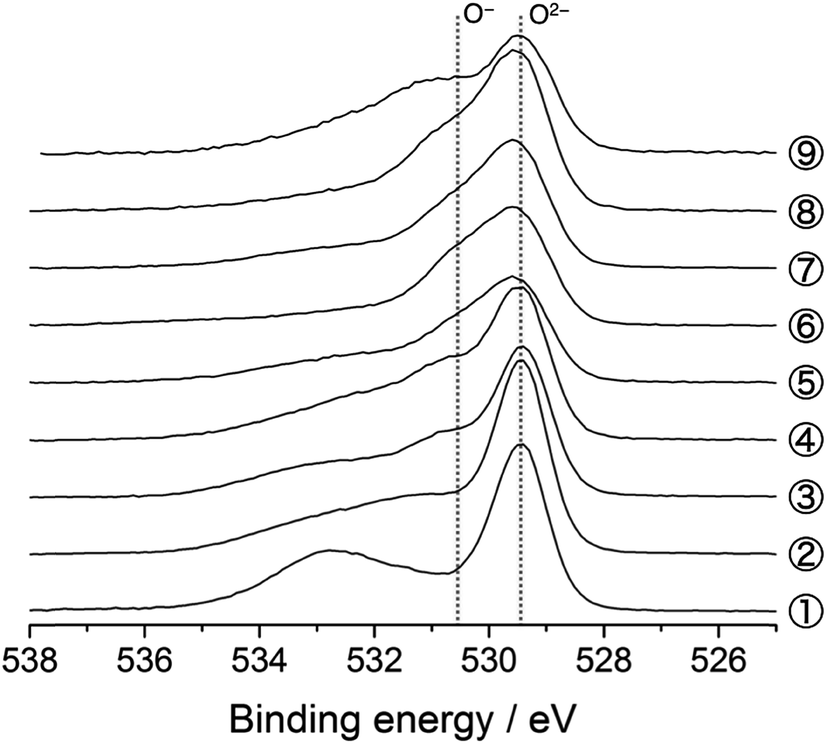 | ||
| Fig. 3 O 1s photoelectron spectra of Li[Li0.25Ni0.20Mn0.55]O1.93 electrodes for the 1st cycle. The sampling points are cited from Fig. 1. | ||
 | ||
| Fig. 4 Intensity ratio of [O−]/[O− + O2−] in Li[Li0.25Ni0.20Mn0.55]O1.93 electrodes for the 1st cycle. The sampling points are cited from Fig. 1. | ||
Considering the chemical composition of Li[Li0.25Ni0.20Mn0.55]O1.93, the initial Ni oxidation state is +2.1, and therefore, it can deliver a capacity of ca. 130 mA h g−1 when it is oxidised to +4 during the charging up to 4.8 V. At the end of charge, 33% of the lattice oxygen (i.e., 0.63O) change to the O− species (Fig. 4, Sp. #6), corresponding to an additional charge of 208 mA h g−1 by considering the O2−/O− couple. Therefore, the total capacity can be 338 mA h g−1. This is slightly higher but reasonably close to the actual charging capacity of 309 mA h g−1. At the end of discharge, the capacities recovered by Ni2+/Ni4+ and O2−/O− couples are ca. 130 and 76 mA h g−1, respectively, the sum of which is again slightly higher than the actual discharging capacity of 172 mA h g−1 including the partial contributions from the Mn reduction. The small differences (overestimates) partly come from the assumption that all the Ni2+ ions change to Ni4+ without any electric isolation of active material particles and/or from the uncertainty in peak decomposition for the O 1s spectra. It is also suggested that the irreversible capacity during the 1st charge–discharge cycle is caused by the irreversible O2−/O− redox reaction (Fig. 4).
To gain some insight into the charge compensation mechanism in the LLO system, we calculated the electronic density of states (DOS) of a Li2MnO3–Li(Ni,Mn)O2 composite-type model structure. The model structure was prepared in a simple fashion from a 2 × 1 × 2 supercell of the Li2MnO3 (C2/m) structure with 4Li+ ions in a LiMn2 layer substituted by 2Ni2+ ions (and 2 vacancies) being a Ni1/2Mn2 layer (Fig. 5). This model gives atomic column images of –Li–Mn–Mn– arrangement as in Li2MnO3 and –M–M–M– as in LiMO2 along the b axis, which were observed in the previous studies using scanning transmission electron microscopy (STEM).40,46,47 The calculated DOS spectra show that the valence band just below the Fermi level is governed by Ni 3d and O 2p states in the Ni1/2Mn2 layer, indicating the contribution from both Ni and O ions for charge compensation during the voltage slope region. After the charge compensation by the Ni2+/Ni4+ couple is finished, it is suggested that the oxidation of O anions from the LiMn2 layer is also being involved as expected on the voltage plateau. The charge compensation can be evaluated based on the Bader charge analysis (Table 1). The average charges of Ni and Mn ions in Li28Ni2Mn16O48 are +1.26 and +2.08, respectively. They are smaller than their corresponding formal charges (+2 and +4), indicating their strong covalent bonding with oxygen. The charge of Ni ions increases but that of Mn ions remains almost constant when Li ions are extracted from the model structure. The charge of O anions attached to Ni ions significantly decreases in Li24Ni2Mn16O48, but the O anions attached to Mn ions become a more oxidised state in Ni2Mn16O48.
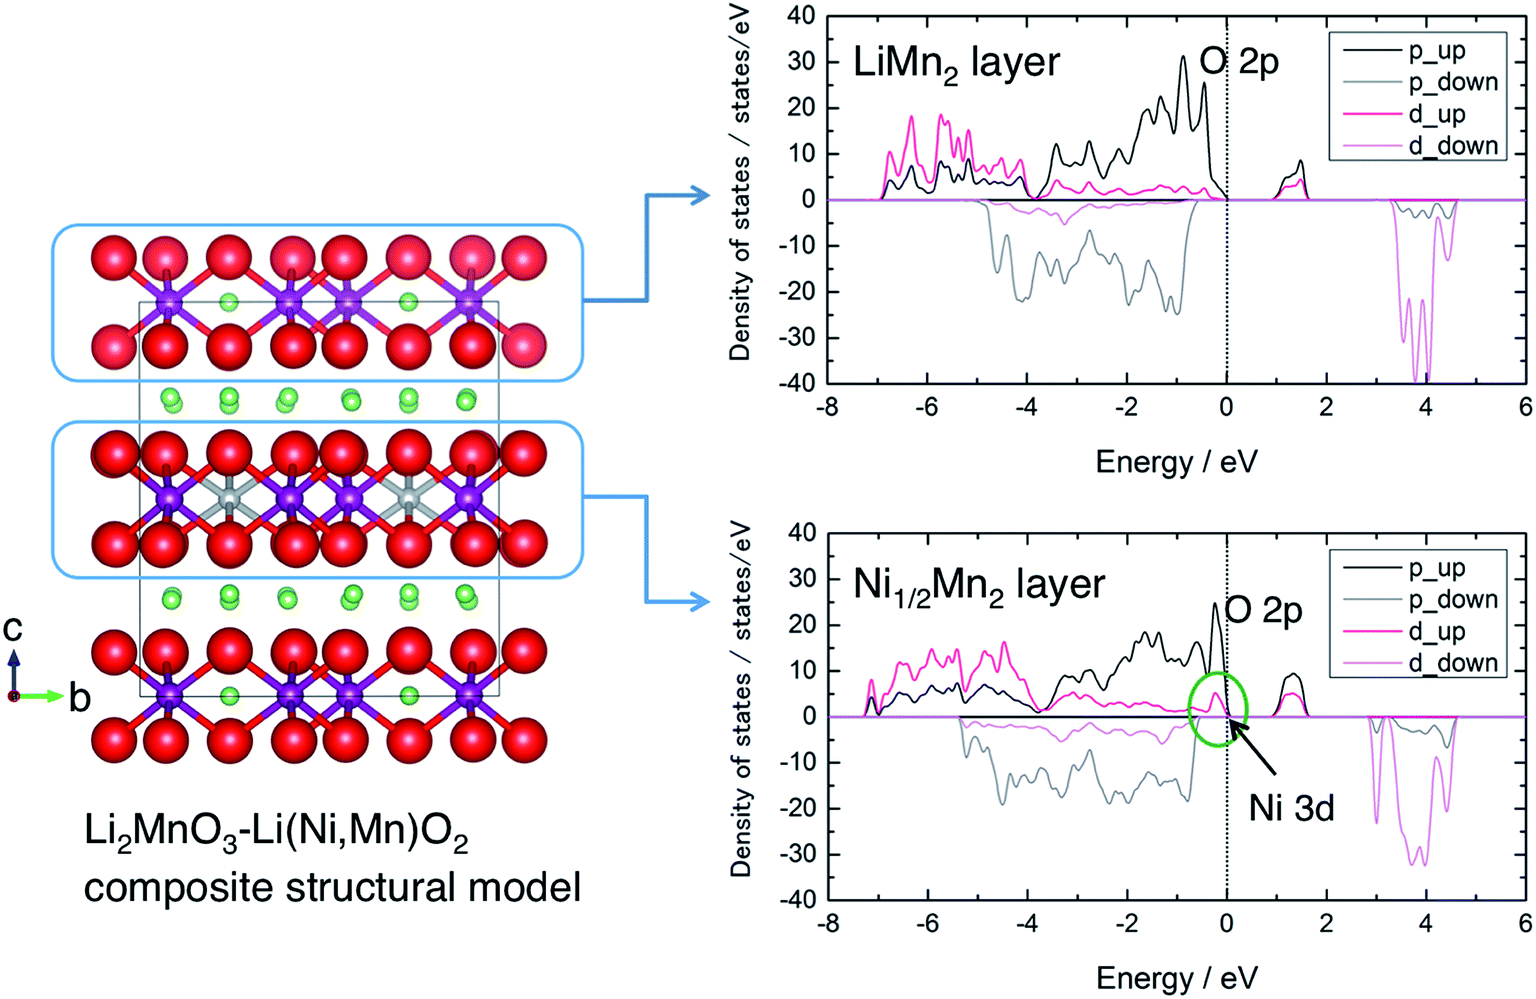 | ||
| Fig. 5 A Li2MnO3–Li(Ni,Mn)O2-like composite structural model and calculated density of states of the LiMn2 layer (Li2MnO3-like domain) and Ni1/2Mn2 layer (Li(Ni,Mn)O2-like domain). O: red sphere, Mn: purple sphere, Ni: gray sphere, and Li: green sphere. The p and d components are almost exclusively dominated by O 2p and Ni/Mn 3d states, respectively. The “up” and “down” denote majority and minority spin states, respectively. | ||
Based on the combined results of Mn 2p, Ni 2p, and O 1s spectra and qualitative understandings from the DFT calculations, the charge compensation mechanism is summarised as follows. The oxidation of Ni ions (Ni2+/Ni4+) and O anions (O2−/O−) occurs in the voltage slope region up to 4.5 V. Then, the oxidation of O anions (O2−/O−) only contributes to the charge compensation in the voltage plateau region. The oxygen loss as a gas release from this material seems less significant than that from Li2MnO3. On the discharging process, the reduction of Ni ions and O anions occurs down to 3.5 V and that of Mn ions starts below 3.5 V.
Because qualitative or quantitative gas detection measurements such as DEMS were not carried out, it is still unclear whether or not there is some participation of oxygen loss for charge compensation in this material. On the other hand, the present study shows the significant role of the redox reaction of the lattice oxygen (O2−/O−), suggesting that the Ni ions in the structure suppress the O2 gas release at the voltage plateau. According to the previous studies, it is expected that a more electronegative cation is preferably hybridised to the ligand, the activated oxygen species.23,24,36 Here, the Ni4+ ion at charged states has a larger electronegativity and has a preference to hybridise with the activated oxygen species over Mn4+ ions.36 The present study supports the suggestion given by the previous studies that strong hybridisation of Ni4+ and O− species would stabilise the lattice structure preventing the O2 release as evidenced by the fact that the Mn oxidation state remains tetravalent during the voltage plateau, while Li2MnO3 shows Mn valence reduction originating from the substantial O2 release from the structure.37
3.2. Chemical states in Li[Li0.25Ni0.20Mn0.55]O1.93 during the 5th charge–discharge cycle
Next, we examine the structural stability on charge–discharge cycling. Fig. 6a shows the Mn 2p3/2 HAX-PES spectra for the 5th charge–discharge cycle. The sample disassembled at 2.0 V after the 4th cycle (Sp. #10) shows a similar spectrum to that disassembled at 2.0 V after the 1st cycle (Sp. #9 in Fig. 2a). On the charging process, the decrease of lower-valence Mn2+ and Mn3+ components and concomitant increase of Mn4+ state are observed above 3.5 V (Sps. #12 and 13). This spectral change is reversible (Sps. #14–16). The increased discharging capacity below 3.5 V for the 5th cycle compared with that for the 1st cycle (Fig. 1) is attributable to the increasing participation of the Mn redox reaction for charge compensation. On the other hand, the oxidation state of Ni ions remains divalent during the 5th charge–discharge cycle (Fig. 6b).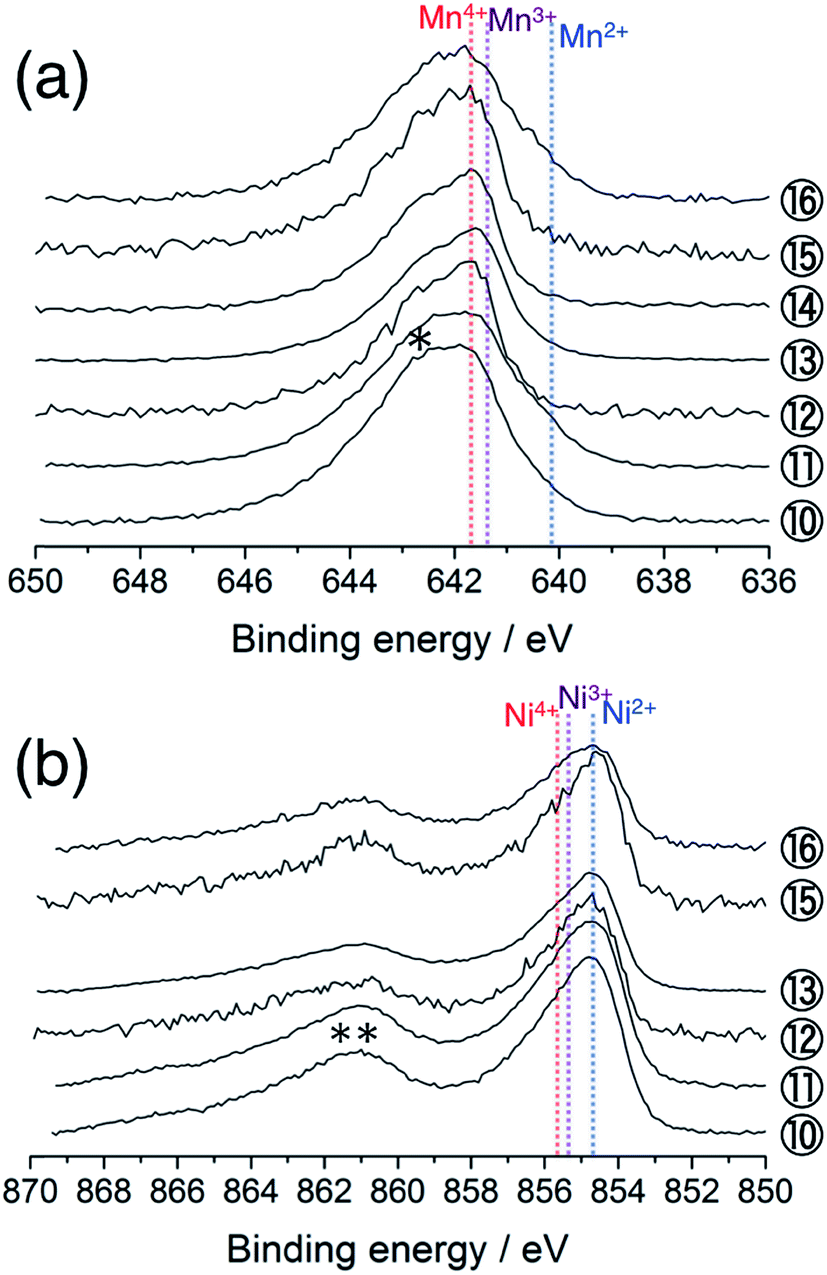 | ||
| Fig. 6 (a) Mn 2p3/2 and (b) Ni 2p3/2 photoelectron spectra of Li[Li0.25Ni0.20Mn0.55]O1.93 electrodes for the 5th cycle. The sampling points are cited from Fig. 1. The point #14 is excluded in (b) due to the acquisition failure. An asterisk in (a) and a double asterisk in (b) indicate the multiplet splitting and satellite peak, respectively. The vertical lines show the reference positions from ref. 33 and 38 rescaled with the acetylene black peak position at 284.5 eV in C 1s spectra. | ||
Fig. 7 shows the O 1s spectra for the 5th cycle. Unfortunately, the signal at higher energy (>ca. 531.0 eV), mainly attributable to the surface-deposited lithium carbonate Li2CO3, is significant for the samples disassembled below 3.5 V. Based on the peak decomposition (Fig. S9†), we found that the O− species still exist in the material, but they are almost constant in amount on the 5th cycle (Fig. 8).
 | ||
| Fig. 7 O 1s photoelectron spectra of Li[Li0.25Ni0.20Mn0.55]O1.93 electrodes for the 5th cycle. The sampling points are cited from Fig. 1. | ||
 | ||
| Fig. 8 Intensity ratio of [O−]/[O− + O2−] in Li[Li0.25Ni0.20Mn0.55]O1.93 electrodes for the 5th cycle. The sampling points are cited from Fig. 1. | ||
Considering that the Li 1s spectra for the 5th cycle still show the reversible delithiation/relithiation behaviour (Fig. S5b†), the charge compensation is satisfied only by the Mn redox reaction on the 5th cycle. It is a very confusing result, because the previous XAS studies (bulk-sensitive) reported that the Ni ions act as a charge compensator even after the 1st cycle.19,40,41 Therefore, we believe that the Ni ions become inactive over (at least) 50 nm thickness from the surface, which is a probing depth of HAX-PES measurements, while they are still active in the deeper inside of the particles. This is probably related to structural rearrangement (deterioration) on the surface and sub-surface region. Recent STEM observations have revealed the formation of spinel- or rocksalt-like structural domains on the particle surface of LLOs after the charge–discharge cycles.46,48–51 Therefore, the Ni 2p HAX-PES spectra of the cycled materials represent the electrochemically inactive Ni ions stabilised in the sub-surface Li-poor spinel- or rocksalt-like domains, which do not act as a charge-compensating ion on the charge–discharge cycles. The oxygen anions also have no more contribution to charge compensation in the sub-surface region, although it is possible that they are redox active in the bulk.19,39,41 It is noteworthy that the formation of the spinel- or rocksalt-like domains suggests the oxygen loss from the surface. This indicates that both the mechanisms (oxygen loss and oxidation of the lattice oxygen) are important for the delithiation of the LLO positive electrode materials, and their contributions would be dependent on the chemical composition. The former mechanism would be dominant in Li2MnO3, but the latter becomes more important in Ni-containing LLOs.
4. Conclusions
We have investigated the oxidation/reduction behaviours of oxygen and transition metals in a Li-rich manganese-based layered oxide Li[Li0.25Ni0.20Mn0.55]O1.93 by using hard X-ray photoelectron spectroscopy. The Ni oxidation state increased in the voltage slope region of the 1st charging process, while it remained unchanged in the plateau region. In the relithiated material, the Ni oxidation state reverted to divalent. Tetravalent Mn ions did not contribute to the charge compensation for the 1st charging process but were partially reduced on the discharging to 2.0 V. Then, the low-valence Mn ions participated in the delithiation/relithiation process on the subsequent cycles. It was clearly shown that the O− species were formed in the material. The cation–anion dual charge compensation was suggested in the voltage slope region with the aid of theoretical calculations. We emphasise that HAX-PES is an excellent technique to understand the contribution of the lattice oxygen in charge compensation, because it enables us to get chemical state information on the lattice structure buried beneath the surface-oxygenated products due to its deeper probing depth than in-house XPS.The Ni ions in the LLO lattice structure are considered to increase the capacity delivered by a (partially) reversible O2−/O− redox couple. This is related to the suppression of O2 release due to the strong covalent bonding between Ni4+ and O− ions in the LiMO2- and Li2MO3-like domains. As a result, the discharging capacity exceeds 200 mA h g−1. The O2 release, if any, would come from the Li2MnO3 domain in the LLO lattice structure. Therefore, the homogeneous Ni incorporation into the lattice, that is a shift from the “composite” to “solid solution” structure, may be a key factor to design a fully reversible anion redox system.
Furthermore, we suggested the structural rearrangement occurring in the sub-surface region in the cycled material. During the 5th charge–discharge cycle, the O− species were found to be electrochemically inactive. The divalent Ni ions were also inactive, but the oxidation state of Mn ions reversibly changed. It is very confusing because Ni and O ions were important redox-active elements in the 1st cycle. We therefore consider that structural deterioration that occurred in the cycled material is related to the formation of spinel- or rocksalt-like domains over the sub-surface region (ca. 50 nm thickness) of the particles.
Acknowledgements
This work was supported by the Research and Development Initiative for Scientific Innovation of New Generation Batteries (RISING) project from New Energy and Industrial Technology Development Organization (NEDO), Japan. The authors thank Dr Yasuhiro Takabayashi, Mr Yuji Kamishima, and Mr Takahiro Kakei for their support on sample preparation, characterisation and electrochemical measurements. The HAX-PES measurements were performed with the approval of the Japan Synchrotron Radiation Research Institute (JASRI, Proposal No. 2013B7600, 2014B7600 and 2015A7600).References
- T. Ohzuku, A. Ueda, M. Nagayama, Y. Iwakoshi and H. Komori, Electrochim. Acta, 1993, 38, 1159–1167 CrossRef CAS.
- M. M. Thackeray, C. S. Johnson, J. T. Vaughey, N. Li and S. A. Hackney, J. Mater. Chem., 2005, 15, 2257–2267 RSC.
- M. M. Thackeray, S.-H. Kang, C. S. Johnson, J. T. Vaughey, R. Benedek and S. A. Hackney, J. Mater. Chem., 2007, 17, 3112–3125 RSC.
- T. Ohzuku, M. Nagayama, K. Tsuji and K. Ariyoshi, J. Mater. Chem., 2011, 21, 10179–10188 RSC.
- H. Yu and H. Zhou, J. Phys. Chem. Lett., 2013, 4, 1268–1280 CrossRef CAS PubMed.
- J. Yan, X. Liu and B. Li, RSC Adv., 2014, 4, 63268–63284 RSC.
- Z. Lu and J. R. Dahn, J. Electrochem. Soc., 2002, 149, A815–A822 CrossRef CAS.
- N. Tran, L. Croguennec, M. Ménétrier, F. Weill, Ph. Biensan, C. Jordy and C. Delmas, Chem. Mater., 2008, 20, 4815–4825 CrossRef CAS.
- D. Y. W. Yu, K. Yanagida, Y. Kato and H. Makamura, J. Electrochem. Soc., 2009, 156, A417–A424 CrossRef CAS.
- A. R. Armstrong, M. Holzapfel, P. Novák, C. S. Johnson, S.-H. Kang, M. M. Thackeray and P. G. Bruce, J. Am. Chem. Soc., 2006, 128, 8694–8698 CrossRef CAS PubMed.
- F. La Mantia, F. Rosciano, N. Tran and P. Novák, J. Electrochem. Soc., 2009, 156, A823–A827 CrossRef CAS.
- P. Lanz, H. Sommer, M. Schulz-Dobrick and P. Novák, Electrochim. Acta, 2013, 93, 114–119 CrossRef CAS.
- E. Castel, E. J. Berg, M. El Kazzi, P. Novák and C. Villevieille, Chem. Mater., 2014, 26, 5051–5057 CrossRef CAS.
- M. Jiang, B. Key, Y. S. Meng and C. P. Grey, Chem. Mater., 2009, 21, 2733–2745 CrossRef CAS.
- N. Yabuuchi, K. Yoshii, S.-T. Myung, I. Nakai and S. Komaba, J. Am. Chem. Soc., 2011, 133, 4404–4419 CrossRef CAS PubMed.
- J. Kikkawa, T. Akita, M. Tabuchi, K. Tatsumi and M. Kohyama, J. Electrochem. Soc., 2011, 158, A760–A768 CrossRef CAS.
- Y. Koyama, I. Tanaka, M. Nagao and R. Kanno, J. Power Sources, 2009, 189, 798–801 CrossRef CAS.
- R. Xiao, H. Li and L. Chen, Chem. Mater., 2012, 24, 4242–4251 CrossRef CAS.
- M. Oishi, C. Yogi, I. Watanabe, T. Ohta, Y. Orikasa, Y. Uchimoto and Z. Ogumi, J. Power Sources, 2015, 276, 89–94 CrossRef CAS.
- A. M. Andersson, D. P. Abraham, R. Haasch, S. MacLaren, J. Liu and K. Amine, J. Electrochem. Soc., 2002, 149, A1358–A1369 CrossRef CAS.
- L. Bodenes, R. Dedryvère, H. Martinez, F. Fischer, C. Tessier and J.-P. Pérès, J. Electrochem. Soc., 2012, 159, A1739–A1746 CrossRef CAS.
- R. A. Quinlan, Y.-C. Lu, Y. Shao-Horn and A. N. Mansour, J. Electrochem. Soc., 2013, 160, A669–A677 CrossRef CAS.
- M. Sathiya, K. Ramesha, G. Rousse, D. Foix, D. Gonbeau, A. S. Prakash, M. L. Doublet, K. Hemalatha and J.-M. Tarascon, Chem. Mater., 2013, 25, 1121–1131 CrossRef CAS.
- M. Sathiya, G. Rousse, K. Ramesha, C. P. Laisa, H. Vezin, M. T. Sougrati, M.-L. Doublet, D. Foix, D. Gonbeau, W. Walker, A. S. Prakash, M. Ben Hassine, L. Dupont and J.-M. Tarascon, Nat. Mater., 2013, 12, 827–835 CrossRef CAS PubMed.
- S. Han, B. Qiu, Z. Wei, Y. Xia and Z. Liu, J. Power Sources, 2014, 268, 683–691 CrossRef CAS.
- S. Han, Y. Xia, Z. Wei, B. Qiu, L. Pan, Q. Gu, Z. Liu and Z. Guo, J. Mater. Chem. A, 2015, 3, 11930–11939 CAS.
- G. Panaccione and K. Kobayashi, Surf. Sci., 2012, 606, 125–129 CrossRef CAS.
- S. J. Clark, M. D. Segall, C. J. Picard, P. J. Hasnip, M. J. Probert, K. Refson and M. C. Payne, Z. Kristallogr., 2005, 220, 567–570 CAS.
- J. P. Perdew, K. Burke and M. Ernzerhof, Phys. Rev. Lett., 1996, 77, 3865–3868 CrossRef CAS PubMed.
- H. J. Monkhorst and J. D. Pack, Phys. Rev. B: Condens. Matter Mater. Phys., 1976, 13, 5188–5192 CrossRef.
- R. Bader, Atoms in Molecules: A Quantum Theory, Oxford University Press, New York, 1990 Search PubMed.
- G. Henkelman, A. Arnaldsson and H. Jónsson, Comput. Mater. Sci., 2006, 36, 354–360 CrossRef.
- M. Oku, K. Hirokawa and S. Ikeda, J. Electron Spectrosc. Relat. Phenom., 1975, 7, 465–473 CrossRef CAS.
- E. Regan, T. Groutso, J. B. Metson, R. Steiner, B. Ammundsen, D. Hassell and P. Pickering, Surf. Interface Anal., 1999, 27, 1064–1068 CrossRef CAS.
- C. Gan, H. Zhan, X. Hu and Y. Zhou, Electrochem. Commun., 2005, 7, 1318–1322 CrossRef CAS.
- S. Hy, J.-H. Cheng, J.-Y. Liu, C.-J. Pan, J. Rick, J.-F. Lee, J.-M. Chen and B. J. Hwang, Chem. Mater., 2014, 26, 6919–6927 CrossRef CAS.
- K. J. Carroll, D. Qian, C. Fell, S. Calvin, G. M. Veith, M. Chi, L. Baggetto and Y. S. Meng, Phys. Chem. Chem. Phys., 2013, 15, 11128–11138 RSC.
- H. Arai, M. Tsuda, K. Saito, M. Hayashi, K. Takei and Y. Sakurai, J. Solid State Chem., 2002, 163, 340–349 CrossRef CAS.
- H. Koga, L. Croguennec, M. Ménétrier, P. Mannessiez, F. Weill, C. Delmas and S. Belin, J. Phys. Chem. C, 2014, 118, 5700–5709 CAS.
- X. Yu, Y. Lyu, L. Gu, H. Wu, S.-M. Bak, Y. Zhou, K. Amine, S. N. Ehrlich, H. Li, K.-W. Nam and X.-Q. Yang, Adv. Energy Mater., 2014, 4, 1300950 Search PubMed.
- A. Ito, Y. Sato, T. Sanada, M. Hatano, H. Horie and Y. Ohsawa, J. Power Sources, 2011, 196, 6828–6834 CrossRef CAS.
- S. L. Qiu, L. Lin, J. Chen and M. Strongin, Phys. Rev. B: Condens. Matter Mater. Phys., 1990, 41, 7467–7473 CrossRef CAS.
- J.-C. Dupin, D. Gonbeau, P. Vinatier and A. Levasseur, Phys. Chem. Chem. Phys., 2000, 2, 1319–1324 RSC.
- R. Younesi, M. Hahlin, F. Björefors, P. Johansson and K. Edström, Chem. Mater., 2013, 25, 77–84 CrossRef CAS.
- D. Foix, M. Sathiya, E. McCalla, J.-M. Tarascon and D. Gonbeau, J. Phys. Chem. C, 2016, 120, 862–874 CAS.
- A. Boulineau, L. Simonin, J.-F. Colin, E. Canévet, L. Daniel and S. Patoux, Chem. Mater., 2012, 24, 3558–3566 CrossRef CAS.
- H. Yu, R. Ishikawa, Y.-G. So, N. Shibata, T. Kudo, H. Zhou and Y. Ikuhara, Angew. Chem., Int. Ed., 2013, 52, 5969–5973 CrossRef CAS PubMed.
- A. Ito, K. Shoda, Y. Sato, M. Hatano, H. Horie and Y. Ohsawa, J. Power Sources, 2011, 196, 4785–4790 CrossRef CAS.
- A. Boulineau, L. Simonin, J.-F. Colin, C. Bourbon and S. Patoux, Nano Lett., 2013, 13, 3857–3863 CrossRef CAS PubMed.
- C. Genevois, H. Koga, L. Croguennec, M. Ménétrier, C. Delmas and F. Weill, J. Phys. Chem. C, 2015, 119, 75–83 CAS.
- P. Yan, A. Nie, J. Zheng, Y. Zhou, D. Lu, X. Zhang, R. Xu, I. Belharouak, X. Zu, J. Xiao, K. Amine, J. Liu, F. Gao, R. Shahbazian-Yassar, J.-G. Zhang and C.-M. Wang, Nano Lett., 2015, 15, 514–522 CrossRef CAS PubMed.
Footnote |
| † Electronic supplementary information (ESI) available. See DOI: 10.1039/c6ta01152g |
| This journal is © The Royal Society of Chemistry 2016 |