 Open Access Article
Creative Commons Attribution 3.0 Unported Licence
Nitrogen doped carbide derived carbon aerogels by chlorine etching of a SiCN aerogel
E.
Zera
*a,
W.
Nickel
b,
G. P.
Hao
b,
L.
Vanzetti
c,
S.
Kaskel
b and
G. D.
Sorarù
 a
a
aDipartimento di Ingegneria Industriale, Università di Trento, Via Sommarive 9, 38123 Trento, Italy. E-mail: emanuele.zera@unitn.it
bDepartment of Inorganic Chemistry, Dresden University of Technology, Bergstraße 66, D-01062 Dresden, Germany
cFondazione Bruno Kessler-CMM-MNF, Via Sommarive 18, 38123 Trento, Italy
First published on 22nd February 2016
Abstract
Silicon was selectively removed from a silicon carbonitride (SiCN) aerogel by hot chlorine gas treatment, leading to a N-doped carbon aerogel (N-CDC aerogel). The combined effects of pyrolysis and etching temperature were studied with regard to the change in the composition of the material after etching as well as the microstructure of the produced hierarchically porous material. Upon removal of Si from amorphous SiCN, carbon and nitrogen, which are not bonded together in the starting material, react, creating new C–N bonds. The removal of silicon also gives rise to a high amount of micropores and hence a high specific surface area, which can be beneficial for the functionality of the carbonaceous material produced. The mesoporous structure of the aerogel allows us to complete the etching at low temperature, which was found to be a crucial parameter to maintain a high amount of nitrogen in the material. The combination of a high amount of micropores and the mesopore transport system is beneficial for adsorption processes due to the combination of a high amount of adsorption sites and effective transport properties of the material. The N-CDC aerogels were characterized by nitrogen physisorption, X-ray photoelectron spectroscopy (XPS), thermogravimetry (TG/DTA), and infrared spectroscopy (DRIFT) and they were evaluated as CO2 absorbers and as electrodes for electric double-layer capacitors (EDLCs).
Introduction
Nitrogen doped carbons are a class of interesting functional materials that have been proposed for various applications. In particular, many authors propose to use these materials for CO2 adsorption, water purification, energy storage (lithium batteries and supercapacitors) and catalysis. Many papers and reviews have summarized synthesis routes and applications for N-containing carbons and provided a good overview on the topic.1–9In all the proposed applications, the beneficial effect of nitrogen is strongly related to the specific bonds it forms with carbon, giving rise to amine functionalities or to proper substitutional doping in the graphitic planes. Although different functionalities are suitable for different specific applications, what is commonly required for these materials is a certain degree of porosity in order to enhance the reactivity with the environment. This points out the importance of the specific surface area (SSA) and the pore size distribution (PSD) of such N-doped carbon materials. In general, a high SSA and hierarchical pore structure are thought to be fundamental parameters that need to be optimized to enhance the performance of the material.
Generally, the strategy used to control the porosity in these materials is the use of a sacrificial template to tune the meso- and macroporosity, with the addition of a carbonization treatment that increases the SSA value, thanks to the creation of micro- and small mesopores.1–9 Some efforts to produce N-doped carbon aerogels are also reported in the literature.10,11
Nitrogen is often already present in the starting material, though it can also be inserted in the carbon skeleton by an external source by a heat treatment in flowing ammonia12,13 or by chemical vapor deposition.14
The carbide derived carbon (CDC) technique is based on the selective removal of metal (or semimetal) atoms from a carbide. Usually the removal is performed via high temperature chlorination, producing volatile metal chloride and residual porous carbon. In this way the residual carbon possesses a micro–mesoporous structure that is related to the parent carbide phase. Depending on the etching temperature, the residual carbon can be present as amorphous, onion-like, nano-diamond, graphitic, etc.15 The carbon materials obtained by this route exhibit extremely high SSA values, thanks to the small micropores created by the removal of the metal atoms and the high volume of micropores formed.
Etching a polymer derived SiCN with chlorine was first performed by Yeon et al.16 The resulting carbon exhibited meso- and micropores and possessed a high specific surface area. However, no nitrogen was retained in the carbon network, probably due to the high etching temperature used. Recently J. K. Ewert et al.17 produced hierarchically porous N-doped CDC by using polystyrene nano-spheres as the templating agent and polysilazane precursor for SiCN. Interestingly, they reported a strong decrease of N content in the porous carbons obtained from 800 to 1000 °C. The meso–microporous N-doped carbons obtained showed promising electrochemical characteristics as supercapacitor electrodes.
In this work we produced a polysilazane aerogel which was subsequently pyrolyzed and chlorinated at different temperatures to obtain a carbonitride derived carbon aerogel. We show that the composition and the microstructure of the obtained CDCs are strongly related to the processing temperatures. Additionally, the studied CDCs have also been characterized for CO2 adsorption and as supercapacitor electrodes.
Experimental
Materials preparation
The starting polysilazane aerogels were produced following a published procedure.18 The nominal porosity was set at 70% vol and the cross-linking time to 20 h. In detail, 2.75 g of PSZ-20 (Kion Ceraset), 1.67 g of divinylbenzene (DVB, Sigma Aldrich, a mixture of isomers, 80%), and 8.25 g of cyclohexane (Alfa Aesar, HPLC grade) were mixed in a PFTE liner of a Parr digestion vessel (Parr Instrument). After 10 min of stirring, 10 μL of Karstedt's catalyst (2% Pt in xylene, Sigma Aldrich) were added and the solution was stirred for an additional 10 min. The PTFE cup was maintained closed during stirring and the exposure of the reactants to the atmosphere was as short as possible (a few seconds). After sealing with a screw cap the bomb was placed in a pre-heated oven set at 150 °C and left at that temperature for 20 h. Once extracted from the oven and let cool freely to room temperature, the vessel was opened and the gel removed as a monolith, and it was placed directly in a cyclohexane bath. The gel was washed with an excess amount of clean cyclohexane once a day for 3 days and was finally loaded in a home built CO2 supercritical drier. The drying schedule consisted of 2 solvent exchange (cyclohexane to CO2) steps per day for 5 days maintaining the temperature of the drier set at 15 °C. Supercritical drying was performed by heating the system to 45 °C (100 bar) in 2 h and depressurizing it at a rate lower than 1 bar min−1. With the exception of the sample pyrolyzed at 1200 °C, the pyrolysis and chlorination treatments were performed consecutively in the same furnace in order to avoid the exposure of the SiCN aerogels to the atmosphere. Indeed, we have recently shown that the exposure to the laboratory atmosphere of polymer derived ceramic aerogels pyrolyzed at intermediate temperatures (600–800 °C) may result in a strong oxidation of the materials with the formation of Si–OH and Si–O bonds.19 The tubular furnace used for the Cl2 etching unfortunately is limited to 1000 °C, and the sample 1200CDC had to be pyrolyzed in a different furnace equipped with an alumina tube. The polysilazane/DVB aerogel was cut, put in a quartz boat and placed in a horizontal tubular furnace (Gero RES-E 230/3) equipped with a fused quartz tube. A bubbler filled with NaOH aqueous solution was connected to the furnace outlet to deactivate unreacted Cl2 gas. The tube (inner volume of 0.5 L) was first flushed with argon (99.999% Ar, Air Liquide) for 1 h at a flow of 150 mL min−1. After the purging, the furnace was switched on and heated at a rate of 450 °C h−1 up to the pyrolysis/chlorination temperature. To perform chlorine etching, after one hour holding in argon flow (pyrolysis) the inlet gas was changed to a mixture of Cl2 (99.8% Cl2, Air Liquide, 80 mL min−1) and Ar (70 mL min−1), maintaining the same temperature. The etching time varied with the temperature, in detail, 450 °C (5 h), 600 °C (3 h), 800 °C (2 h), and 1000 °C (1 h). The efficiency of the etching reaction depends on the temperature, so longer lengths of time were used for samples etched at low temperature. After etching, the inlet gas was changed back to pure Ar and the temperature was set at 600 °C (with the exception of the 450CDC sample, in which the temperature was maintained constant to avoid further evolution of the material) and kept constant for 1 h. Then, the outlet tube was connected to a silicone oil bubbler and pure hydrogen (99.9% H2, Air Liquide) was connected to the gas inlet. The H2 flow was maintained for a period of time depending on the etching time, compatibly with laboratory schedules (details are reported in Table 1), and finally the furnace heating was turned off connecting back the inlet gas to Ar. This hydrogen treatment is used to remove residual chlorine and metal chlorides possibly present after the etching procedure.33 Black and light monolithic samples were extracted at room temperature and kept in glass vials with a tight plastic cap, opened only for characterization. For the sample pyrolyzed at 1200 °C, an alumina tubular furnace (Gero F-A-70-500/113) was used for the pyrolysis, and then the ceramic SiCN aerogel was etched at 1000 °C in the same quartz furnace as the other four samples with an identical schedule. Sample labels are summarized in Table 1.| Pyrolysis | Cl2 etching | H2 treatment | |
|---|---|---|---|
| 450CDC | 450 °C – 1 h | 450 °C – 5 h | 450 °C – 3 h |
| 600CDC | 600 °C – 1 h | 600 °C – 3 h | 600 °C – 3 h |
| 800CDC | 800 °C – 1 h | 800 °C – 2 h | 600 °C – 2 h |
| 1000CDC | 1000 °C – 1 h | 1000 °C – 1 h | 600 °C – 1 h |
| 1200CDC | 1200 °C – 1 h | 1000 °C – 1 h | 600 °C – 1 h |
Characterization
Electrode preparation for supercapacitors
To prepare the electrodes for supercapacitors, N-doped CDC materials were first mixed with a polytetrafluoroethylene (PTFE) binder and conductive carbon black, resulting in a 85![[thin space (1/6-em)]](https://www.rsc.org/images/entities/char_2009.gif) :
:![[thin space (1/6-em)]](https://www.rsc.org/images/entities/char_2009.gif) 5
5![[thin space (1/6-em)]](https://www.rsc.org/images/entities/char_2009.gif) :
:![[thin space (1/6-em)]](https://www.rsc.org/images/entities/char_2009.gif) 10 (by weight) active material
10 (by weight) active material![[thin space (1/6-em)]](https://www.rsc.org/images/entities/char_2009.gif) :
:![[thin space (1/6-em)]](https://www.rsc.org/images/entities/char_2009.gif) PTFE
PTFE![[thin space (1/6-em)]](https://www.rsc.org/images/entities/char_2009.gif) :
:![[thin space (1/6-em)]](https://www.rsc.org/images/entities/char_2009.gif) carbon black mixture. The mixture was ground extensively at 120 °C until the formation of a paste like slurry, which was rolled into a film with a thickness of around 100 μm, and cut into disk shape electrodes (with diameter of 1.0 cm) that were dried in a vacuum oven at 120 °C overnight. Each electrode comprised about 3 mg of active material. Two electrodes of the same material were assembled in a symmetrical configuration, separated by a Macherey-Nagel MN 85/70 glass fiber soaked with an aqueous electrolyte (1.0 M H2SO4), and assembled in a Swagelok-type test cell.
carbon black mixture. The mixture was ground extensively at 120 °C until the formation of a paste like slurry, which was rolled into a film with a thickness of around 100 μm, and cut into disk shape electrodes (with diameter of 1.0 cm) that were dried in a vacuum oven at 120 °C overnight. Each electrode comprised about 3 mg of active material. Two electrodes of the same material were assembled in a symmetrical configuration, separated by a Macherey-Nagel MN 85/70 glass fiber soaked with an aqueous electrolyte (1.0 M H2SO4), and assembled in a Swagelok-type test cell.
Electrochemical tests
All the electrochemical measurements were carried out using an Ivium Stat electrochemical interface & impedance analyzer (Ivium Technologies, Netherlands). The cyclic voltammetry (CV) was performed in the range of −1.0 to +1.0 V, while galvanostatic charge–discharge experiments were performed in the range of 0 to 1.0 V at current densities of 1, 10 and 20 A g−1. All electrochemical tests were carried out at room temperature (22 °C). To calculate the capacitance at each potential scan rate from the CV curve, 20 cycles were measured. The differential specific capacitance of CV plots at different scan rates is calculated according to the equation:where Cspecdiff is the differential specific capacitance (F g−1) based on the mass of the electroactive material of a single electrode, Ispec is the specific response current density (A g−1) at every applied potential step, and ν is the potential scan rate (mV s−1). The integral specific capacitance is calculated according to the equation:
where Cspec is the integral specific capacitance (F g−1) based on the mass of the electroactive material of a single electrode, ν is the potential scan rate (mV s−1) and Ispec is the specific response current density (A g−1) integrated over the applied potential window (V2 − V1). For the calculation based on galvanostatic charge–discharge curves, the specific capacitance was calculated according to the equation:
where dV/dt is the slope of the discharge curve (V s−1).
Results and discussion
The production of the polysilazane/divinylbenzene aerogels and their conversion to SiCN/C aerogels by means of pyrolysis have already been discussed extensively in previous papers.18,19 These materials show a meso–macroporous structure, with typical microstructural features of colloidal gels and a relatively high SSA and pore volume.Structural characterization by DRIFT
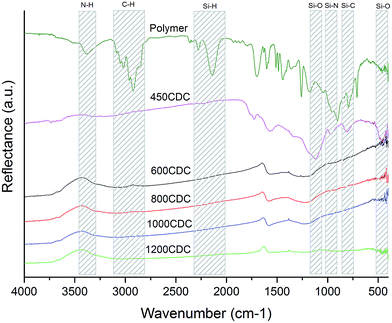
The DRIFT spectra recorded for the samples after chlorination are shown in Fig. 1. The DRIFT spectrum of the sample 450CDC shows the disappearance of all the peaks related to N–H (3380 cm−1), C–H (3085–2850 cm−1), and Si–H (2280–2140 cm−1) bonds. In contrast, peaks related to Si–O (1120–470 cm−1), Si–N (970 cm−1) and Si–C (810 cm−1) bonds are still present, indicating that the Cl2 etching of this sample, pyrolyzed in Ar at 450 °C, was not complete and for this reason no further efforts to characterize this sample were performed. From 600 °C and up to 1200 °C, Si was successfully removed and the FTIR spectra do not show absorption peaks related to chemical bonds involving Si atoms. The DRIFT spectra of the samples pyrolyzed and etched at 600, 800 and 1000 °C show very similar appearance, with two broad peaks centered at 1600 and 1215 cm−1. The two peaks are related to aromatic C bonds (1600 cm−1)20 and to the superimposition of various C–N and C–O bonds (1215 cm−1): indeed the absorption at 1215 cm−1 has been already reported for N-doped carbons.21 In the 1200CDC sample these two peaks are hardly observable, suggesting an ordering of the sp2 carbon to form properly graphitic planes with the loss of N. It is worth noticing that the properly etched samples (from 600CDC to 1200CDC) are very black, this gives an extra effect on the spectrum, masking the KBr background signal and giving rise to the peaks at OH frequencies, coming from the small amount of adsorbed moisture on the KBr (1630, 3450 cm−1). This effect has been observed with the same instrument also on other CDCs obtained from SiC and composed of pure carbon; we were then led to think that it is not a signal related to the sample composition but an instrumental effect. We preferred not to correct this effect since it could be helpful to other authors to interpret DRIFT spectra of the very black material correctly.Thermal analysis characterization
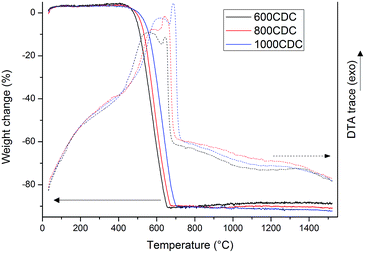
TGA curves recorded in air flow for the samples chlorinated at 600, 800 and 1000 °C are shown in Fig. 2. These samples show a nearly complete mass loss in the range of 400–700 °C, suggesting that they are mainly composed of C with no, or very low, amount of residual silicon. Only the sample obtained at the lowest chlorination temperature, 600CDC, shows an extremely small mass increase above 800 °C, possibly related to traces of residual silicon eventually present as SiC which, upon oxidation, leads to a mass increase.Interestingly, the DTA traces show, in the temperature range where the C oxidation occurs, two distinct peaks, one broader at lower temperature and one sharper at higher temperature. This could be related to the presence, in the CDCs, of different forms of carbons showing different oxidation rates. In particular, the DTA peak at lower temperature could be related to disordered and substituted carbon, which reacts with oxygen at lower temperature, while the second peak was associated with more graphitic carbon that needs higher temperature to be fully oxidized. Indeed, it has been already reported in the literature that the higher the etching temperature the more ordered15 and so more stable against oxidation1 are the carbon structures obtained.
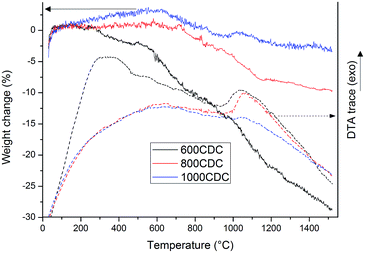
Fig. 3 reports the TGA and DTA curves recorded in an inert atmosphere (Ar flow) for the CDCs chlorinated at 600, 800 and 1000 °C. Thermogravimetry performed under argon flow clearly reveals the different stabilities of the materials obtained at different etching temperatures. The sample 600CDC starts losing weight from 300 °C, reaching a mass loss value of 28% at 1500 °C. The first mass loss is attributed to the release of compounds containing Cl, whose presence was confirmed by XPS analysis as will be shown later on. The other two samples, 800CDC and 1000CDC are stable up to 700 °C then suffer a mass loss up to 1100 °C, more pronounced for the case of 800CDC. The mass loss in this range, 800–1100 °C, is thought to be due to the evolution of nitrogen which is known be released from N-doped carbons in this temperature range.22
The DTA traces of the 600CDC and 800CDC show exothermic peaks at 1050 °C. We think that these exothermic peaks could be due to the onset of graphitization of carbon since the observed temperature is very close to the one reported in the literature for the transition from disordered to graphitic C in CDC materials15 as well as the temperature for the transition from sp3 to sp2 C of diamond like carbon films.23 It is worth remembering that C atoms in the SiCN aerogels before chlorination are bonded to Si in sp3 hybridization and this configuration could be partially maintained also in the chlorinated materials, provided that the chlorination temperature is not high enough to allow the relaxation toward the more stable sp2 hybridization. Indeed, Gogotsi found nanodiamonds in low temperature synthesized CDC materials.15
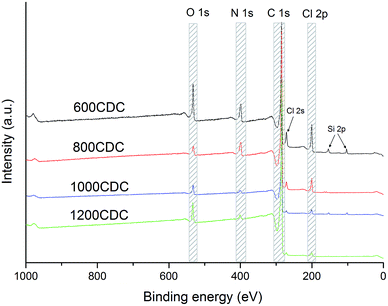
Structural characterization by XPS
XPS survey scans recorded on the chlorinated samples are shown in Fig. 4. Interestingly, the XPS analysis confirmed the presence of N in the CDC aerogel, demonstrating the possibility to produce N-doped CDCs starting from amorphous polymer-derived silicon carbonitride aerogels. These results are in agreement with those recently reported by Ewert et al.17 obtained through chlorination of SiCN produced starting from a similar polysilazane.The chemical compositions calculated from the XPS spectra are shown in Table 2. It can be seen that residual Cl is still present in the material even if an H2 treatment was performed, however, its amount decreases by increasing the processing temperature. Some oxygen is also present, possibly coming from C![[double bond, length as m-dash]](https://www.rsc.org/images/entities/char_e001.gif) O groups formed by the reaction of the polysilazane with CO2 during the aerogel synthesis.18 Silicon was nearly completely removed by chlorination. The highest amounts (2 at%) were found in the 600CDC sample, due to the slow kinetics of the etching at this temperature, and in the 1000CDC (1.2 at%) probably due to the short etching time. The nitrogen amount decreases with the etching temperature, showing a strong loss between 800 and 1000 °C (as expected from17,22), which affects the thermal stability as shown by the thermogravimetric study performed in Ar flow.
O groups formed by the reaction of the polysilazane with CO2 during the aerogel synthesis.18 Silicon was nearly completely removed by chlorination. The highest amounts (2 at%) were found in the 600CDC sample, due to the slow kinetics of the etching at this temperature, and in the 1000CDC (1.2 at%) probably due to the short etching time. The nitrogen amount decreases with the etching temperature, showing a strong loss between 800 and 1000 °C (as expected from17,22), which affects the thermal stability as shown by the thermogravimetric study performed in Ar flow.
| % at | O | N | C | Cl | Si |
|---|---|---|---|---|---|
| 600CDC | 7.9 | 9.7 | 75.0 | 5.5 | 2.0 |
| 800CDC | 2.3 | 6.7 | 88.3 | 2.6 | 0.1 |
| 1000CDC | 3.7 | 2.5 | 91.2 | 1.5 | 1.2 |
| 1200CDC | 3.8 | 2.0 | 93.1 | 0.9 | 0.2 |
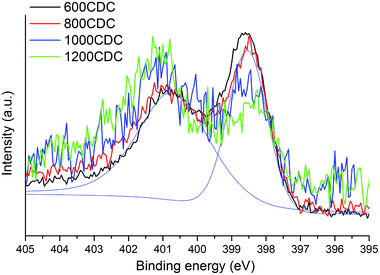
N 1s core level spectra allow us to get a better insight into the local chemical environment of the nitrogen atoms. The spectra, shown in Fig. 5, show two components, one at 398.5 eV which is assigned to N atoms bonded to sp2 C atoms in pyridinic sites and another one at 400.8 eV due to N atoms bonded to sp2 C atoms in quaternary (graphitic) sites. The intensity ratio of these two components varies with the processing temperature: at the lowest temperature (600 °C) the pyridinic sites at 398.5 eV are abundant while at the highest temperature (1200 °C) N is present mostly in quaternary environments (components at 400.8 eV). In more detail, the evolution of the two N sites can be evaluated by fitting the XPS spectra with the two components.
Accordingly, for the 600CDC and 800CDC samples the ratio between the pyridinic and the quaternary components is equal to 0.74; at 1000 °C the intensity of the pyridinic groups is strongly diminished (0.34), and the pyridinic/quaternary ratio reaches a minimum of 0.23 at 1200 °C. Recalling that, by increasing the processing temperature, the total amount of nitrogen in the CDC materials decreases, we can conclude that nitrogen is preferentially lost from the pyridinic sites compared to the quaternary ones. These results are in agreement with what has been already reported in the literature.17,22 Pyrrolic or other functionalities that involve N–H presence are thought not to be present due to the lack of related peaks in the IR-spectra.
Microstructural characterization
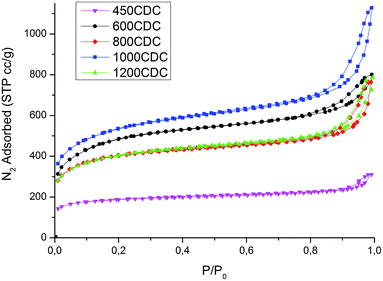
The microstructure of the materials produced was analyzed using SEM and N2 physisorption analysis. The N2 isotherms, presented in Fig. 6, indicate a hierarchical porosity for all the samples, with a high amount of micropores connected to mesopores, as shown in Table 3.| Sample | SSA, m2 g−1 | μ-PV, cm3 g−1 | m-PV, cm3 g−1 | CO2@1 bar, 0 °C (mmol g−1) |
|---|---|---|---|---|
| 450CDC | 706 | 0.22 | 0.21 | n.m. |
| 600CDC | 1724 | 0.48 | 0.64 | 3.97 |
| 800CDC | 1468 | 0.44 | 0.59 | 4.36 |
| 1000CDC | 1887 | 0.54 | 0.97 | 4.67 |
| 1200CDC | 1473 | 0.43 | 0.61 | 4.01 |
Very high values of SSA are obtained for the properly etched materials, while for the 450CDC sample only a moderate specific area is obtained. In particular, the SSA in the 450CDC material is not formed by the Si removal but is mainly due to the aerogel structure and transient pore formation during polymer to ceramic transformation, see ref. 19. Cumulative pore size distributions, presented in Fig. 7, reveal very similar pore volume below 0.8 nm, which is thought to be the critical dimension for adsorption of CO2 under STP conditions. The trend of pore volume and SSA values, summarized in Table 3, is not monotonic, and shows two local maxima at 600 and 1000 °C. These results could be rationalized thinking that during the pyrolysis treatment some pores could be consumed by a viscous sintering process. This leads to a reduced pore volume already before the etching procedure and explains the decreased values from 600 to 800 °C. At 1000 °C the viscosity increases24 limiting this effect. At the same time the increased skeleton density leads to the formation of smaller pores25 while the evolution of nitrogen increases the total pore volume. This combination of smaller pore size and higher pore volume explains the increase in the SSA value from 800 to 1000 °C. At 1200 °C, Si3N4 domains are formed, leading to larger pores after etching16 and reducing the microporosity and the SSA value. This increase in the size of the pores produced by the etching enlarges the mesopores of the aerogel structure, bringing part of them out of the measurable range with the nitrogen physisorption technique; explaining the lower pore volume measured for the 1200CDC sample.
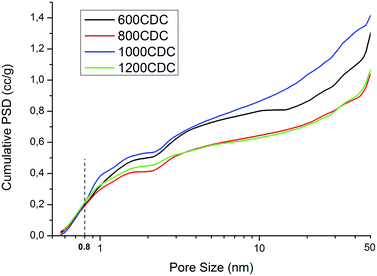 | ||
| Fig. 7 Cumulative pore size distribution obtained by applying QSDFT kernel to low pressure N2 adsorption and assuming slit/cylindrical pores. | ||
FE-SEM micrographs are presented in Fig. 8. The images show the typical colloidal structure of aerogels, with a skeleton built up by many small spherical particles. The presence of macro- and large mesopores typical of the aerogel structure is evident, while the micropores and the small mesopores formed by the chlorine etching are out of the resolution of the equipment used. The visible microstructure appears very similar among the samples, showing the stability of the bigger pores vs. temperature. It is possible to observe a slight increase of the particle dimension with increasing temperature, mainly between 800 and 1000 °C.
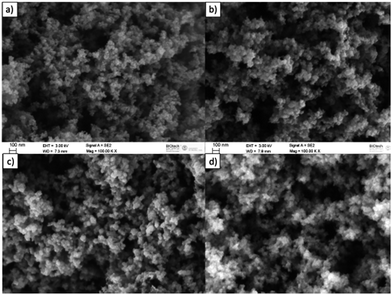 | ||
| Fig. 8 FE-SEM micrographs of the microstructure of the N-doped CDC aerogels. (a) 600CDC, (b) 800CDC, (c) 1000CDC, and (d) 1200CDC. | ||
CO2 adsorption
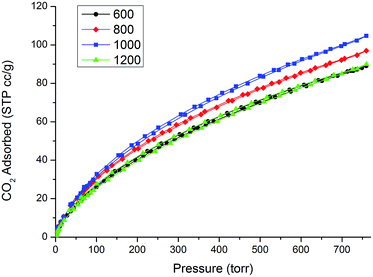
The CO2 physisorption isotherms measured at 0 °C are shown in Fig. 9, showing completely reversible adsorption of CO2 and a remarkable total amount of CO2 adsorbed. Nitrogen doping of carbon is thought to be a possible way to increase the performance of carbonaceous porous materials in CO2 sequestration.26 This concept relies on the beneficial interaction between acidic CO2 gas and basic N on the surface of the carbon material. By varying the etching temperature we measured a strong change in the amount of nitrogen present in the N-CDC aerogels and also the type of nitrogen functionalities present. Anyway, in our case, this change in the composition does not seem to reflect in strongly different behavior with respect to CO2 absorption. This could be due to the fact that, as seen with XPS analysis, most of the nitrogen is present as Q units and only a part of it is present as moderately basic pyridine groups. This low basicity enhances the role of the ultramicropore volume (i.e. pores with diameter <0.8 nm) for CO2 adsorption. The critical dimension of 0.8 nm has already been deeply investigated27–29 and our results seem to fit well with the already reported ratio between CO2 adsorbed (at 1 atm and 0 °C) and the volume of pores <0.8 nm for other microporous carbons. In this regard, the comparison with already reported CO2 adsorption for a nitrogen-free CDC aerogel obtained from SiC,25 which shows very similar values, is particularly enlightening. The total amount of CO2 adsorbed expressed in mmol g−1 is reported in Table 3 for a better comparison with the literature.EDLC electrodes
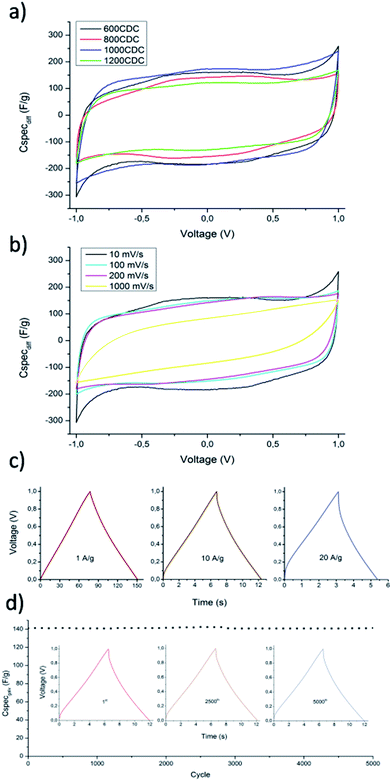
The hierarchical porous structure of N-CDC aerogels can help the fast diffusion of the electrolyte ions, increasing the performance at a high charge–discharge rate. Additionally, nitrogen containing functional groups can initiate some reverse redox reactions with the ions of the electrolyte, giving rise to pseudocapacitance and increasing the overall capacitance. Due to these chemical interactions, the importance of a suitable electrolyte is enhanced as studied in ref. 17. In this work anyway, to better compare the results obtained with those reported in the literature for similar CDC materials,30,31 we used 1.0 M aqueous H2SO4 as the electrolyte. The CV curves obtained at a scan rate of 10 mV s−1 and using the produced N-CDC aerogels as electrodes are shown in Fig. 10a.The curves clearly reveal the pseudocapacitive behavior of the N-CDC aerogels produced at 600 and 800 °C as a result of the higher quantity of doping atoms in these two materials. The calculated specific capacities of the four materials tested at 10 mV s−1 are summarized in Table 4. The specific capacity normalized on the area of the material as measured based on BET theory is also report. This last value can depend on the pore dimension but also on the chemistry of the surface.32 In our case we noticed a nearly constant value up to 1200 °C, where the value dropped from 8.8 to 7.9 μF cm−2, probably as an effect of the increased micropore size in addition to a much lower N content.
| Capacity | 600CDC | 800CDC | 1000CDC | 1200CDC |
|---|---|---|---|---|
| F g−1 | 152 | 129 | 164 | 116 |
| μF cm−2 | 8.8 | 8.8 | 8.7 | 7.9 |
The 600CDC sample was investigated more in detail since it is the first CDC material produced from SiCN at such a low temperature. The CV curves obtained at increasing scan rates are presented in Fig. 10b. It is possible to notice the effect of pseudocapacitance up to a rate of 200 mV s−1, while at 1000 mV s−1 the shape of the curve becomes typical of a capacitor with some internal resistance, with the total capacity decreasing to 70 F g−1. The macro–mesoporous structure of the aerogel helps to maintain high values of capacity even at a scan rate as high as 200 mV s−1, by providing transport pores that allow easy access of the ions to the active surface.
The stability of the capacity with increasing rate is also evaluated for the 600CDC material by galvanostatic charge/discharge measurements with different current densities. From the curves obtained, and shown in Fig. 10c, it is possible to calculate the capacity at constant current discharge (reported in Table 5). Also the results obtained by galvanostatic measurements indicate a good capacity retention even at high current density, with just a moderate IR drop at the highest current tested.
| Capacity 600CDC | 1 A g−1 | 10 A g−1 | 20 A g−1 |
|---|---|---|---|
| F g−1 | 165 | 140 | 123 |
The stability of the capacitance of the material produced at 600 °C was evaluated by charging/discharging the EDCL produced with the N-CDC aerogel for 5000 times with a current density of 10 A g−1 (Fig. 10d). The charge/discharge curves of the 1st, 2500th and 5000th cycle are highlighted in Fig. 10d (inset). As shown, there is almost no change after 5000 cycles at high current density. The excellent cycling stability, which is a fundamental requirement for a candidate material to be used in real capacitors, was also followed up to 10![[thin space (1/6-em)]](https://www.rsc.org/images/entities/char_2009.gif) 000 cycles, with a capacitance retention higher than 99%.
000 cycles, with a capacitance retention higher than 99%.
Conclusion
A series of N-CDC aerogels were produced by pyrolyzing and chlorinating a polysilazane/DVB aerogel at different temperatures. The obtained materials exhibit a high surface area and hierarchical porous structure. The etching was successful even at temperatures as low as 600 °C. The porous carbons produced retain some nitrogen from the starting SiCN precursors, along with some oxygen and residual chlorine in the case of the low temperature treatment. The nitrogen content decreases with increasing synthesis temperature, and in particular we showed a preferential loss of pyridinic nitrogen with respect to quaternary nitrogen. The thermal stability of the produced materials, both in air and in argon, was also demonstrated to be affected by the synthesis temperature. Interestingly, the amount of CO2 adsorbed (3.96–4.67 mmol g−1) does not appear to be significantly influenced by the composition of the skeleton, probably due to the low basicity of the nitrogen present in the material. On the other side, a strong influence of the nitrogen amount was seen on the CV curves obtained using the CDC aerogels as the electrode in an EDCL configuration. A higher nitrogen amount reflected in increased pseudocapacitance for the samples produced at low temperature. The capacity of the aerogel with the highest nitrogen amount was proved to be stable even at a relatively high charge/discharge current (10 A g−1) for 5000 cycles, with no appreciable aging and a value of 140 F g−1.Acknowledgements
This work was performed in the frame of the European COST action MP1202 “Rational design of hybrid organic–inorganic interfaces: the next step towards advanced functional material”.Notes and references
- H. Chen, F. Sun, J. Wang, W. Li, W. Qiao, L. Ling and D. Long, Nitrogen doping effects on the physical and chemical properties of mesoporous carbons, J. Phys. Chem. C, 2013, 117(16), 8318–8328 CAS.
- W. Shen and W. Fan, Nitrogen-containing porous carbons: synthesis and application, J. Mater. Chem. A, 2013, 1(4), 999–1013 CAS.
- Y. Shao, J. Sui, G. Yin and Y. Gao, Nitrogen-doped carbon nanostructures and their composites as catalytic materials for proton exchange membrane fuel cell, Appl. Catal., B, 2008, 79(1), 89–99 CrossRef CAS.
- Z. Yang, H. Nie, X. A. Chen, X. Chen and S. Huang, Recent progress in doped carbon nanomaterials as effective cathode catalysts for fuel cell oxygen reduction reaction, J. Power Sources, 2013, 236, 238–249 CrossRef CAS.
- S. Majeed, J. Zhao, L. Zhang, S. Anjum, Z. Liu and G. Xu, Synthesis and electrochemical applications of nitrogen-doped carbon nanomaterials, Nanotechnol. Rev., 2013, 2(6), 615–635 CAS.
- K. N. Wood, R. O'Hayre and S. Pylypenko, Recent progress on nitrogen/carbon structures designed for use in energy and sustainability applications, Energy Environ. Sci., 2014, 7(4), 1212–1249 CAS.
- P. Trogadas, T. F. Fuller and P. Strasser, Carbon as catalyst and support for electrochemical energy conversion, Carbon, 2014, 75, 5–42 CrossRef CAS.
- Y. Gong, M. Li and Y. Wang, Carbon Nitride in Energy Conversion and Storage: Recent Advances and Future Prospects, ChemSusChem, 2015, 8(6), 931–946 CrossRef CAS PubMed.
- H. Wang, T. Maiyalagan and X. Wang, Review on recent progress in nitrogen-doped graphene: synthesis, characterization, and its potential applications, ACS Catal., 2012, 2(5), 781–794 CrossRef CAS.
- R. J. White, N. Yoshizawa, M. Antonietti and M. M. Titirici, A sustainable synthesis of nitrogen-doped carbon aerogels, Green Chem., 2011, 13(9), 2428–2434 RSC.
- N. Brun, S. A. Wohlgemuth, P. Osiceanu and M. M. Titirici, Original design of nitrogen-doped carbon aerogels from sustainable precursors: application as metal-free oxygen reduction catalysts, Green Chem., 2013, 15(9), 2514–2524 RSC.
- P. Veselá and V. Slovák, N-doped carbon xerogels prepared by ammonia assisted pyrolysis: surface characterisation, thermal properties and adsorption ability for heavy metal ions, J. Anal. Appl. Pyrolysis, 2014, 109, 266–271 CrossRef.
- C. Pevida, M. G. Plaza, B. Arias, J. Fermoso, F. Rubiera and J. J. Pis, Surface modification of activated carbons for CO2 capture, Appl. Surf. Sci., 2008, 254(22), 7165–7172 CrossRef CAS.
- Y. Xia, R. Mokaya, G. S. Walker and Y. Zhu, Superior CO2 Adsorption Capacity on N-doped, High-Surface-Area, Microporous Carbons Templated from Zeolite, Adv. Energy Mater., 2011, 1(4), 678–683 CrossRef CAS.
- V. Presser, M. Heon and Y. Gogotsi, Carbide-Derived Carbons – From Porous Networks to Nanotubes and Graphene, Adv. Funct. Mater., 2011, 21(5), 810–833 CrossRef CAS.
- S. H. Yeon, P. Reddington, Y. Gogotsi, J. E. Fischer, C. Vakifahmetoglu and P. Colombo, Carbide-derived-carbons with hierarchical porosity from a preceramic polymer, Carbon, 2010, 48(1), 201–210 CrossRef CAS.
- J. K. Ewert, D. Weingarth, C. Denner, M. Friedrich, M. Zeiger, A. Schreiber and R. Kempe, Enhanced capacitance of nitrogen-doped hierarchically porous carbide-derived carbon in matched ionic liquids, J. Mater. Chem. A, 2015, 3(37), 18906–18912 CAS.
- V. L. Nguyen, E. Zera, A. Perolo, R. Campostrini, W. Li and G. D. Sorarù, Synthesis and characterization of polymer-derived SiCN aerogel, J. Eur. Ceram. Soc., 2015, 35(12), 3295–3302 CrossRef CAS.
- E. Zera, W. Nickel, S. Kaskel and G. D. Sorarù, Out-of-furnace oxidation of SiCN polymer-derived ceramic aerogel pyrolyzed at intermediate temperature (600–800 °C), J. Eur. Ceram. Soc., 2015, 36(3), 423–428 CrossRef.
- G. Socrates, Infrared and Raman Characteristic Group Frequencies: Tables and Charts, John Wiley & Sons, 2004 Search PubMed.
- H. Peng, Z. Mo, S. Liao, H. Liang, L. Yang, F. Luo and B. Zhang, High performance Fe- and N-doped carbon catalyst with graphene structure for oxygen reduction, Sci. Rep., 2013, 3, 1765 Search PubMed.
- S. Zhang, S. Tsuzuki, K. Ueno, K. Dokko and M. Watanabe, Upper Limit of Nitrogen Content in Carbon Materials, Angew. Chem., Int. Ed., 2015, 54(4), 1302–1306 CrossRef CAS PubMed.
- J. Robertson, Diamond-like amorphous carbon, Materials Science and Engineering: R: Reports, 2002, 37(4), 129–281 CrossRef , pg 208–209.
- P. E. Sánchez-Jiménez, J. A. Downs and R. Raj, Transient Viscous Flow During the Evolution of a Ceramic (Silicon Carbonitride) from a Polymer (Polysilazane), J. Am. Ceram. Soc., 2010, 93(9), 2567–2570 CrossRef.
- M. Oschatz, W. Nickel, M. Thommes, K. A. Cychosz, M. Leistner, M. Adam and S. Kaskel, Evolution of porosity in carbide-derived carbon aerogels, J. Mater. Chem. A, 2014, 2(43), 18472–18479 CAS.
- Developments and Innovation in Carbon Dioxide (CO2) Capture and Storage Technology: Carbon Dioxide (CO2) Storage and Utilisation, ed. M. M. Maroto-Valer, Elsevier, 2010, vol. 2, ch. 6.3 Search PubMed.
- V. Presser, J. McDonough, S. H. Yeon and Y. Gogotsi, Effect of pore size on carbon dioxide sorption by carbide derived carbon, Energy Environ. Sci., 2011, 4(8), 3059–3066 CAS.
- Z. Zhang, J. Zhou, W. Xing, Q. Xue, Z. Yan, S. Zhuo and S. Z. Qiao, Critical role of small micropores in high CO2 uptake, Phys. Chem. Chem. Phys., 2013, 15(7), 2523–2529 RSC.
- M. Sevilla, J. B. Parra and A. B. Fuertes, Assessment of the role of micropore size and N-doping in CO2 capture by porous carbons, ACS Appl. Mater. Interfaces, 2013, 5(13), 6360–6368 CAS.
- M. Rose, Y. Korenblit, E. Kockrick, L. Borchardt, M. Oschatz, S. Kaskel and G. Yushin, Hierarchical Micro-and Mesoporous Carbide-Derived Carbon as a High-Performance Electrode Material in Supercapacitors, Small, 2011, 7(8), 1108–1117 CrossRef CAS PubMed.
- M. Oschatz, L. Borchardt, K. Pinkert, S. Thieme, M. R. Lohe, C. Hoffmann and S. Kaskel, Hierarchical Carbide-Derived Carbon Foams with Advanced Mesostructure as a Versatile Electrochemical Energy-Storage Material, Adv. Energy Mater., 2014, 4(2), 1300645 Search PubMed.
- P. Simon and Y. Gogotsi, Materials for electrochemical capacitors, Nat. Mater., 2008, 7(11), 845–854 CrossRef CAS PubMed.
- C. Portet, D. Kazachkin, S. Osswald, Y. Gogotsi and E. Borguet, Impact of synthesis conditions on surface chemistry and structure of carbide-derived carbons, Thermochim. Acta, 2010, 497(1), 137–142 CrossRef CAS.
| This journal is © The Royal Society of Chemistry 2016 |


