 Open Access Article
Hydrogen treated anatase TiO2: a new experimental approach and further insights from theory†
Manan
Mehta
af,
Nisha
Kodan
b,
Sandeeep
Kumar
c,
Akshey
Kaushal
b,
Leonhard
Mayrhofer
de,
Michael
Walter
de,
Michael
Moseler
de,
Avishek
Dey
f,
Satheesh
Krishnamurthy
f,
Suddhasatwa
Basu
*a and
Aadesh P.
Singh
*b
aDepartment of Chemical Engineering, Indian Institute of Technology, HauzKhas, New Delhi-110016, India. E-mail: sbasu@iitd.ac.in; Fax: +91 11 26581120; Tel: +91 11 26591035
bDepartment of Physics, Indian Institute of Technology, Hauz Khas, New Delhi-110016, India. E-mail: aadshp1982@gmail.com
cDepartment of Chemistry, Indian Institute of Technology, Hauz Khas, New Delhi-110016, India
dFraunhofer IWM, Wöhlerstr. 11, D-79108 Freiburg, Germany
eUniversity of Freiburg, FMF - Freiburg Materials Research Center, Stefan-Meier-Str. 21, D-79104 Freiburg, Germany
fDepartment of Engineering and Innovation, The Open University, Milton Keynes, MK7 6AA, UK
First published on 18th January 2016
Abstract
Hydrogenated TiO2 (H:TiO2) is intensively investigated due to its improvement in solar absorption, but there are major issues related to its structural, optical and electronic properties and therefore an easily compatible method of preparation is much needed. In order to clarify this issue we studied TiO2 nanocrystals under the partial pressure of hydrogen to modify the structural, optical and electrical properties and to significantly improve the photocatalytic and photoelectrochemical performance. The hydrogen treated TiO2 nanocrystals contained paramagnetic Ti3+ centers and exhibited a higher visible light absorption cross-section as was confirmed by electron paramagnetic resonance diffuse reflectance spectra measurements and X-ray photoelectron spectroscopy. The hydrogen annealed samples showed a noticeable improvement in photocatalytic activity under visible light (λ > 380 nm) which was demonstrated by the degradation of methylene blue dye and an improved photoelectrochemical response in terms of high photocurrent density. Ab initio simulations of TiO2 were performed in order to elucidate the conditions under which localized Ti3+ centres rather than delocalized shallow donor states are created upon the reduction of TiO2. Randomly distributed oxygen vacancies lead to localized deep donor states while the occupation of the oxygen vacancies by atomic hydrogen favours the delocalized shallow donor solution. Furthermore, it was found that localization is stabilized at high defect concentrations and destabilized under external pressures. In those cases where localized Ti3+ states are present, the DFT simulations showed a considerable enhancement of the visible light absorption as well as a pronounced broadening of the localized Ti3+ energy levels with increasing defect concentration.
1. Introduction
Nanosized titanium dioxide (TiO2) in the anatase phase has been extensively used in solar driven photocatalytic processes for hydrogen production and water decontamination.1–3 However, its large bandgap (∼3.2 eV) requires light below 388 nm to create an electron–hole pair and limits the overall efficiency. Therefore, in order to increase absorption of TiO2 for natural solar radiation, a variety of techniques have been reported such as metal ion doping,4,5 anion doping,6,7 noble metal loading,8,9 addition of electron donors,10 metal ion-implantation11 and self-doping that produce Ti3+ species12etc. At present, anion-doped TiO2 (especially nitrogen doping in TiO2) exhibits the greatest optical response to the visible region, due to its modified electronic transition from the dopant 2p orbitals to the Ti3d orbitals which is responsible for the visible light absorption. However, N-doped TiO2 still has no sufficient absorption in the visible region.6Over the past few years hydrogen induced modification in metal oxide semiconductors has been of substantial interest due to their higher photocatalytic performance. Hydrogen treatment techniques play a key role in tailoring the optical and electronic properties of metal oxide thin films and nanoparticles. Various hydrogen treatment processes such as high pressure hydrogen annealing,13,14 electrochemical hydrogenation15,16 and hydrogen plasma17,18 for making black metal oxide nanoparticles and thin films have been used to modify the optical, electrical and photocatalytic properties. Different hydrogen treatment processes lead to different properties of the hydrogen modified TiO2 materials. Chen et al. reported that TiO2 nanocrystals treated in a hydrogen atmosphere under a 20 bar H2 atmosphere for 5 days showed a colour change to black with a reduction in the bandgap energy up to ∼1.54 eV.13,14 They have reported that the change in colour is due to the surface disorder of TiO2 nanoparticles. The colour change in the metal oxide due to hydrogen depends upon the hydrogen treatment temperature, the partial pressure and also on the nature of hydrogen species, while in the work of Chen et al.13 the narrowing of the band gap could be traced back to the surface disorder without the formation of Ti3+ centres; other studies12 found strong evidence that lattice defects such as oxygen vacancies can form localized Ti3+ centres within the TiO2 bandgap. Moreover, in the work of Wang et al.17 hydrogen doping created a high density of delocalized Ti3d electrons leading to improved charge transport properties.
Different hydrogen treatment processes lead to different properties of the hydrogen modified TiO2 materials. Hydrogen annealing of TiO2 under high pressure did not show any detectable Ti3+ states, but, produces disordered surface layers over the crystalline TiO2 particles forming a core–shell structure.13 Reduction of TiO2 particles in a H2 atmosphere at 500 °C shows the formation of a crystalline core/amorphous shell (TiO2@TiO2−xHx) structure with about 83% absorption of solar light.17 Hydrogen plasma treatment in TiO2 nanotubes has been observed to result in simultaneously incorporated Ti3+ and –OH groups.19 Hydrogen plasma treated ALD grown TiO2 thin films also show the formation of Ti3+ states.20 Electrochemical H+ doping in TiO2 films also exhibits the presence of Ti3+ and –OH that may lead to additional electronic states in the band gap and shift light absorption to the visible region.18 Different hydroxyl groups present on TiO2 surfaces are supposed to participate in electron trapping in TiO2 and other oxides.21 Reduction of TiO2 and –OH group formation has also been reported in theoretical hybrid density functional (B3LYP) based studies on hydrogen doping in TiO2.19,22
Although, encouraging results on hydrogen treated TiO2 have been obtained,13,14 a detailed understanding of the role of hydrogen species (e.g. atomic, molecular or ionic hydrogen) and an easily scalable process to tailor the required hydrogen and to modify the structural, electronic energy band structure of TiO2 to realize the improvements in photocatalytic properties is of utmost importance.
Therefore, in this work we used 5% H2 in Ar to modify optical absorption by creating defect/disordered states in the TiO2 lattice and studied photocatalytic degradation of methylene blue to be used in photoelectrochemical water splitting applications. This is the new experimental approach to tailor the optical, electrical and photocatalytic properties of TiO2 in a controlled way. The hydrogen treated brownish TiO2 nanoparticles with long-wavelength absorption showed much better performance in photocatalytic decomposition of methylene blue and phenol than pure TiO2 nanocrystals. In our hydrogen treated TiO2 samples, localized Ti3+ centres were identified, which explain the origin of the modified electronic structure. In order to further elucidate the conditions under which localized Ti3+ states rather than delocalized shallow donor states are formed upon hydrogen treatment, ab initio calculations within the density functional theory (DFT) of TiO2 with varying concentrations of oxygen vacancies and oxygen vacancies occupied by atomic hydrogen were performed.
2. Experimental procedures
2.1 Synthesis of TiO2 nanoparticles
Pristine TiO2 nanocrystals were prepared by a wet chemical method using titanium tetra-isopropoxide, ethanol, hydrochloric acid and deionized water as reported earlier.23 In brief, 25 mL deionized water mixed with 1 mL hydrochloric acid was added slowly to 10 mL of titanium tetra-isopropoxide with continuous stirring in an ice bath. A white precipitate solution was obtained, which was filtered and heated in air at 80 °C to evaporate extra water. After evaporation of water, the white precipitate was sintered at 400 °C for 4 h. For the hydrogen treatment under partial pressure, the annealing chamber was pumped down to 2.0 × 10⁻⁶ Torr and 20 sccm. 5% H2 balanced Ar was introduced into the chamber while maintaining the chamber pressure at 2 × 10⁻² Torr. The annealing temperature was set at 300 °C for 10, 20 and 30 h followed by cooling down for 1 h.2.2 Materials characterization
Glancing angle X-ray diffraction and Raman analysis were carried out on a Philip's X'Pert PRO-PW vertical system operating in reflection mode using Cu Kα (λ = 0.15406 nm) radiation and an Invia Raman microscope using a 514 nm argon ion laser pulse for excitation, respectively. To understand the optical behavior, the UV-visible spectra were measured on a Perkin-Elmer Lambda 35 UV visible spectrometer in the wavelength range of 200–800 nm. About 50 mg of TiO2 nanocrystals were pressed into a small sample container to make a flat surface and uniform density in a 'Praying Mantis' diffuse reflection accessory. Fourier transform infrared spectroscopy (FTIR) analysis was performed at room temperature using a Nicolet 5700 spectrometer in transmission mode in the wavenumber range of 500–4000 cm−1. The spectroscopic grade KBr pellets were used for collecting the spectra with a resolution of 4 cm−1 performing 32 scans. All the measurements were conducted under ambient conditions in air. TEM (FEI-Technai-G20 with a LaB6 filament, operating at 200 keV) was used to study the size and structural properties of nanoparticles. Proton Nuclear magnetic resonance (1H-NMR) measurements were carried out to investigate the effect of hydrogen treatment on H:TiO2 using a Nuclear Magnetic Resonance Spectrometer (JEOL-JNM-ECA Series (Delta V4.3)-400 MHz-FT-NMR). The EPR spectra were recorded on a Bruker EPR 100d X-band spectrometer for pristine and H:TiO2 samples through the EPR cavity. G values were calibrated using a di(phenyl)-(2,4,6-trinitrophenyl)iminoazanium (DPPH) sample. The parameters utilized in EPR measurements are as follows: center field, 3512 G; frequency, 9.74 GHz; microwave power, 20 mW. X-ray photoelectron spectroscopy (XPS, Kratos, XSAM 800) was carried out with non-monochromatic Mg (hν = 1253.6 eV) radiation. All binding energies were calibrated by referencing to the C1s peak at 284.6 eV. The deconvolution of the Ti peaks was performed through CASA XPS software.2.3 Photocatalytic experiments
The photocatalytic performance of pristine and hydrogen treated TiO2 samples was evaluated by observing their abilities to degrade the methylene blue (MB) dye, which is adopted as a representative organic pollutant in wastewater, in aqueous solution under simulated visible irradiation induced by using a 100 W tungsten lamp equipped with a UV cut-off filter to remove the radiation below 380 nm.In a typical visible-light photocatalytic experiment, the catalyst (30 mg) was dispersed in a 100 mL aqueous solution of MB (10 μM) and the obtained catalyst suspensions were magnetically stirred at 250 rpm in the dark for 40 min to ensure adsorption/desorption equilibrium between the catalyst and organic dye. The catalyst suspension was subsequently irradiated with a 100 W tungsten lamp. A sufficient dye solution (2 mL) of the suspension was extracted and centrifuged after every 10 min during the course of 100 min irradiation to remove the residual catalyst particulates for analysis. Control experiments were performed either without the catalyst or in the dark to attest that the degradation reaction is solely by a photocatalytic process. The photodegradation efficiency was monitored by measuring the change in intensity of the characteristic absorbance peak of MB at 664 nm using a Shimadzu UV-2450 spectrometer with 10 mm path length quartz cells. The photodegradation efficiency (D) of each catalyst was determined using the following equation:
| D(%) = 100 × (C0 − C)/C0 | (1) |
2.4 Photoelectrochemical and electrochemical impedance spectroscopy
For photoelectrochemical and electrochemical impedance spectroscopy (EIS) measurements, thin films from TiO2 powders were prepared using sol–gel spin coating techniques. These measurements were carried out in a three-electrode photoelectrochemical cell using pristine and H:TiO2 thin films as the working electrode, Pt as the counter electrode and Ag/AgCl as the reference electrode in a 1 M NaOH electrolyte (pH = 13.6). The photoelectrochemical cell was controlled using a CIMPS-2 (Controlled Intensity Modulated Photospectroscopy) system consisting of a Zennium Electrochemical Workstation (X-Pot Potentiostat). For photoelectrochemical measurements, linear sweep voltammetry scans under dark and illumination were carried out in the potential range of −1.0 to +1.0 V versus Ag/AgCl with a scan rate of 20 mV s−1. The illumination source was a white light source (λ > 380 nm) having an output illumination intensity of 100 mW cm−2. The electrochemical impedance spectroscopy (EIS) measurements were carried out in the frequency range from 100 kHz to 0.01 Hz with an AC signal amplitude of 10 mV under open bias conditions (i.e. 0.0 V versus Ag/AgCl reference electrode) to obtain the physical parameters such as flat band potential, carrier concentration, carrier conductivity, charge separation, and recombination processes.2.5 Ab initio simulations
For the ab initio calculations we used the Vienna ab initio simulations package (VASP).24 In VASP the valence electrons are described by using a plane wave basis set and the core electrons are taken into account using the projector-augmented wave formalism.25,26 All simulations were carried out within the PBE + U framework.27 Here, the properties of the strongly correlated d-electrons are corrected by using a Hubbard-like term for the onsite Coulomb interactions. We used a value of 4 eV for the Hubbard parameter U very close to the choice used in previous studies on n-type defects in TiO2.28–31 For the energy cut-off that defines the plane wave basis set we used a value of 500 eV. For modelling hydrogen treated anatase TiO2 with different levels of disorder, we used 3 × 3 × 1 super cells. Reciprocal space was sampled by using a 3 × 3 × 4 grid including the Γ point and by using a Gaussian smearing with a width of 0.1 eV. Structural relaxations were performed until all forces were smaller than 0.02 eV Å−1. The unit cell vectors were optimized simultaneously with the ion positions until pressures smaller than 1.0 kbar (0.1 GPa) were reached. In those cases where external pressure was applied the unit cell vectors were varied until the target pressures were reached within the same accuracy of at least 1.0 kbar.In order to calculate optical absorption coefficients we determined the frequency dependent dielectric function of the material by ab initio methods. The wavelength dependent absorption coefficient α(λ) is given by32
 | (2) |
The imaginary part εi of the dielectric function was calculated by a summation over matrix element products between the occupied and unoccupied Kohn–Sham eigenstates using the VASP software package as described by Gajdošet et al.33 The real part of the dielectric function was derived via the Kramers–Kronig relation. Off-diagonal elements of the dielectric function were found to be strongly suppressed and were hence ignored. An average over the diagonal elements of ε was used as an input for the calculation of the absorption coefficient in order to take into account the absence of any predominant orientation in polycrystalline materials.
3. Results and discussion
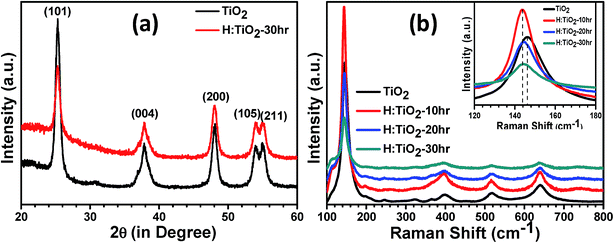
To determine the crystal structure and possible phase changes after hydrogen treatment, X-ray diffraction (XRD) spectra were collected from the pristine and hydrogen treated TiO2 nanocrystal samples at 300 °C for different times (Fig. 1(a)). All the peaks in the XRD pattern of pristine and H:TiO2 exhibited feature characteristics of the tetragonal anatase TiO2 crystallographic phase. Major peaks are observed at 2θ angles of 25.3, 37.84, 48.07, 53.95, and 55.10° with dhkl of 3.51, 2.37, 1.89, 1.69, and 1.66 Å corresponding to diffraction from planes (101), (044), (200), (105) and (211), respectively. Therefore, the tetragonal anatase phase of TiO2 has been retained without any structural transformation even after hydrogen treatment at 300 °C for 30 hours. The annealing of TiO2 in hydrogen ambient may affect TiO2 in two ways. It can lead to the formation of TiH2 (ref. 34) or the hydrogen would react with the oxygen in TiO2 leading to the formation of lattice defects.35 Since XRD data did not indicate any peak corresponding to TiH2, the reduction of TiO2 resulting in the formation of lattice defects such as oxygen vacancies is more likely. Both TiO2 and H:TiO2 samples show similar diffraction patterns (Fig. 1(a)). The slightly weaker XRD diffraction peak intensity in H:TiO2 indicates that the crystallinity of H:TiO2 upon hydrogen treatment is decreased due to defect generation and/or some degree of surface disorder.To further study any change in the phase structure after hydrogen treatment, Raman spectroscopy was performed on pristine and H:TiO2 as shown in Fig. 1(b). Well-resolved TiO2 Raman peaks were observed at 144 cm−1 (B1g), 398 cm−1 (B1g), 515 cm−1 (Eg), and 640 cm−1 (Eg) in the spectra of all samples, indicating that anatase nanoparticles are the predominant species. Only the peak expected at 147 cm−1 (Eg) was not visible, which may be suppressed by a much stronger TiO2 peak at 144 cm−1 (B1g) line.36 No major effects of hydrogen treatment with time were observed on the position of peaks in Raman spectra, i.e., the anatase structure is retained after hydrogen treatment. However, peak broadening in the H:TiO2 samples was observed in all the peaks in comparison to pristine. Such peak broadening in the Raman spectrum is assigned to structural changes in H:TiO2 indicating the formation of oxygen vacancies and other defects in the lattice.
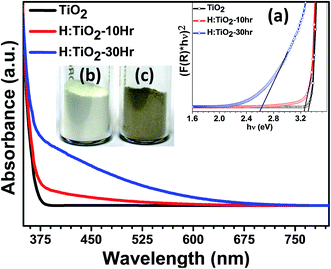
Fig. 2 shows the diffuse reflectance spectra (DRS) of pristine and hydrogen treated black TiO2 nanocrystals. A steep increase in absorption at wavelengths shorter than 375 nm can be attributed to the intrinsic band gap of crystalline anatase TiO2. H:TiO2 samples with different durations of treatment show a significant shift of absorption edge towards higher wavelength sliding to visible light absorption. Especially for the H:TiO2 sample treated in hydrogen for 30 h, the increase in absorption is observed in the wavelength range of 375–675 nm. The increased absorption is much higher as compared to other modification techniques used for TiO2 layers. The calculated values of the band gap energy from diffusive reflectance (inset (a) of Fig. 2) show that the band gap of the pristine TiO2 nanocrystals is approximately 3.30 eV, slightly higher than that of bulk anatase TiO2. The onset of light absorption for the hydrogen treated brownish TiO2 nanocrystals was lowered to about 2.59 eV. A digital photograph of pristine and hydrogen treated TiO2 nanocrystals is shown in the inset of Fig. 2(b) and (c), clearly showing the drastic change in the optical properties upon hydrogen treatment.
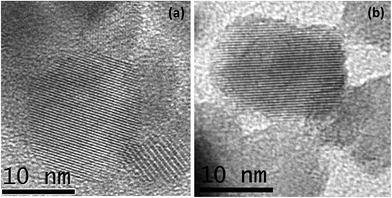
In order to investigate the changes in the microstructure upon hydrogen treatment, high-resolution transmission electron microscopy (HR-TEM) studies were carried out on the pristine and hydrogen treated brown TiO2 nanocrystals as shown in Fig. 3. The pristine TiO2 nanocrystal is completely crystalline, displaying clearly resolved and well-defined lattice fringes, terminating quite sharply at the surface of the nanocrystals (Fig. 3(a)). However, HR-TEM images of hydrogen treated black H:TiO2 nanoparticles exhibit a disordered amorphous shell layer structure around the crystalline TiO2 core resulting in crystalline core/amorphous shell (TiO2@H:TiO2) nanostructures as shown in Fig. 3(b). The average size of individual nanoparticles is approximately 15 nm in diameter. The disordered layer on the surface of H:TiO2 is ≈1–2 nm in thickness coated on a crystalline core after the hydrogen treatment for 30 h. From these values we can estimate that the fraction of the disordered material is between 15 and 25% of the total volume.
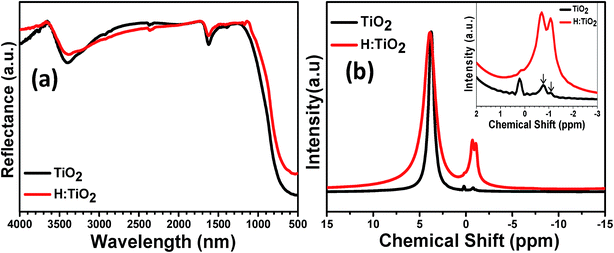
More insights into chemical changes caused by the hydrogen treatment on TiO2 were obtained by Fourier transform infrared (FT-IR) spectroscopic measurements. The results are shown in Fig. 4(a). FT-IR spectra of both pristine and hydrogen treated samples show similar absorption features from 500 cm−1 to 4000 cm−1 and exhibit OH absorption bands near the 1635 cm−1 and 3400 cm−1 region. The characteristic feature of the spectrum symmetric stretching vibrations of the Ti–O bonds is the presence of a band in the region of 400–800 cm−1 which is due to the TiO6 octahedra. After hydrogen treatment, the intensity of OH absorption bands is decreased near the 3400 cm−1 which suggests that the hydrogen treatment prevents the passivation of more O dangling bonds as this would otherwise increase the absorption. The wider OH absorption band in H:TiO2 indicates that the H:TiO2 surface provides the more diverse environment for the absorption of OH bands than the pristine TiO2.14
We further examined TiO2 and H:TiO2 by 1H NMR measurements to study the role of hydrogen treatment under partial pressure conditions. Fig. 4(b) shows the 1H NMR data of pristine and H:TiO2 nanocrystals with broad peaks at chemical shifts of 3.74 and 3.87 ppm, respectively. The 1H NMR spectra of H:TiO2 samples show a large line width which may be due to the incorporation of H at bridging sites at the disordered surface produced during the hydrogen treatment under partial pressure, or may be due to the bridging sites located on different crystallographic planes on the surface.37,38 Additionally, pristine TiO2 shows two narrow peaks at chemical shifts of +0.22 ppm and −0.77 ppm. However, the hydrogen treated H:TiO2 sample shows a pronounced additional peak at a chemical shift of −1.07 ppm. This new peak at δ = −1.07 ppm in H:TiO2 is probably due to the presence of weakly bound hydrogen atoms as a result of the hydrogen treatment process and may provide an explanation for the enhanced hydrogen mobility in black TiO2.37 Considering the theoretical studies, we may conclude that the weakly bound hydrogen atoms are frequently absorbed by oxygen vacancies in H:TiO2.39–41
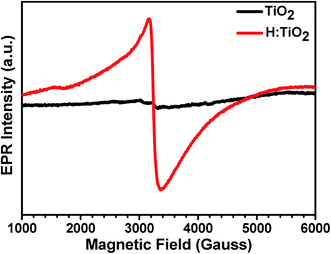
Electron paramagnetic resonance (EPR) spectroscopy was used to determine the presence of unpaired electron spins corresponding to localized Ti3+ centers. To provide a clear picture of the existence of Ti3+ in hydrogen treated H:TiO2, we performed the EPR measurement on TiO2 treated in 5% H2 mixed Ar at 300 °C for 30 hours. As shown in Fig. 5, the pristine TiO2 possesses a very weak resonance signal at a g-value of 2.08 which results from surface adsorbed O2− from air.42,43 This confirms that pristine TiO2 contains almost only Ti4+ (3d0) ions and exhibits weak unpaired electron signals. For the sample treated with hydrogen for 30 h, a strong EPR signal was observed with a g value of 1.95, which is a characteristic of paramagnetic Ti3+ centers.17 The formation of Ti3+ centers is frequently explained by the generation of oxygen vacancies during the reduction of TiO2 by hydrogen treatment. The strong EPR signal in H:TiO2 confirms that the vacuum hydrogen treated TiO2 nanocrystal sample contains a large concentration of Ti3+ and oxygen vacancies.
XPS measurements were carried out on both pristine and hydrogen treated TiO2 nanoparticles to understand the surface chemical bonds. In order to understand the chemical composition, peak position and hence the electronic properties, the Ti2p3/2 core level spectra were fitted with a mixture of Gaussian and Lorentzian line shapes, where Gaussian takes care of instrumental broadening and Lorentzian for the core hole life time with a Shirley background. Fig. 6(a) and (b) show a peak at a binding energy of 459 ± 0.1 eV which is attributed to Ti4+ states for both TiO2 and hydrogen treated TiO2.44,45 However, for hydrogen treated TiO2 a new peak is observed at a binding energy of 456.2 ± 0.1 eV which is attributed to Ti3+ as shown in Fig. 6(b), indicating a different bonding environment which is due to hydrogen treatment that creates disorder in the lattice, resulting in the near surface Ti3+. Fig. 6(c) and (d) represent the O1s spectra of TiO2 systems. The peak at a binding energy of 530.4 ± 0.1 eV corresponds to O–Ti bonds in titanium dioxide. The second component is broader at a binding energy of 531.6 ± 0.1 due to Ti–OH bonds.46 The reduction in the hydroxyl component could be due to the combination of desorption of hydroxyl groups and the influence of hydrogen treatment.
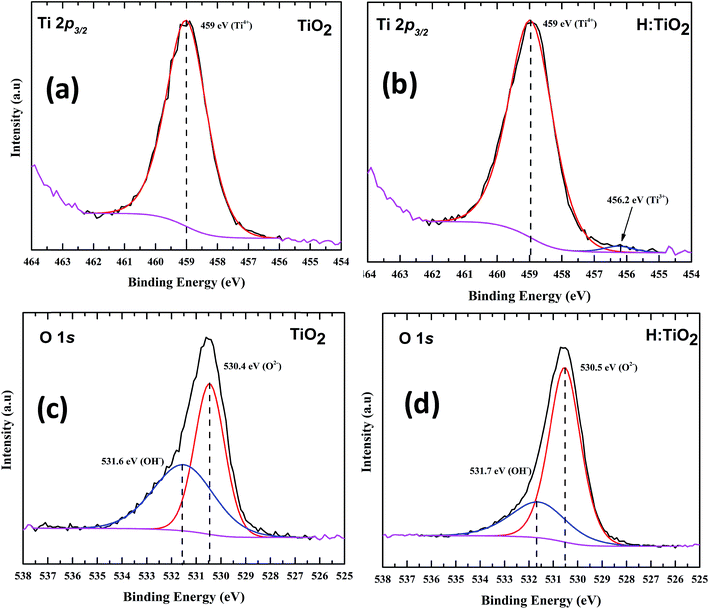 | ||
| Fig. 6 XPS spectra of (a) Ti2p of pristine TiO2, (b) hydrogen treated TiO2 shows the presence of Ti3+ (c) O1s of TiO2 and (d) O1s of hydrogen treated TiO2. | ||
It has been further proposed by experimental17 and theoretical39–41 studies that atomic hydrogen gets preferably absorbed at the oxygen vacancies in TiO2. In the work of Wang et al.,17 it was concluded that all oxygen vacancies get occupied by atomic hydrogen leading to the conversion of stoichiometric TiO2 to the composition TiO2−xHx. This finding was rationalized by the absence of any localized Ti3+ centers which are typically formed near oxygen vacancies. This reasoning is supported by our simulations as will be discussed later on. Since we do find a strong EPR signal of localized Ti3+ states in our samples and as the samples were synthesized under rather mild hydrogen conditions, it can be concluded that the majority of oxygen vacancies are not occupied by atomic hydrogen, at least in our case. As previous experimental studies14,41,47 and our simulation results discussed below show, a high concentration of oxygen vacancies and Ti3+ centers introduces occupied mid-gap states, which substantially narrow the electronic band gap of TiO2. Photoexcitation of these states correspondingly leads to a narrow optical band gap in agreement with our DRS measurements (Fig. 2) and potentially to enhanced visible-light photocatalytic activity.
The experimental results clearly indicate the relevance of enhanced visible light absorption which is one of the main reasons for improving the photoelectrochemical performance of TiO2. It is important to understand the crucial role of hydrogen treatment in forming localized electronic mid-gap states in the form of Ti3+ centers as experimentally observed in this work. In different studies oxygen vacancies (pristine VO or occupied by atomic hydrogen HO) have been investigated as prototypical defects associated with the reduction of TiO2 by hydrogen in order to elucidate the modification of the electronic structure and optical absorption properties. In many cases,47,48 the blackening of hydrogen treated TiO2 is traced back to the formation of localized Ti3+ states in the TiO2 band gap enabling the absorption of photons from the visible light spectrum. However, hydrogen treatment of TiO2 can also lead to the generation of a high density of occupied delocalized electronic states which act as shallow electron donors and hence lead to a high concentration of mobile charge carriers.17
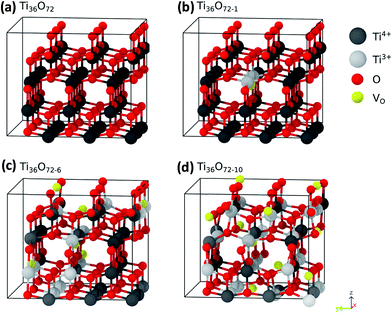
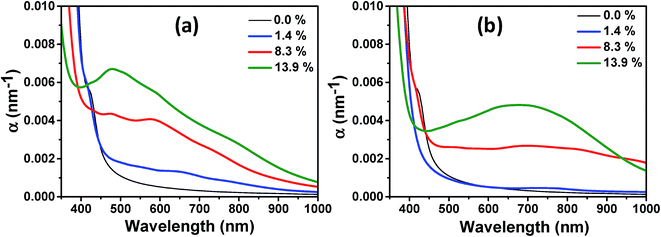
In order to elucidate the conditions which favor the generation of localized or delocalized electrons after the reduction of TiO2 we studied in this work the energetics of localized and delocalized states induced by different defect types, in terms of defect concentration and external pressure. We have used anatase supercells of the composition Ti36O72 which are generated by a 3 × 3 × 1 repetition of the tetragonal anatase unit cell. The dimensions of the optimized defect free supercell are 1.17 × 1.17 × 0.97 nm3. Different supercell compositions for oxygen vacancies Ti36O72−x (VO defects), and hydrogen saturated oxygen vacancies Ti36O72−xHx (HO defects), x = 0, 1, 6, 10, were considered. These correspond to defect concentrations of 0, 1.4, 8.3 and 13.9% with respect to the number of oxygen atoms. The corresponding structures for the case of VO defects are shown in Fig. 7. The disorder in the material was modeled by placing the lattice defects on random sites in the super cell. The positions of the impurities were chosen such that defects on adjacent sites are avoided since these configurations are energetically disfavored.
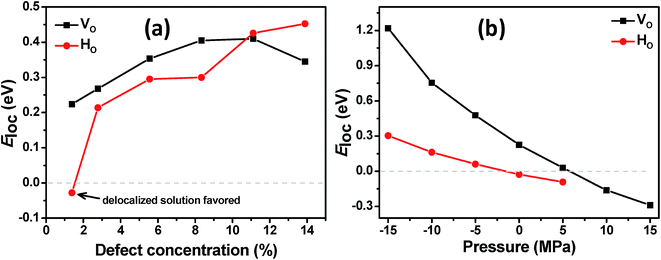
We start the discussion of the ab initio calculations with the results concerning the conditions that favor or disfavor the generation of localized Ti3+ centers or delocalized shallow donor states due to VO and HO defects. As a measure for the stability of the localized Ti3+ states we calculated the localization energy  for varying concentrations of VO and HO defects and varying external pressure. Here Edeloc and Eloc are the ground state energies of the defective TiO2 unit cells with delocalized and localized Ti3+ states, respectively, and #(defects) is the number of defects per unit cell. Hence, positive values of Eloc indicate that localization is more favorable than delocalization. We find that the localized states tend to be more stable at higher defect concentrations for both defect types (Fig. 8(a)). At higher concentrations of HO and VO defects similar localization energies in the range from about 0.2 to 0.45 eV are obtained in both cases, indicating the formation of localized Ti3+ centers. However, at the lowest considered defect concentration, corresponding to a single defect in the 3 × 3 × 1 supercell, the behavior of the two defect types deviates substantially. Here, the delocalized solution is slightly favored in the case of the HO defect by 0.03 eV, while the VO defect leads to a localized solution with Eloc = 0.22 eV. The latter value is in reasonable agreement with hybrid functional calculations22 where Eloc = 0.17 eV was found. The formation of a delocalized solution in the case of a low concentration of HO defects is in good agreement with the experimental work of Wang et al.17 who assumed that the substitution of oxygen by hydrogen leads to the observed high densities of delocalized mobile charge carriers. Selected HSE06 hybrid functional calculations confirmed the delocalized ground state of the electron donated by the HO defect at the lowest considered defect concentration of 1.4% and the full localization of the additional electrons at 8.3% defect concentration (see ESI for details†). The external isotropic pressure was considered as a further parameter that might determine the localization energy for single VO and HO defects in the 3 × 3 × 1 supercell. Here our ab initio calculations predict the transition from localized mid-gap states to delocalized shallow donor-states with increasing external pressure for both defect types (Fig. 8(b)). The sensitivity of the localization energy to pressure is more pronounced in the case of the VO defects. While the transition takes place at negative (expansive) pressure for the HO defects, compressive pressures larger than 5 GPa are needed to enforce delocalization in the case of VO defects. The origin of the pressure dependence of the localization energy can be traced back to the lattice distortion of the localized Ti3+ centers which is easier to be accommodated in an expanded lattice. Structural analysis shows that the lattice distortions are locally confined near the Ti3+ centers and can hence be considered as small polarons.29
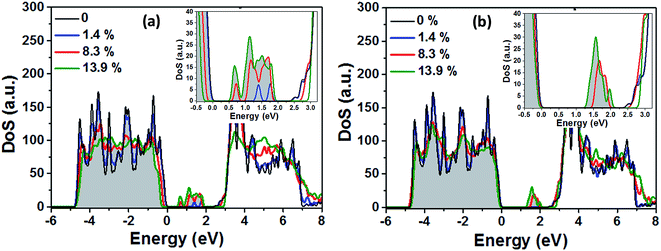
In the next step the electronic structure modification of TiO2 depending on the concentration of VO and HO defects is investigated. The presence of localized Ti3+ centers can be associated with the formation of occupied mid gap states in the density of states (DoS). As shown in Fig. 9(a), at low concentrations of oxygen vacancies of about 1%, we find two mid gap states, 0.74 eV and 1.11 eV, below the conduction band minimum (CBM), which are formed by two localized Ti3+ centers in the vicinity of the respective oxygen vacancies. These are shown in Fig. 7 as grey spheres and their effect on the density of states is in good agreement with previous ab initio studies on single oxygen vacancies.30 As discussed above, at the lowest considered concentration of HO defects the delocalized solution is favored such that in this case no midgap state is present in the DoS (Fig. 9(b)). At higher defect concentrations occupied midgap states are present for both defect types and the respective midgap state spectra broaden and shift down towards the valence band maximum, although the broadening of the spectrum is considerably more pronounced for the VO defects. In order to facilitate the comparison, the DoS of the different defect concentrations in Fig. 9(a) and (b) were aligned with respect to the center of the O2s band which is only weakly affected by the presence of VO and HO defects, see ESI Fig. S2.†
We obtain qualitatively similar results employing the HSE06 hybrid functional as shown in Fig. S1 of the ESI.† Both methods predict the double peak in the midgap region for a single VO defect and the considerably broadened and down shifted spectrum of defect states at higher VO concentrations. In the case of the HO defects, in both methods no midgap state is formed at low defect concentrations while at higher defect concentrations a relatively narrow spectrum of defect states forms below the CBM. Quantitatively, the main differences between the two approaches are the deviating predictions for the electronic band gap of pristine TiO2 of 2.55 eV (PBE + U) and 3.77 eV (HSE06). Hence the PBE + U formalism underestimates, while the HSE06 functional overestimates the experimental value of ∼3.4 eV.22
Finally, we investigated the effect of VO and HO defects on the optical absorption below the absorption edge of pristine TiO2 and the influence of the defect concentration. In Fig. 10(a), we show the wavelength dependent optical absorption coefficient for the VO defects. Already at a low defect concentration of 1.4%, the absorption of photons with energies below the band gap energy of pristine TiO2 is observed. With increasing defect concentration the absorption increases further and up to the investigated defect concentration of 13.9%, no saturation in the visible light absorption coefficient is seen, indicating that the degree of disorder is the crucial quantity that leads to the experimentally observed high photoabsorption. Consistent with the experimentally obtained DRS measurements a declining photoabsorption with increasing wavelength is observed. We note, however, that the simulated values are red-shifted with respect to the experimental data due to the underestimation of the electronic band gap. The photoabsorption spectrum of different HO defect concentrations is shown in Fig. 10(b). Here, no considerable photoabsorption in the band gap region of pristine TiO2 is observed at a low defect concentration of 1.4% in accordance with the absence of a localized midgap state. At the higher defect concentrations photoabsorption in the visible light range sets in and again an increasing defect concentration leads to higher absorption coefficients. In contrast to the VO defects and the experimental data the absorption coefficient decays much slower with increasing wavelength. This suggests that the hydrogen treated samples considered in this work mainly contain oxygen vacancies. This does not exclude their partial occupancy by substitutional hydrogen.
3.1 Photocatalytic and photoelectrochemical activity
The photocatalytic activity of all four samples was evaluated by measuring the time-dependent degradation of methylene blue (MB) under visible-light irradiation (Fig. 11(a)). From Fig. 11(b), we can see that the pristine TiO2 sample shows poor photocatalytic activity in the visible-light. The degradation rate constant k of pristine TiO2 was ∼5.1 × 10⁻⁶ min−1. This small value is attributed to the large band gap energy of TiO2. For the H:TiO2 samples, the photodegradation activity increases with increasing the hydrogen treatment time as expected from the enhanced visible light absorption. The photodegradation rate constant k reaches the maximum ∼9.9 × 10⁻³ min−1 for the 30 h hydrogen treated sample. This value is approximately three orders of magnitude higher than that of pristine TiO2 under visible-light irradiation. Further, we have also investigated the photocatalytic degradation efficiency of pure and hydrogen treated TiO2 for colorless pollutants such as phenol. The phenol degradation efficiency with different photocatalysts as a function of visible light irradiation time is given in ESI Fig. S3.† To check the long stability of the defect generated in H:TiO2 by hydrogen treatment when stored under ambient conditions, we used H:TiO2 samples to re-examine the structural, optical and electrical properties and also used them for photocatalytic and photoelectrochemical application tests. We found that H:TiO2 samples still exhibit the presence of Ti3+ and the enhanced photocatalytic activity for phenol degradation (Fig. S3 of the ESI†).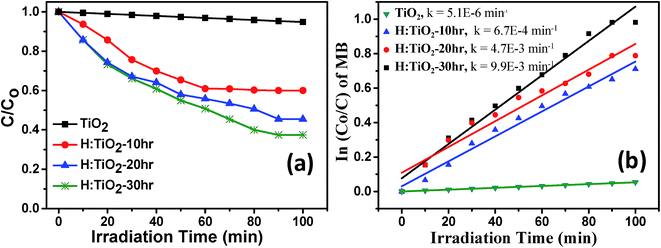 | ||
| Fig. 11 (a) Solar-light driven photocatalytic decomposition of Methylene blue (b) rate constant calculation for pristine and hydrogen treated TiO2 samples. | ||
To determine the photoelectrochemical activity for solar hydrogen production through water splitting, thin films of pristine TiO2 and H:TiO2 powders were prepared using the spin coating technique on ITO substrates and converted into electrodes. The photoelectrochemical measurements were performed under visible light illumination (λ = 380 nm) with an output intensity of 100 mW cm−2 through a tungsten lamp. The enhanced visible light photoactivity of H:TiO2 was examined by measuring the linear sweep voltammetry scans under dark and illumination in the potential range of −0.5 to +1.0 V vs. Ag/AgCl with a scan rate of 20 mV s−1. Fig. 12(a) shows the photocurrent density vs. applied potential (V vs. Ag/AgCl) curves for pristine and hydrogen treated TiO2 samples collected in 1 M NaOH solution. In the case of pristine TiO2 a very small photocurrent was obtained which is ∼35 μA cm−2 (at 1.0 V vs. Ag/AgCl). However, the H:TiO2 samples show a large improvement in the photocurrent density (∼0.56 mA cm−2 at 1.0 V vs. Ag/AgCl) under the same experimental conditions.
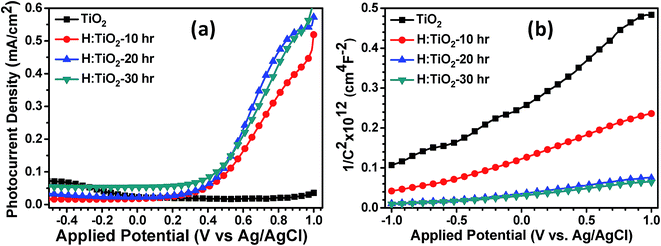 | ||
| Fig. 12 (a) Photocurrent density vs. applied potential (V vs. Ag/AgCl) curves (b) Mott–Schottky plots for pristine and hydrogen treated TiO2 samples collected in 1 M NaOH solution. | ||
To determine the intrinsic electrical properties of pristine TiO2 and H:TiO2 samples, thin films of TiO2 were used as working electrodes for the Mott–Schottky (1/C2versus Vapp) measurements. Mott–Schottky measurements were carried out at 1 kHz AC signal frequency in 1 M NaOH solution under dark conditions to calculate the donor density (ND) and flat band potential (VFB) by using the Mott–Schottky equation.4Fig. 12(b) shows the Mott–Schottky plots for pristine and hydrogen treated TiO2 samples. The positive slope of Mott–Schottky curves in all the samples indicated the n-type conductivity of the TiO2 thin films. The donor density was estimated from the slopes of the Mott–Schottky curve using the equation,  . The calculated value of ND, as estimated from the slopes of the Mott–Schottky curve, was found to increase with hydrogen incorporation. The hydrogen treated H:TiO2 films exhibited significantly higher donor density, 5.5 × 1017 cm−3, compared to the pristine TiO2 (7.2 × 1016 cm−3) sample even though the phase structure of the material did not show any major changes. The enhanced donor density can be attributed to excess electrons provided by lattice defects such as oxygen vacancies (VO) or oxygen vacancies that are occupied by atomic hydrogen (HO). Our simulation shows that delocalized excess charge carriers are rather formed by the HO defects at low defect concentrations. Since HR-TEM data show a highly defective surface of the H:TiO2 samples, delocalized charge carriers can rather be expected in the bulk region of the nanocrystals, where the defect concentration should be considerably lower. The observed negative shift of flat band potential could be due to the substantially increased electron density, which is expected to shift the Fermi level of TiO2 towards the conduction band.
Further, electrochemical impedance spectroscopic (EIS) measurements have been performed under visible light illumination to understand the effect of hydrogen treatment of TiO2 on charge separation and recombination processes. EIS Nyquist plots of the pristine and H:TiO2 samples are shown in Fig. 13. The EIS results show that only one semicircle was observed for each sample and thus can be fitted with the Randles equivalent circuit model (inset of Fig. 13)49. In this model, the element RS is the resistance related to charge transport and contains the resistance of the semiconductor catalyst, ITO substrate, the electrolyte and wire connections in the whole circuit. The elements of Rct,bulk and Cbulk are related to the charge transfer at the interface of the photoelectrode/electrolyte. A smaller radius of the semicircle represents a better charge transfer ability (i.e., faster surface reaction kinetics).49 As shown in Fig. 13, it is evident that the radii of semicircle on the real axis of Nyquist plots of H:TiO2 treated in hydrogen for 30 h are much smaller than those for pristine and other TiO2 samples, which indicates that the hydrogen treatment in TiO2 reduces the semiconductor–electrolyte contact resistance and improves the charge transport. Therefore, the charge transport efficiency of H:TiO2 samples increased significantly both on the surface (i.e., surface reaction kinetics) and in the bulk, leading to an improved PEC activity. The smaller radii of the H:TiO2 samples are presumably due to an increased electron density as obtained in the Mott–Schottky measurement which improves the electrical conductivity of the electrodes. The smaller arc radii in H:TiO2 under illumination in EIS plots clearly indicate that the fast charge transfer occurs on the photoelectrodes.
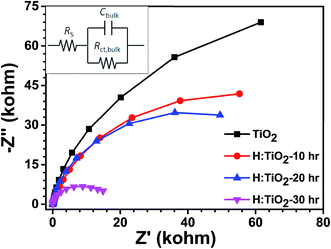 | ||
| Fig. 13 EIS Nyquist plots of the pristine and hydrogen treated TiO2 samples at an open bias condition under dark. | ||
Therefore, the significant improvement in the photocatalytic activity and photocurrent density after hydrogen treatment of TiO2 nanocrystals shows that they can generate more electron–hole pairs in visible light and exhibit a stronger ability for electron–hole pair separation than pristine TiO2. The observation of a small photocurrent in pristine TiO2 using visible light illumination (λ > 380 nm) is due to the high band gap energy as the photons with energies less than the band gap energy (Eg = 3.31 eV) did not contribute to the excitation of valence band electrons to the conduction band to generate the electron–hole pairs. The DRS, EPR and Mott–Schottky measurements and DFT calculation clearly show that the reduction in the band gap of H:TiO2 is likely due to the formation of midgap states induced by localized Ti3+ states. Therefore, the significant improvement in photocatalytic activity and photocurrent density can be explained by the surface disordering and defect formation after hydrogen treatment.
4. Conclusion
In summary, it has been shown that hydrogen treatment of TiO2 under partial pressure conditions leads to an enhanced photocatalytic and photoelectrochemical response, which significantly depends on the duration of hydrogen treatment. DRS and EPR analyses of pristine and hydrogen treated TiO2 nanocrystals show that the tailoring in properties of H:TiO2 is due to surface oxygen-vacancies and Ti3+ states. Additionally, these modifications in properties induced a higher charge carrier concentration and a more negative flat band potential as compared to pristine TiO2. The experimental studies were substantiated by ab initio calculations in order to gain a deeper understanding of the origin of enhanced visible light absorption due to Ti3+ centers and the conditions that favor the formation of localized or delocalized excess electrons due to oxygen vacancies. It was shown that with higher concentrations of VO and HO defects the spectrum of the induced midgap states broadens considerably and moves energetically downward towards the VBM. At the same time the visible light absorption increases and localization of the Ti3+ states becomes more favorable. Substitutional HO defects at low concentrations were identified as candidates to provide delocalized charge carriers in TiO2. This study provides a detailed overall picture covering experimental and theoretical aspects of the effect of hydrogen treatment on the structural, optical and electronic properties of the TiO2 matrix and resulting improvements in the photoelectrochemical properties.Author contributions
A. P. Singh and S. Basu conceived the idea, designed the experiments and worked out the overall structure of the manuscript. M. Mehta and N. Kodan prepared and characterized the samples and analyzed the data for the experimental part of the manuscript. S. Kumar performed the catalytic measurements and was involved in writing the particular section of the manuscript. A. Kaushal performed the HRTEM and analyzed the data. A. Dey and S. Krishnamurthy performed the XPS measurements and the XPS peak fitting and were involved in writing the particular section of the manuscript. L. Mayrhofer performed and analyzed the DFT calculations and was involved in writing the manuscript. M. Walter was involved in writing the revision of the manuscript and in discussing the DFT results. M. Moseler gave advice on the setup and analysis of the DFT calculations and was involved in the interpretation and discussion of the DFT results. The manuscript was written through contributions of all authors. All authors have given approval to the final version of the manuscript.Acknowledgements
We gratefully acknowledge the financial support provided by the Department of Science and Technology, New Delhi India under the SERI and DST-UKERI programme and the New Indigo project InSOL. A. P. S. is grateful to the Department of Science & Technology, New Delhi, India for financial support in terms of INSPIRE Faculty award No. IFA12-PH-16. L. M. and M. M. kindly acknowledge the financial support under the FP7 project “SOLAROGENIX” (NMP4-SL-2012-310333). The ab initio calculations were performed on the Joe cluster of Fraunhofer IWM and on JUROPAat the Julich Supercomputing Center (JSC). The authors gratefully acknowledge the computing time granted by the John von Neumann Institute for Computing (NIC) and provided on the supercomputer JUROPA at JSC.References
- A. Fujishima, T. N. Rao and D. A. Tryk, J. Photochem. Photobiol., C, 2000, 1, 1–21 CrossRef CAS.
- A. P. Singh, S. Kumari, R. Shrivastav, S. Dass and V. R. Satsangi, Int. J. Hydrogen Energy, 2008, 33, 5363–5368 CrossRef CAS.
- M. R. Hoffmann, S. T. Martin, W. Choi and D. W. Bahnemann, Chem. Rev., 1995, 95, 69–96 CrossRef CAS.
- R. Dholam, N. Patel, M. Adami and A. Miotello, Int. J. Hydrogen Energy, 2009, 34, 5337–5346 CrossRef CAS.
- H. Zhu, J. Tao and X. Dong, J. Phys. Chem. C, 2010, 114, 2873–2879 CAS.
- R. Asahi, T. Morikawa, T. Ohwaki, K. Aoki and Y. Taga, Science, 2001, 293, 269–271 CrossRef CAS PubMed.
- S. U. M. Khan, M. Al-Shahry and W. B. Ingler Jr, Science, 2002, 297, 2243–2245 CrossRef CAS PubMed.
- V. Tiwari, J. Jiang, V. Sethi and P. Biswas, Appl. Catal., A, 2008, 345, 241–246 CrossRef CAS.
- P. V. Kamat, M. Flumiani and A. Dawson, Colloids Surf., A, 2002, 202, 269–279 CrossRef CAS.
- A. A. Nada, M. H. Barakat, H. A. Hamed, N. R. Mohamed and T. N. Veziroglu, Int. J. Hydrogen Energy, 2005, 30, 687–691 CrossRef CAS.
- M. Takeuchi, H. Yamashita, M. Matsuoka, M. Anpo, T. Hirao, N. Itoh and N. Iwamoto, Catal. Lett., 2000, 67, 135–137 CrossRef CAS.
- F. Zuo, L. Wang, T. Wu, Z. Zhang, D. Borchardt and P. Feng, J. Am. Chem. Soc., 2010, 132, 11856–11857 CrossRef CAS PubMed.
- X. Chen, L. Liu, P. Y. Yu and S. S. Mao, Science, 2011, 331, 746–750 CrossRef CAS PubMed.
- X. Chen, L. Liu, Z. Liu, M. A. Marcus, W. C. Wang, N. A. Oyler, M. E. Grass, B. Mao, P.-A. Glans, P. Y. Yu, J. Guo and S. S. Mao, Sci. Rep., 2013, 3, 1510 Search PubMed.
- H. Li, Z. Chen, C. K. Tsang, Z. Li, X. Ran, C. Lee, B. Nie, L. Zheng, T. Hung, J. Lu, B. Pan and Y. Y. Li, J. Mater. Chem. A, 2014, 2, 229–236 CAS.
- L. X. Zheng, H. Cheng, F. X. Liang, S. W. Shu, C. K. Tsang, H. Li, S. T. Lee and Y. Y. Li, J. Phys. Chem. C, 2012, 116, 5509–5515 CAS.
- Z. Wang, C. Yang, T. Lin, H. Yin, P. Chen, D. Wan, F. Xu, F. Huang, J. Lin, X. Xie and M. Jiang, Adv. Funct. Mater., 2013, 23, 5444–5450 CrossRef CAS.
- A. Mettenborger, T. Singh, A. P. Singh, T. T. Jarvi, M. Moseler, M. Valldor and S. Mathur, Int. J. Hydrogen Energy, 2014, 39, 4828–4835 CrossRef.
- H. Wu, C. Xu, J. Xu, L. Lu, Z. Fan, X. Chen, Y. Song and D. Li, Nanotechnology, 2013, 24, 455401 CrossRef PubMed.
- A. Sasinsk, T. Singh, S. Wang, S. Mathur and R. Kraehnert, J. Vac. Sci. Technol., A, 2015, 33, 01A152 Search PubMed.
- A. Fujishima, X. T. Zhang and D. A. Tryk, Surf. Sci. Rep., 2008, 63, 515–582 CrossRef CAS.
- C. D. Valentin, G. Pacchioni and A. Selloni, J. Phys. Chem. C, 2009, 113, 20543–20552 Search PubMed.
- A. P. Singh, S. Kumari, Sonal, R. Shrivastav, S. Dass and V. R. Satsang, J. Sci. Conf. Proc., 2009, 1, 82–85 CrossRef CAS.
- G. Kresse and J. Furthmüller, Phys. Rev. B: Condens. Matter Mater. Phys., 1996, 54, 11169–11186 CrossRef CAS.
- G. Kresse and D. Joubert, Phys. Rev. B: Condens. Matter Mater. Phys., 1999, 59, 1758–1775 CrossRef CAS.
- P. E. Blöchl, Phys. Rev. B: Condens. Matter Mater. Phys., 1994, 50, 17953–17979 CrossRef.
- S. L. Dudarev, G. A. Botton, S. Y. Savrasov, C. J. Humphreys and A. P. Sutton, Phys. Rev. B: Condens. Matter Mater. Phys., 1998, 57, 1505–1509 CrossRef CAS.
- B. J. Morgan and G. W. Watson, Surf. Sci., 2007, 601, 5034–5041 CrossRef CAS.
- B. J. Morgan, D. O. Scanlon and G. W. Watson, J. Mater. Chem., 2009, 19, 5175–5178 RSC.
- E. Finazzi, C. D. Valentin, G. Pacchioni and A. Selloni, J. Chem. Phys., 2008, 129, 154113 CrossRef PubMed.
- M. Setvin, C. Franchini, X. Hao, M. Schmid, A. Janotti, M. Kaltak, C. G. Van de Walle, G. Kresse and U. Diebold, Phys. Rev. Lett., 2014, 113, 086402 CrossRef PubMed.
- M. Fox, Optical Properties of Solids, Oxford University Press, 2001 Search PubMed.
- M. Gajdošet, K. Hummer, G. Kresse, J. Furthmuller and F. Bechstedt, Phys. Rev. B: Condens. Matter Mater. Phys., 2006, 73, 045112 CrossRef.
- K. M. Mackay, Hydrogen Compounds of the Metallic Elements, E and F N Spon, London, UK, 1966, p. 71 Search PubMed.
- P. Raghunath, W. F. Huang and M. C. Lin, J. Chem. Phys., 2013, 138, 154705 CrossRef CAS PubMed.
- M. Ocana, J. V. Garcia-Ramos and C. J. Serna, J. Am. Ceram. Soc., 1992, 75, 2010–2016 CrossRef CAS.
- M. Crocker, R. H. M. Herold, A. E. Wilson, M. Mackay, C. A. Emeis and A. M. Hoogendoorn, J. Chem. Soc., Faraday Trans., 1996, 92, 2791–2798 RSC.
- P. Jonsen, Colloids Surf., 1989, 36, 127–132 CrossRef CAS.
- H. H. Nahm and C. H. Park, J. Korean Phys. Soc., 2010, 56, 485–489 CAS.
- F. Filippone, G. Mattioli, P. Alippi and A. Amore Bonapasta, Phys. Rev. B: Condens. Matter Mater. Phys., 2009, 80, 245203 CrossRef.
- U. Aschauer and A. Selloni, Phys. Chem. Chem. Phys., 2012, 14, 16595 RSC.
- S. M. Prokes, J. L. Gole, X. Chen, C. Burda and W. E. Carlos, Adv. Funct. Mater., 2005, 15, 161–167 CrossRef CAS.
- J. Strunk, W. C. Vining and A. T. Bell, J. Phys. Chem. C, 2010, 114, 16937–16945 CAS.
- I. Luciu, R. Bartali and N. Laidani, J. Phys. D: Appl. Phys., 2012, 45, 345302 CrossRef.
- U. Diebold, Surf. Sci. Rep., 2003, 48, 53–229 CrossRef CAS.
- G. Wang, H. Wang, Y. Ling, Y. Tang, X. Yang, R. C. Fitzmorris, C. Wang, J. Z. Zhang and Y. Lim, Nano Lett., 2011, 11, 3026–3033 CrossRef CAS PubMed.
- X. Liu, H. Xu, L. R. Grabstanowicz, S. Gao, Z. Lou, W. Wang, B. Huang, Y. Dai and T. Xu, Catal. Today, 2014, 225, 80–89 CrossRef CAS.
- A. Naldoni, M. Allieta, S. Santangelo, M. Marelli and F. Fabbri, J. Am. Chem. Soc., 2012, 134, 7600–7603 CrossRef CAS PubMed.
- B. Klahr, S. Gimenez, F. Fabregat-Santiago, T. Hamann and J. Bisquert, J. Am. Chem. Soc., 2012, 134, 4294 CrossRef CAS PubMed.
Footnote |
| † Electronic supplementary information (ESI) available. See DOI: 10.1039/c5ta07133j |
| This journal is © The Royal Society of Chemistry 2016 |

