Earth-abundant and nano-micro composite catalysts of Fe3O4@reduced graphene oxide for green and economical mesoscopic photovoltaic devices with high efficiencies up to 9%†
Huawei
Zhou
a,
Jie
Yin
*a,
Zhonghao
Nie
a,
Zhaojin
Yang
a,
Dongjie
Li
a,
Junhu
Wang
b,
Xin
Liu
b,
Changzi
Jin
b,
Xianxi
Zhang
*a and
Tingli
Ma
c
aShandong Provincial Key Laboratory of Chemical Energy Storage and Novel Cell Technology, School of Chemistry and Chemical Engineering, College of Materials Science and Engineering, Liaocheng University, Liaocheng 252059, China. E-mail: yinjieily@163.com; xxzhang3@126.com
bMössbauer Effect Data Center, Dalian Institute of Chemical Physics, Chinese Academy of Sciences, Dalian 116023, China
cGraduate School of Life Science and Systems Engineering, Kyushu Institute of Technology, 2-4 Hibikino, Wakamatsu, Kitakyushu, Fukuoka, 808-0196, Japan
First published on 2nd November 2015
Abstract
The ideal liquid–solid heterogeneous electrocatalysis should have not only high catalytic activity but also free electron transport. However, preparing a single catalyst that simultaneously possesses both advantages has proven to be challenging. Herein, we prepared nano–micro composite catalysts (NMCCs) composed of highly dispersed Fe3O4 nanoparticles fixed on reduced graphene oxide (RGO) sheets (namely Fe3O4@RGO-NMCC) as the counter electrode (CE) in dye-sensitized solar cells (DSCs). Compared with the Fe3O4 or RGO CE, the Fe3O4@RGO-NMCC CE exhibited improved activity and reversibility for the catalytic reduction of triiodide ions (I3−) to iodide ions (I−). Notably, DSCs using rigid and flexible Fe3O4@RGO-NMCC CEs achieved high PCEs up to 9% and 8% on fluorine-doped tin oxide (FTO)/glass substrates and flexible polymer substrates, respectively. These values are, to our knowledge, some of the highest reported efficiencies for DSCs based on a flexible Pt-free CE. We ascribed the superior catalytic performance of Fe3O4@RGO-NMCC to faster electron hopping between Fe2+ and Fe3+ and free electron transport by broad RGO sheets. Finally, Fe3O4@RGO-NMCC exhibited good stability in the practical application of DSCs because Fe3O4 nanoparticles were chemically bonded to the surface of RGO. Our work here will be of great interest for fundamental research and practical applications of Fe3O4 in lithium batteries, splitting water and magnetic fields.
Introduction
As third-generation photovoltaic devices, dye-sensitized solar cells (DSCs)1 based on environmentally friendly (i.e., green) raw materials completely free of Cd or Pb have been regarded as very promising solar cells owing to their simple synthesis procedures, high theoretical power conversion efficiency (PCE), and low cost. With continuous efforts from researchers worldwide, the PCEs of DSCs have been improved by 13% (ref. 2) using Pt as the counter electrode (CE).As key components, CEs of DSCs are used to collect electrons from the external circuit, and more importantly, catalyze the reduction of redox mediators in electrolytes. Pt is the most widely used CE material in DSCs. However, using Pt involves a number of challenges. Firstly, the scarcity and high cost of Pt cannot meet the needs of mass industrial production. Secondly, Pt can be corroded by I−/I3− electrolytes, leading to poor stability of the photovoltaic device.3,4 Therefore, developing a high-performance, low-cost, corrosion-resistant, non-precious metal catalyst is necessary. In recent years, numerous researchers have developed alternative CE materials, such as inorganic materials,5,6 carbon materials,7–10 and conductive polymer materials.11,12
Of the transition metal oxides studied, iron oxides showed remarkable abundance and notable catalytic activity, with PCEs of 6.89% for Fe2O3 nanoparticles13 and 7.65% for Fe3O4 hierarchical structures.14 However, grain boundaries in nanoparticle and hierarchical structures are massive and remarkably hinder electron transport.15,16 Recently, our group further synthesized a composite catalyst of rosin carbon/Fe3O4 to enhance the performance of the corresponding DSCs.17 However, the Fe3O4 nanoparticle on rosin carbon substantially aggregates together, resulting in the loss of the active sites.
Herein, we prepared nano–micro composite catalysts (NMCCs) composed of highly dispersed Fe3O4 nanoparticles fixed on reduced graphene oxide (RGO) sheets (namely, Fe3O4@RGO-NMCC) as the CE in DSCs. Compared with the pure Fe3O4 and RGO CE, the Fe3O4@RGO-NMCC CE exhibited improved activity and reversibility for the catalytic reduction of triiodide (I3−) to iodide (I−). Notably, DSCs using rigid and flexible Fe3O4@RGO-NMCC CEs achieved high PCEs up to 9% and 8% on fluorine-doped tin oxide (FTO)/glass substrates and flexible polymer substrates, respectively. These values are, to our knowledge, the highest reported efficiencies for DSCs based on a flexible Pt-free CE. We ascribed the superior catalytic performance of Fe3O4@RGO-NMCC to faster electron hopping between Fe2+ and Fe3+ and free electron transport by broad RGO sheets. Finally, Fe3O4@RGO-NMCC exhibited good stability in the practical application of DSCs because Fe3O4 nanoparticles were chemically bonded to the surface of RGO.
Experimental section
Preparation of Fe3O4
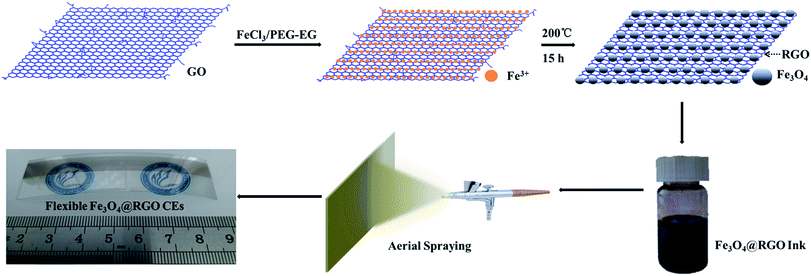
Typically, 10 mL 0.5 mol L−1 FeCl3 in ethylene glycol (EG) solution, 10 mL 0.1 g mL−1 polyethylene glycol (PEG) in EG solution and 10 mL 1.5 mol L−1 NaOH in EG solution were mixed. The mixture was stirred for 4 h at room temperature and then transferred into a Teflon-lined autoclave. After being heated at 200 °C for 15 h, the mixture was cooled to room temperature naturally.Preparation of RGO
Graphene oxide (GO) was prepared using a modified Hummers method. Typically, flake graphite (1 g), sodium nitrate (1 g), and potassium permanganate (3.0 g) were mixed in 98% sulfuric acid (48 mL) by vigorous agitation in a round-bottom flask at 0 °C for 24 h. Then, the mixture was heated and kept at 35 °C for 30 min. After that, 250 mL distilled water was slowly added into the suspension and stirred for 20 min. Then, 2.5 mL hydrogen peroxide (30%) was added into the mixture. The as-prepared suspension was washed thoroughly with deionized water and centrifuged with 3000 rpm. After that, the supernatant was then centrifuged with 8000 rpm until its pH was ≈7. The obtained precipitates were redispersed in deionized water to obtain a 1.7 wt% GO dispersion. 27 g 1.7 wt% GO dispersion were dispersed in 100 mL EG solution. The mixture was stirred for 4 h at room temperature and then transferred into a Teflon-lined autoclave. After being heated at 200 °C for 15 h, the mixture was cooled to room temperature naturally.Preparation of Fe3O4@RGO-NMCC
Typically, 10 mL 0.5 mol L−1 FeCl3 in EG solution, 10 mL 0.1 g mL−1 PEG in EG solution and 10 mL 1.5 mol L−1 NaOH in EG solution were mixed with 2.7 g 1.7 wt% GO aqueous solution dispersed in 10 mL EG solution. The mixture was stirred for 4 h at room temperature and then transferred into a Teflon-lined autoclave. After being heated at 200 °C for 15 h, the mixture was cooled to room temperature naturally.Photoanode preparation and cell fabrication
A layer of 20 nm-sized TiO2 (P25, Degussa, Germany) (12 μm) was loaded on FTO glass by a printing technique method and used in this study.10 The obtained film was sintered at 500 °C. After cooling to 90 °C, the TiO2 films were immersed in a solution of N719 dye (5 × 10⁻⁴ M) in acetonitrile/tert-butyl alcohol (1![[thin space (1/6-em)]](https://www.rsc.org/images/entities/char_2009.gif) :
:![[thin space (1/6-em)]](https://www.rsc.org/images/entities/char_2009.gif) 1 volume ratio) for 20 h. For the TiO2 photoanode film treated by TiCl4, the films were immersed in 40 mM TiCl4 solution at 70 °C for 30 min and then sintered at 500 °C for 30 min. The triiodide/iodide electrolyte for cell testing is composed of LiI (0.03 M), 1-butyl-3-methylimidazolium iodide (0.6 M), I2 (0.03 M), 4-tert-butyl pyridine (0.5 M), and guanidinium thiocyanate in acetonitrile (0.1 M). DSCs were assembled by using a TiO2 photoanode with a corresponding counter electrode sandwiching the redox couple in the electrolyte. The symmetrical cells with effective area (0.64 cm2) were measured in the Tafel-polarization test and the EIS experiments.
1 volume ratio) for 20 h. For the TiO2 photoanode film treated by TiCl4, the films were immersed in 40 mM TiCl4 solution at 70 °C for 30 min and then sintered at 500 °C for 30 min. The triiodide/iodide electrolyte for cell testing is composed of LiI (0.03 M), 1-butyl-3-methylimidazolium iodide (0.6 M), I2 (0.03 M), 4-tert-butyl pyridine (0.5 M), and guanidinium thiocyanate in acetonitrile (0.1 M). DSCs were assembled by using a TiO2 photoanode with a corresponding counter electrode sandwiching the redox couple in the electrolyte. The symmetrical cells with effective area (0.64 cm2) were measured in the Tafel-polarization test and the EIS experiments.
Characterization
To analyze the composition of the as-synthesized samples, we obtained X-ray diffraction (XRD) patterns using a PANalytical X'Pert diffractometer (Cu Kα radiation at λ = 1.54 Å) sampling at 8° min−1, 40 kV and 100 mA. The as-prepared micro- or nano-structures were characterized and analyzed by scanning electron microscopy (SEM, Nova Nano SEM 450) and transmission electron microscopy (TEM, FEI Tecnai G2 F30) with an accelerating voltage (300 kV). The Mössbauer spectrum of the as-prepared materials was recorded using a Topologic 500A spectrometer and a proportional counter at room temperature. 57Co(Rh) moving in a constant acceleration mode was used as the radioactive source. The film thicknesses were measured using a film-thickness measuring device (KLA-Tencor D-100). The photocurrent–voltage performance of DSCs with a 0.16 cm2 photoanode film was measured without a metal mask by using a Keithley digital source meter (Keithley 2400, USA) and equipped with a solar simulator (IV5, PV Measurements, Inc., USA). The IPCE of DSCs was measured by using a quantum efficiency/spectral response (SR)/incident photon to current conversion efficiency (IPCE) measurement system (QEX10, PV Measurements, Inc., USA). EIS experiments were performed in dummy cells in the dark using a computer-controlled potentiostat (Zennium Zahner, Germany). Cyclic voltammetry (CV) was carried out in a three-electrode system. The triiodide/iodide electrolyte for CV testing is composed of LiI (2 mM), LiClO4 (20 mM) and I2 (0.2 mM).Results and discussion
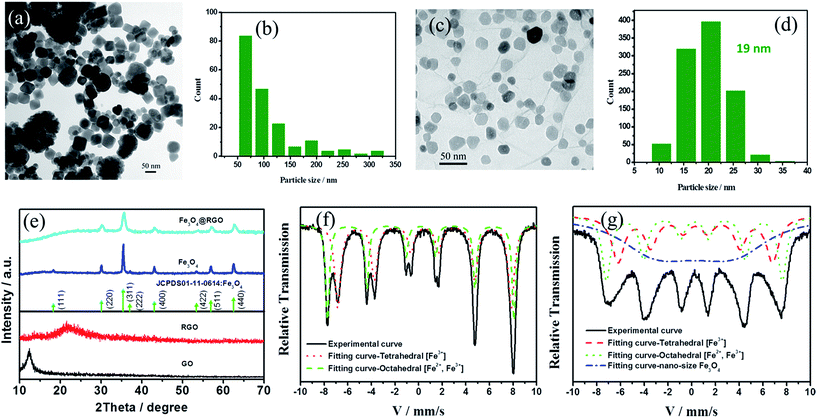
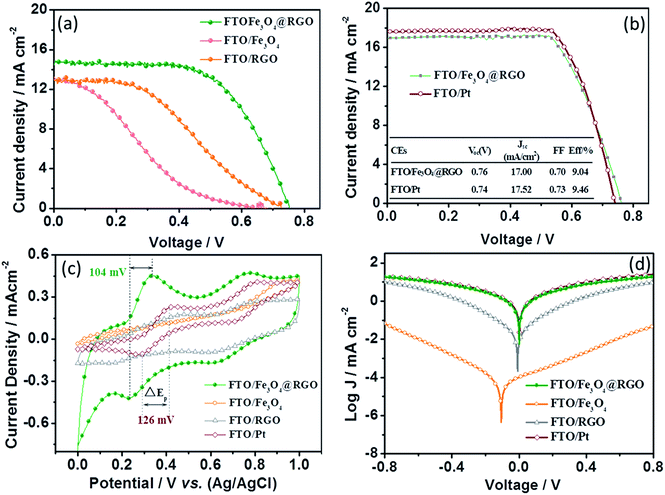
In our experiments, Fe3O4@RGO-NMCC was prepared using a simple one-pot solvothermal approach as shown in Scheme 1. The details of the preparation can be seen in the Experimental section. SEM images in Fig. S1 and S2† illustrate the agglomerated structure of pure Fe3O4 particles and the two-dimensional structure of RGO. The TEM image in Fig. 1a further shows the agglomeration of pure Fe3O4 particles resulting in the non-uniform size of the particles or caking within the range of 50 nm to 330 nm (Fig. 1b). The agglomerated structure of pure Fe3O4 particles reduced catalytic active sites. In addition, the massive grain boundaries in pure Fe3O4 inhibited electron transport.15,16 These two factors decreased the catalytic activity of pure Fe3O4 particles. The transmission electron microscopy (TEM) image of Fe3O4@RGO-NMCC (Fig. 1c) showed that Fe3O4 nanoparticles were highly dispersed and firmly fixed on the surface of RGO, thus preventing agglomeration. The sizes of Fe3O4 nanoparticles on RGO were well within the range of 10 nm to 30 nm, with an average particle size of 19 nm (Fig. 1d). X-ray diffraction patterns of these samples (Fig. 1e) showed that Fe3O4@RGO-NMCC displays a crystalline structure similar to that of pure Fe3O4, which could be indexed to the standard Fe3O4 nanocrystal with a cubic structure (JCPDS01-11-0614). The diffraction peaks of 30.1°, 35.4°, 37.1°, 43.1°, 54.3°, 57.0°, and 62.5° were attributed to the planes of (220), (311), (222), (400), (422), (511), and (440) of Fe3O4, respectively. In addition, the peak width of Fe3O4@RGO-NMCC was larger compared with that of pure Fe3O4, indicating the decrease in the size of Fe3O4 on RGO. This finding was consistent with the SEM result. Mössbauer spectroscopy was performed to examine the super-fine structure in pure Fe3O4 and Fe3O4@RGO. The energy resolution of the Mössbauer spectrum was very high and was used to study the ultrafine interaction between the atomic nucleus and the surrounding environment. The Mössbauer spectrum of pure Fe3O4 could be fitted into two fitting curves, which were associated with the tetrahedral [Fe3+] ions and the octahedral [Fe2+, Fe3+] in the inverse spinel structure.18 In contrast to pure Fe3O4, the Mössbauer spectrum of Fe3O4@RGO-NMCC was fitted to three fitting curves. Among the three fitting curves, two fitting curves corresponded to the tetrahedral [Fe3+] ions and the octahedral [Fe2+, Fe3+] ions in pure Fe3O4. The relatively wide curve fitting was due to the reduced nano-size effect of Fe3O4 in Fe3O4@RGO-NMCC, which resulted in higher surface energy, enhanced quantum effect, faster electronic hopping between [Fe2+] and [Fe3+], and stronger relaxation effect (as in dangling bonds). Compared to the large size of pure Fe3O4, the higher surface energy of the reduced nano-size effect of Fe3O4 in Fe3O4@RGO-NMCC originated from more unsaturated bonds of surface atoms, which are active sites to absorb and catalyze “I3−” to “I−”. The enhanced quantum effect was attributed to the increased atom density of the surface Fe2+ and Fe3+, which promoted electronic transport (hopping) in the electro-catalysis reaction “I3− + 2e− ↔ 3I−”. Thus, these structural effects enhanced the catalytic activity of Fe3O4@RGO-NMCC.The thickness of the counter electrode influences the catalytic activity. Different thicknesses of CEs were prepared by spraying different volumes of Fe3O4@RGO-NMCC dispersion onto the FTO glass substrate. Fig. S3† shows the current density (J)–voltage (V) characteristics of DSCs based on different thicknesses of Fe3O4@RGO-NMCC CEs. The detailed photovoltaic parameters are shown in Table S1.† The photovoltaic devices with approximately 16 μm thick Fe3O4@RGO-NMCC CEs have the best performance. As reference, the same thicknesses of Fe3O4 and RGO were then fabricated into CEs by spraying onto the FTO glass substrate. First, the photovoltaic performance was obtained by characterizing DSCs based on these three CEs under AM1.5, 100 mW cm−2 simulated illumination. For each CE, we fabricated four DSC devices and obtained the mean photovoltaic performance. The detailed photovoltaic parameters are summarized in Table 1. Fig. 2a shows the best photocurrent density with respect to voltage (J–V curve) for the DSCs in each group. The DSCs based on Fe3O4@RGO-NMCC CEs presented a PCE of 6.76%, the highest among the three CEs. Compared with DSCs based on Fe3O4@RGO-NMCC CEs, open-circuit voltage (Voc) and short-circuit current density (Jsc) slightly decreased for DSCs based on Fe3O4 and RGO CEs. Thus, the main factor leading to low PCEs (from 6.76% to 1.92% and 3.71%) was derived from the deterioration of the fill factors of DSCs based on Fe3O4 and RGO CEs (from 0.62 to 0.39 and 0.22). Among the factors determining photovoltaic parameters of the DSCs, large internal resistance and low catalytic activity caused a decrease in fill factor and PCE. A large interparticle boundary in Fe3O4 adversely affected the electron transfer, further increasing the internal resistance of devices, and the less active sites in the RGO should be the reason of the low fill factor of the photovoltaic device. To improve the performance of DSCs based on Fe3O4@RGO-NMCC CEs, TiO2 photoanodes were optimized by TiCl4 treatment. This optimization resulted in a PCE of 9.04%, nearly approaching 9.46% obtained from DSCs based on pyrolytic Pt CEs (Fig. 2b).
| CE | V oc (V) | J sc (mA cm−2) | FF | PCE/% |
|---|---|---|---|---|
| Fe3O4/RGO | 0.76 ± 0.01 | 14.4 ± 0.1 | 0.62 ± 0.01 | 6.76 ± 0.05 |
| Fe3O4 | 0.67 ± 0.02 | 13.2 ± 0.2 | 0.22 ± 0.02 | 1.92 ± 0.03 |
| RGO | 0.74 ± 0.02 | 13.0 ± 0.1 | 0.39 ± 0.01 | 3.71 ± 0.05 |
| Pt | 0.76 ± 0.01 | 12.5 ± 0.2 | 0.74 ± 0.01 | 7.00 ± 0.04 |
The cyclic voltammetry (CV) curve and Tafel polarization curve were obtained to study the catalytic performance and electron transfer in these CEs. Fig. 2c shows the cyclic voltammograms of the I−/I3− redox couple based on Fe3O4, RGO, Fe3O4@RGO-NMCC, and Pt. The peak current of Fe3O4 CEs in CV was extremely small, indicating that a massive interparticle boundary adversely affected electron transport. This poor electron transport was bound to cause the absence of redox peaks for the I−/I3− redox couple. This finding confirmed the results of our J–V curve analysis. Three curves based on RGO, Fe3O4@RGO-NMCC, and Pt CEs exhibited two pairs of redox peaks. The redox peak at low potential was attributed to the reaction: I3− + 2e− ↔ 3I−. The separation between the anodic and cathodic peaks (ΔE) was inversely related to the rate of the above redox reaction and regeneration rate of the I−/I3− redox couple. The ΔE value for Fe3O4@RGO-NMCC CEs (104 mV) was significantly smaller than that for RGO (280 mV) and Pt (126 mV), implying notable catalytic behaviors for the reduction of I3− or I2 to I−. Although the Fe3O4@RGO CE had higher cathodic peak current density and smaller ΔE than the Pt reference, its redox potential (ER) (0.23 V vs. Ag/AgCl) is lower than that of the Pt CE (0.29 V vs. Ag/AgCl), which caused the Fe3O4@RGO CE to deliver a low PCE of 9.04% compared to that of the Pt reference (9.46%) in Fig. 2b. The peak current of RGO in CV was relatively large, indicating that electron transfer readily occurred. However, the redox peak was not prominent, indicating few surface catalytic sites. Using symmetrical cells consisting of two identical CEs, Tafel polarization curves were measured as shown in Fig. 2d. Among the four CEs, Fe3O4 CEs showed the least limited exchange current density, which again demonstrated that massive interparticle boundary detrimentally affected electron transfer. For Fe3O4@RGO-NMCC symmetrical cells, the charge transfer in the Tafel zone was remarkably higher than that of Fe3O4 and RGO, indicating superior catalytic activity. This finding was in good agreement with the CV measurements. Thus, the Fe3O4@RGO-NMCC not only increased the catalytic activity but also accelerated electron transfer between the interfaces, which in turn increased the performance of the corresponding DSCs.
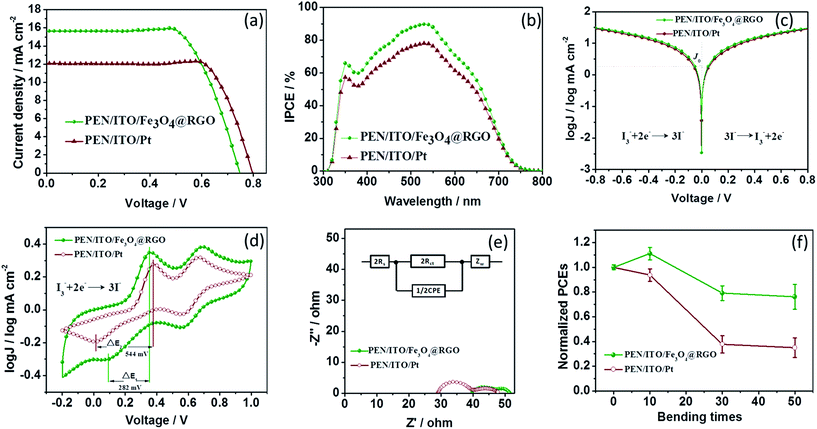
The development of flexible electrodes is the main research direction of current and future portable and curved electronic devices.19–21 Flexible Fe3O4@RGO-NMCC CEs were prepared on a polyethylene naphthalate/indium tin oxide plastic substrate, employing flexible Pt CEs (prepared by chemical reduction) as the reference. The J–V curves of DSCs based on flexible CEs are shown in Fig. 3a. DSCs based on flexible Fe3O4@RGO-NMCC CEs gave a PCE of 8.0%, which was higher than that of DSCs based on flexible Pt (7.35%), which could be attributed to the higher photocurrent density of DSCs based on flexible Fe3O4@RGO-NMCC CEs. Fig. 3b shows the incident-photon-to-current conversion efficiency for DSCs based on flexible Fe3O4@RGO-NMCC and Pt CEs. The integrated currents for DSCs based on flexible Fe3O4@RGO-NMCC and Pt CEs were 15.30 and 11.76 mA cm−2, respectively, agreeing with the J–V results. As for a rigid DSC system, the Fe3O4@RGO CE delivered a low PCE of 9.04% compared to that of the Pt reference (9.46%) in Fig. 2b, whereas the DSCs based on flexible Fe3O4@RGO CEs gave a larger PCE than Pt. The reason for these results was attributed to the different preparing method of Pt on the rigid FTO/glass and flexible PEN/ITO substrate. The Pt on rigid FTO/glass was prepared by a high-temperature pyrolytic method, whereas Pt on the flexible PEN/ITO substrate was prepared by a chemical reduction method because of the instability of the flexible plastic substrate at high temperatures (>150 °C). To confirm superior performance of the flexible Fe3O4@RGO CE to flexible Pt on the PEN/ITO substrate, Tafel-polarization and CV and electrochemical impedance spectroscopy (EIS) were carried out to reveal the catalytic activity and electron transport of flexible CEs.
The exchange current density (J0) (Fig. 3c) for flexible Fe3O4@RGO-NMCC CEs (1.61 mA cm−2) was significantly higher than that for Pt (1.36 mA cm−2), implying its faster electron transfer than that of flexible Pt CEs. The ΔE value for flexible Fe3O4@RGO-NMCC (282 mV) CEs was significantly less than that for Pt (544 mV), implying its superior catalytic behavior to flexible Pt CEs. EIS was used to reveal the inherent interface resistance, with the results shown in Fig. 3e. Meanwhile, an equivalent circuit diagram (Fig. 3e, inset) is provided for fitting Nyquist plots with the Z-view software. Each plot comprised two irregular semicircles, with the first one originating from the charge transfer resistance (Rct) at the CE/electrolyte interface. By contrast, the second semicircle arises from the Nernst diffusion impedance (ZN) of I3−/I− within the electrolyte. Usually, Rct occurs in the high frequency region, whereas the ZN appears in the low frequency region. In addition, the value intercepted on the real axis of the Nyquist plot was attributed to the series resistance (Rs). The fitting results of Nyquist plots are listed in Table 2, which showed that the Rct of DSCs based on flexible Fe3O4@RGO-NMCC CEs (3.85 Ω) was smaller than that of the flexible Pt CE (4.50 Ω). Smaller charge transfer resistance based on flexible Fe3O4@RGO-NMCC CEs facilitated electron transfer. Suitable electron transfers are highly relevant to their structural advantages, e.g., electron hopping between Fe2+ and Fe3+. Electrons were transported freely along a broad two-dimensional conductive surface based on RGO. Thus, the superior catalytic activity and faster electron transport of flexible Fe3O4@RGO CEs enhanced the photocurrent density of the corresponding DSCs. Bending tests (Fig. 3f) indicated that the PCE of DSCs based on flexible Fe3O4@RGO-NMCC CEs could maintain 80% of their initial PCE after bending 50 times. However, the performance of DSCs based on flexible Pt CEs was notably decreased after bending 50 times. As we all know, a two-dimensional material or its thin film has better mechanical flexibility than that of nanoparticles. We ascribed the deterioration in the performance of DSCs based on the flexible Pt CE after bending to its mechanical brittleness (the crack defects on the flexible Pt CE produced by repeated bending). Considering their photovoltaic and anti-bending performance, flexible Fe3O4@RGO-NMCC CEs are ideal. The stability test of DSCs based on Fe3O4@RGO-NMCC CEs was conducted as shown in Fig. 4. After 2000 h, DSCs based on Fe3O4@RGO-NMCC CEs maintained 60% of their initial PCE.
| Flexible CEs | V oc (V) | J sc (mA cm−2) | J sc (mA cm−2) from IPCE | FF | PCE (%) | R s (Ω) | R ct (Ω) |
|---|---|---|---|---|---|---|---|
| PEN/ITO/Fe3O4@RGO | 0.75 ± 0.01 | 15.63 ± 0.2 | 15.30 ± 0.2 | 0.69 ± 0.01 | 8.0 ± 0.02 | 19.6 ± 0.5 | 3.85 ± 0.5 |
| PEN/ITO/Pt | 0.80 ± 0.02 | 12.10 ± 0.1 | 11.76 ± 0.2 | 0.76 ± 0.01 | 7.35 ± 0.01 | 14.6 ± 0.5 | 4.50 ± 0.6 |
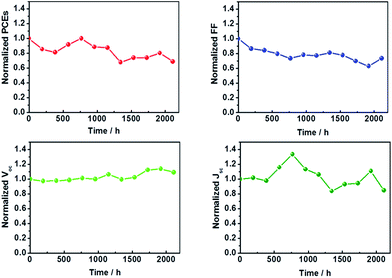 | ||
| Fig. 4 Stability of DSCs based on Fe3O4@RGO-NMCC CEs on the FTO substrate (25 °C, 30% humidity, encapsulation, AM 1.5, 100 mW cm−2). | ||
Conclusions
In summary, we report the generation of nano–micro composite catalysts made of highly dispersed Fe3O4 nanoparticles fixed on RGO sheets as the CE in DSCs using a simple one-pot solvothermal approach. Compared with pure Fe3O4 and RGO CEs, the Fe3O4@RGO-NMCC CE exhibited superior electrocatalysis for the catalytic reduction of the I−/I3− redox couple. Notably, DSCs using rigid and flexible Fe3O4@RGO-NMCC CEs achieved high PCEs reaching 9% and 8% on FTO/glass substrates and flexible polymer substrates, respectively. These values are the highest reported efficiencies for DSCs based on a flexible Pt-free CE. We ascribed the notable catalytic performance of Fe3O4@RGO-NMCC to faster electron hopping between Fe2+ and Fe3+ and free electron transport by broad electron transport-sheets of RGO. Finally, Fe3O4@RGO-NMCC exhibited good anti-bending and stability in the practical application of DSCs.Acknowledgements
This work was financially supported by the Shandong Province Natural Science Foundation (Grant No. BS2015NJ013), Science and Technology Innovation Foundation for the Uinversity or College Students (Grant No. SF2014002), and Research Fund for the Doctoral Program of Liaocheng University (Grant No. 31805).Notes and references
- B. Oregan, M. Grat and zel, Nature, 1991, 353, 737–740 CrossRef CAS.
- S. Mathew, A. Yella, P. Gao, R. Humphry-Baker, B. F. E. Curchod, N. Ashari-Astani, I. Tavernelli, U. Rothlisberger, M. K. Nazeeruddin and M. Graetzel, Nat. Chem., 2014, 6, 242–247 CrossRef CAS PubMed.
- M. J. Ju, J. C. Kim, H.-J. Choi, I. T. Choi, S. G. Kim, K. Lim, J. Ko, J.-J. Lee, I.-Y. Jeon, J.-B. Baek and H. K. Kim, ACS Nano, 2013, 7, 5243–5250 CrossRef CAS PubMed.
- M. J. Ju, I.-Y. Jeon, K. Lim, J. C. Kim, H.-J. Choi, I. T. Choi, Y. K. Eom, Y. J. Kwon, J. Ko and J.-J. Lee, Adv. Mater., 2014, 26, 3055–3062 CrossRef CAS PubMed.
- M. K. Wang, A. M. Anghel, B. Marsan, N. L. C. Ha, N. Pootrakulchote, S. M. Zakeeruddin and M. Gratzel, J. Am. Chem. Soc., 2009, 131, 15976–15977 CrossRef CAS PubMed.
- M. Wu, X. Lin, Y. Wang, L. Wang, W. Guo, D. Qu, X. Peng, A. Hagfeldt, M. Graetzel and T. Ma, J. Am. Chem. Soc., 2012, 134, 3419–3428 CrossRef CAS PubMed.
- A. Kay and M. Gratzel, Sol. Energy Mater. Sol. Cells, 1996, 44, 99–117 CrossRef CAS.
- M. Wu, X. Lin, T. Wang, J. Qiu and T. Ma, Energy Environ. Sci., 2011, 4, 2308–2315 CAS.
- M. J. Ju, I.-Y. Jeon, K. Lim, J. C. Kim, H.-J. Choi, I. T. Choi, Y. K. Eom, Y. J. Kwon, J. Ko, J.-J. Lee, J.-B. Baek and H. K. Kim, Energy Environ. Sci., 2014, 7, 1044–1052 CAS.
- X. Meng, C. Yu, X. Song, Y. Liu, S. Liang, Z. Liu, C. Hao and J. Qiu, Adv. Energy Mater., 2015, 5 DOI:10.1002/aenm.201500180.
- T. Yohannes and O. Inganas, Sol. Energy Mater. Sol. Cells, 1998, 51, 193–202 CrossRef CAS.
- Q. Li, J. Wu, Q. Tang, Z. Lan, P. Li, J. Lin and L. Fan, Electrochem. Commun., 2008, 10, 1299–1302 CrossRef CAS.
- Y. Hou, D. Wang, X. H. Yang, W. Q. Fang, B. Zhang, H. F. Wang, G. Z. Lu, P. Hu, H. J. Zhao and H. G. Yang, Nat. Commun., 2013, 4, 1583 CrossRef PubMed.
- L. Wang, Y. Shi, H. Zhang, X. Bai, Y. Wang and T. Ma, J. Mater. Chem. A, 2014, 2, 15279–15283 CAS.
- Q. Yu, L. A. Jauregui, W. Wu, R. Colby, J. Tian, Z. Su, H. Cao, Z. Liu, D. Pandey, D. Wei, T. F. Chung, P. Peng, N. P. Guisinger, E. A. Stach, J. Bao, S.-S. Pei and Y. P. Chen, Nat. Mater., 2011, 10, 443–449 CrossRef CAS PubMed.
- D. Dimos, P. Chaudhari and J. Mannhart, Phys. Rev. B: Condens. Matter Mater. Phys., 1990, 41, 4038 CrossRef CAS.
- L. Wang, Y. Shi, Y. Wang, H. Zhang, H. Zhou, Y. Wei, S. Tao and T. Ma, Chem. Commun., 2014, 50, 1701–1703 RSC.
- S. W. Lee, S. J. Kim, I. B. Shim, S. Bae and C. S. Kim, IEEE Trans. Magn., 2005, 41, 4114–4116 CrossRef CAS.
- H. Zhou, Y. Shi, D. Qin, J. An, L. Chu, C. Wang, Y. Wang, W. Guo, L. Wang and T. Ma, J. Mater. Chem. A, 2013, 1, 3932–3937 CAS.
- H. Zhou, Y. Shi, K. Wang, Q. Dong, X. Bai, Y. Xing, Y. Du and T. Ma, J. Phys. Chem. C, 2015, 119, 4600–4605 CAS.
- L. Li, Z. Wu, S. Yuan and X.-B. Zhang, Energy Environ. Sci., 2014, 7, 2101–2122 CAS.
Footnote |
| † Electronic supplementary information (ESI) available. See DOI: 10.1039/c5ta06525a |
| This journal is © The Royal Society of Chemistry 2016 |

