 Open Access Article
Creative Commons Attribution 3.0 Unported Licence
Dynamically controlled deposition of colloidal nanoparticle suspension in evaporating drops using laser radiation†‡
V. D.
Ta
*a,
R. M.
Carter
a,
E.
Esenturk
bc,
C.
Connaughton
bd,
T. J.
Wasley
e,
J.
Li
e,
R. W.
Kay
e,
J.
Stringer
fg,
P. J.
Smith
f and
J. D.
Shephard
a
aInstitute of Photonics and Quantum Sciences, Heriot-Watt University, Edinburgh, EH14 4AS, UK. E-mail: d.ta@hw.ac.uk
bWarwick Mathematics Institute, Zeeman Building, University of Warwick, Coventry CV4 7AL, UK
cDepartment of Chemistry, University of Cambridge, Lensfield Road, Cambridge, CB2 1EW, UK
dCentre for Complexity Science, Zeeman Building, University of Warwick, Coventry CV4 7AL, UK
eAdditive Manufacturing Research Group, Loughborough University, Leicestershire, LE11 3TU, UK
fLaboratory of Applied Inkjet Printing, Department of Mechanical Engineering, University of Sheffield, Sheffield, S1 4BJ, UK
gDepartment of Mechanical Engineering, The University of Auckland, Auckland 1142, New Zealand
First published on 4th April 2016
Abstract
Dynamic control of the distribution of polystyrene suspended nanoparticles in evaporating droplets is investigated using a 2.9 μm high power laser. Under laser radiation a droplet is locally heated and fluid flows are induced that overcome the capillary flow, and thus a reversal of the coffee-stain effect is observed. Suspension particles are accumulated in a localised area, one order of magnitude smaller than the original droplet size. By scanning the laser beam over the droplet, particles can be deposited in an arbitrary pattern. This finding raises the possibility for direct laser writing of suspended particles through a liquid layer. Furthermore, a highly uniform coating is possible by manipulating the laser beam diameter and exposure time. The effect is expected to be universally applicable to aqueous solutions independent of solutes (either particles or molecules) and deposited substrates.
Introduction
Self-assembly processes are important phenomena because they have a significant impact on the development of biological systems, and the creation of ensembles of nanostructures and photonic devices.1–7 An example of such a process observed in everyday life would be a coffee drop leaving a ring-like stain once completely evaporated. This process is referred to as the coffee-ring or coffee-stain effect and is frequently observed in most evaporating droplets of micro-/nano-particle suspensions.8–11 This effect has recently attracted a great deal of interest due to its profound influence in many scientific and technical areas.11,12The coffee-stain effect can be useful for several applications such as the assembly of line structures13 and nanochromatography.14 However, due to non-uniform deposition it is undesirable for applications requiring uniform coating, such as high resolution ink-jet printing15,16 and biotechnology.17,18 To overcome this effect, several techniques have been proposed by manipulating capillary flows, changing the particle shape and modifying the surface wettability of the substrate.11,19–25 However, the ability to dynamically control the distribution of the suspended particles during evaporation of droplets has rarely been studied.
It has been shown that infrared light increases surface temperatures of aqueous fluids, and therefore, affects the capillary flow of aqueous droplets.26 This result opens up the opportunity to modify the coffee-stain effect by external radiation. In addition, as lasers have excellent coherence and strong intensities, they are more appropriate compared with a broadband light source for tuning the coffee-stain effect. Indeed, simulations have demonstrated that laser-induced motion in droplets of nanoparticle suspensions greatly influences the final distribution of the particles.27 However, to our knowledge, experimental investigation of this effect has not been studied.
In this work, an infrared laser operating at 2.9 μm is used to study the ability to dynamically control the deposition of nanoparticles in evaporating drops.
Theoretical background
Transport of particles within an evaporating droplet is a complex process where a number of physical effects are involved. However, as was reviewed in the Larson survey,28 dimensional analysis reveals the mechanisms that have the largest influence in determining the final deposition patterns. Under the conditions of our experimental setup, mass and heat transfer effects are more dominant while other effects are of secondary importance. Therefore the governing mathematical equations, assuming cylindrical symmetry, can be set up as follows:| ∂c(x,t)/∂t = DΔc | (1) |
Coupled to the mass-balance equation we have the energy balance equation in the form of the heat equation given as
| ∂T(x,t)/∂t = KΔT + q(x,t) | (2) |
These equations are solved with respect to the appropriate boundary conditions. To determine the evaporation dynamics one has to solve eqn (1) and (2) simultaneously together with the appropriate boundary conditions which will be done explicitly in a forthcoming paper.
Experimental section
Materials
Polystyrene (PS) suspension (∼0.3% solids) was used in all experiments. It was obtained by diluting commercial 2% solid PS monodisperse aqueous suspension (microspheres, particle size of 0.5 μm, standard deviation <0.05 μm, Sigma-Aldrich) with deionized water. To obtain a uniform dispersion, the solution was kept in an ultrasonic bath for ∼10 minutes. The substrate used for droplet deposition was a 1 mm-thick stainless steel sheet (304S15, RS components).Optical setup
The laser beam from a continuous wavelength Sheaumann DRV-002 compact high power laser with a wavelength of ∼2.9 μm was guided and focused (the focal plane is at the substrate surface) normal to the substrate. The irradiated droplet was monitored using a Unibrain 1394 camera at an angle of ∼40° to the normal of the substrate. Furthermore, the laser spot was captured and analyzed using an infrared camera (Electrophysics, PV320). All experiments were done under ambient conditions with a temperature of ∼22 °C and a relative humidity of 30–45%.Surface characterization
Three-dimensional (3D) profiles of the final distributions of the PS nanoparticles were obtained using an Alicona microscope (using z-stack measurements obtained from IF-MeasureSuite Version 5.1). Prior to optical measurements, the samples were coated with a thin metallic layer (Chromium, ∼0.8 μm) through RF sputtering. This is done to improve surface reflectivity and thus obtain improved signals from the microscope.Results and discussion
Water has a strong absorption at 2.9 μm,29 which dictated the selection of the infrared laser used in this work. The irradiated laser energy is absorbed by the water drop and this radiation energy is transferred to heat, which results in a temperature gradient and strong evaporating flux in the illuminated region. Fig. 1 shows the schematic of the optical setup where a droplet is heated by a focused beam normal to the surface. In addition, as the laser beam diameter gradually decreases from the focused lens to the droplet, the effect of the laser diameter on the distribution of PS nanoparticles could be studied by simply translating the substrate vertically through the laser beam (z direction). The substrate could also be translated relative to the laser in the y direction. | ||
| Fig. 1 Schematic of the optical setup used for controlling and observing deposition of colloidal nanoparticles in evaporating droplets. | ||
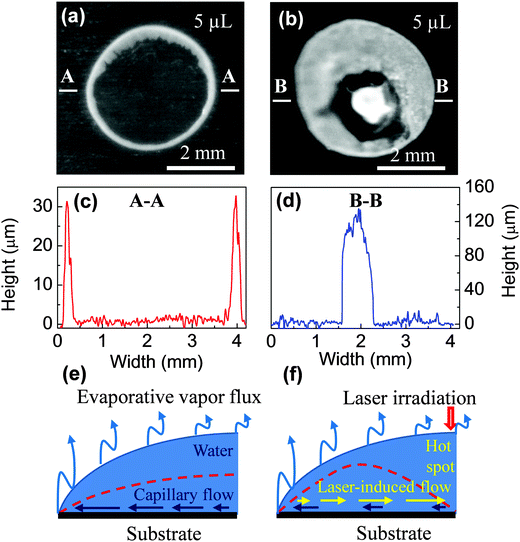
Fig. 2a and b present the final distribution of PS nanoparticles without external radiation and with laser irradiation, respectively. It can be seen that the patterns indicate a typical “coffee-stain” and a reverse of “coffee-stain”, respectively. For the first case, all materials were deposited at the rim of the droplet. In contrast, for the second case, nearly all particles were accumulated at a ∼0.7 mm-diameter spot in the central region of the droplet. In order to obtain the particle distribution in the vertical (z) direction, a 3D surface morphology of these samples was measured out and the results are presented in Fig. S1 and S2 (ESI‡).
Fig. 2c and d show the cross-sectional profiles of the patterns (extracted from the above 3D distribution). For the “coffee-ring” structure, there are two clear peaks in the edge representing high particle accumulation whereas in the middle there is essentially zero particle deposition (Fig. 2c). In contrast, for the reverse of the “coffee-ring” pattern, the profile shows a high density of particles in the middle of the droplet with comparatively few particles at the edge (Fig. 2d). The pattern height of the laser-induced structure is ∼120 μm, which is 4 times larger than ∼30 μm of the ring. The result demonstrates that infrared laser beams can effectively attract suspension particles and accumulate them in an area that is much smaller than the original droplet size.
The mechanism of the coffee-stain effect has been well-studied.8,9 As shown in Fig. 2e, the contact line remains pinned during evaporation, and thus the contact angle decreases, which results in capillary flow from the droplet's centre to its rim, and a corresponding ring-like structure is obtained (ESI,‡ Video 1).11 Conversely, when the droplet is illuminated with a laser beam, it is locally heated in the irradiated region and the localized heating induces flow. This process overcomes the capillary flow and leads to the accumulation of particles towards the laser spot (ESI,‡ Video 2).
It is suggested that the effect of laser radiation leads to two major flows: (i) the thermo-capillarity due to the temperature gradient26,27 and (ii) the replenishing of the large amount of water lost by intense radiation. Previous work has shown that the presence of recirculating Marangoni flows acts to reverse the coffee-stain effect.19 In the same work it was also stated that such flows do not tend to occur in water, with the experimentally determined flow being orders of magnitude lower than that determined by theory. The temperature gradient imposed by the incident laser, however, is orders of magnitude greater than that observed under ambient conditions, which may be sufficient to induce a Marangoni flow.
The intense radiation and subsequent heating will also lead to significantly greater evaporation at the center of the droplet compared to the edge, in direct contrast to the relative evaporative loss observed under ambient conditions.8 This effect can consequently lead to a reversal of flow due to the evaporative loss of liquid and contribute to the accumulation of particles.
It is worth noting that other effects such as optical trapping and modification of the particles due to laser heating are negligible because of the following reasons. Firstly, the laser energy is strongly absorbed by the water in the aqueous suspension at the droplet's surface. Indeed, at 2.9 microns the absorption of water is around 106 m−1. This gives a penetration depth of only ∼1 micron. Secondly, the PS particles constitute only a tiny fraction (∼0.3%) of the solution. Their motion is predominantly determined by the flow of the liquid which is a common assumption in the literature. Finally, at low concentration one can safely assume that the PS particles and the liquid in the immediate neighbourhood have the same temperature at any time which will not cause any heat-driven local disturbance. Furthermore, the collective diffusion of charged PS particles driven by long-ranged interactions such as the electrostatic interaction30 is also insignificant as the net interaction of the PS particles is believed to be short range.
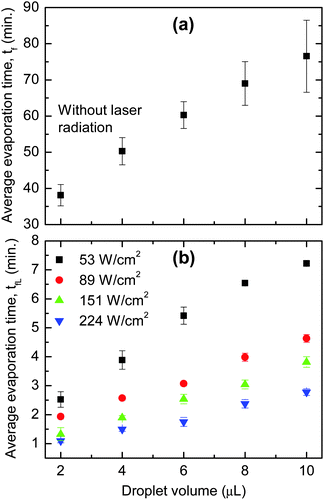
As discussed above, the higher temperature at the point of heating causes a reversal of flow, which is primarily responsible for the accumulation of particles at droplet's centre. To support this idea, the evaporation time (measured from the time a droplet is deposited until the evaporation is complete) for drops with and without external radiation (represented as tfL and tf, respectively) was investigated. Fig. 3 shows that tf is at least one order of magnitude longer than tLf. For example, it takes ∼60 min for a typical 6 μL droplet to completely dry but only ∼5 to 1.5 min when it is irradiated with a power density of 53 and 224 W cm−2, respectively. The fast evaporation means a large fluid loss at the point of heating, and therefore, fluid will flow from other parts of the droplet towards the laser spot to replenish.
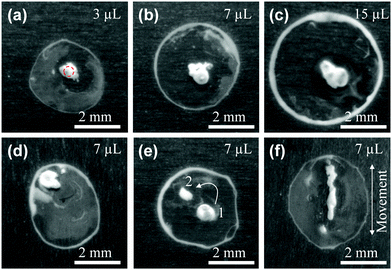
The effect of the droplet volume on the final distribution of the particles was studied. Fig. 4a–c present the pattern for 3, 7, and 15 μL droplets, respectively. It is clear that the droplet size does not strongly influence the pattern formation as a reverse coffee-stain effect is observed for the three cases. However, the ring-like structure becomes more obvious (more particles go to the edge) with an increase of droplet size. For a larger droplet the evaporation time is longer and hence the particles have more time to transfer from the droplet centre to the edge via capillary flow. As a result, more particles are deposited at the rim and thus make the contact line visible.
The ability to concentrate nanoparticles in the selected areas (within a droplet) with arbitrary configurations has potential applications in biotechnology,18 assembly of colloidal nanomaterials,31 and disordered photonic devices such as random lasers.32,33Fig. 4d indicates that a high particle density spot can be obtained toward the edge of the droplet. It is also possible to distribute particles in multiple locations within the confines of the droplet by sequentially illuminating more than one location during droplet evaporation. In Fig. 4e, the laser beam was irradiated at position 1 for ∼0.65tfL (tfL is the total evaporation time of a droplet when it is exposed to the laser) and moving to position 2 afterward where the laser was kept motionless until the evaporation is complete. Interestingly, a line structure can be achieved by moving the droplet relative to the laser beam (Fig. 4f). It is expected that more complex structures can be fabricated using a galvanometer scan head or using a mask,34 which raises the possibility for direct laser writing of suspended particles through a liquid layer.
A uniform coating is highly desirable for applications such as ink-jet printing.15,16 Several approaches have been investigated for homogeneous deposition by controlling the shape of particles11 or using a surfactant and a surface-adsorbed polymer.35 Another alternative is controlling evaporative fluid flow. Modifying the evaporation rate can possibly enhance the classical coffee-stain effect or produce a total flow inversion,36 and uniform deposition is thus suggested to be possible by balancing the two opposing processes. The use of an imposed temperature gradient to control the flow of solute within a droplet has been previously demonstrated by varying the substrate temperature.16 Similar results to those presented herein were found, with the suppression of coffee staining found to occur when the temperature in the centre of the droplet was higher than that at the edge.
We demonstrate two methods that have the potential to achieve homogeneous deposition. The first approach is by increasing the ratio between the laser diameter and the droplet size (the laser power is unchanged). The second is through shortening the exposure time. However, both techniques have the same physical mechanism. It has been indicated (Fig. 2f) that when a droplet is illuminated in the central region by a laser beam, there will be primarily two opposing processes. The capillary flow drives particles from the centre of the droplet to the edge and the laser-induced flows force particles to go to the centre. Overall, if the capillary flow is dominant, the formed pattern will tend towards a coffee-stain-like appearance. Otherwise, the reverse of coffee-stain will be obtained. As a result, uniform deposition is only possible when the two processes are in equilibrium, which can be achieved by manipulating laser parameters.
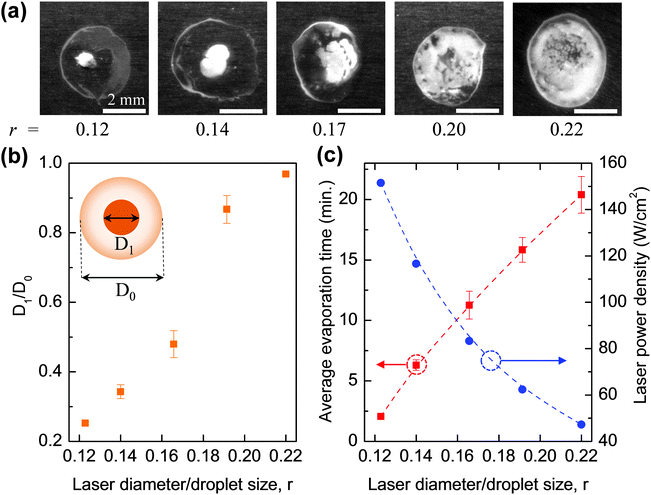
In Fig. 5a, the pattern formed demonstrates a clear transition from the reverse of the coffee-stain to uniform coating by increasing the laser diameter. To get a quantitative evaluation, it is assumed that the droplet size and the spot at the droplet's centre (which has the highest particle density) are both circular with diameters of D1 and D0, respectively (the inset of Fig. 5b). With this assumption, D1/D0 can be plotted as a function of r – the ratio between the laser diameter and the initial droplet size (estimated to be ∼3.5 mm for ∼5 μL droplets). From Fig. 5b, it can be seen that D1/D0 increases sharply with r. For r = 0.12, D1/D0 is only 0.25 but it shows a significant increase to 0.48 when r increases to 0.17. For r around or smaller than 0.17, particles are still accumulated in the central region of the droplet. However, when r reaches 0.22, particles are distributed over a region that is over 90% of the droplet area (ESI,‡ Video 3). The 3D profile of the formation pattern was measured and is presented in Fig. S3 (ESI‡). The result indicates that a highly uniform distribution of PS particles was achieved.
The results obtained above can be explained by the change of laser power density. As shown in Fig. 5c, when the laser diameter increases, its power density decreases (as the power of the laser beam is fixed during the experiments) so that evaporation time increases correspondingly. As discussed earlier, for r < 0.17 the evaporation time is short (<10 min), and the laser-induced flows dominate over the capillary flow so the reverse of the coffee-stain effect is obtained. However, as the laser diameter becomes larger, and the laser power density decreases, the evaporation time increases. This gives time for the thermal energy from the radiation to dissipate into the bulk of the droplet and reduce the thermal gradient induced by the laser. This in turn reduces the flow of particles towards the laser spot and allows the conventional capillary flow to have a greater influence on particle motion. It was found that the two competing flows became balanced when r = 0.22, and thus a uniform coating was obtained.
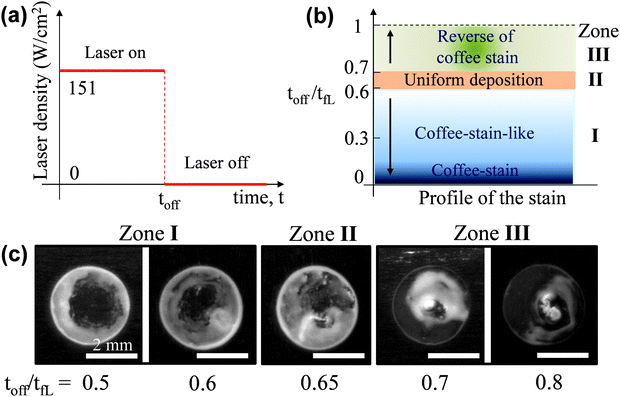
The second approach to get a uniform deposition is by shortening the exposure time; the working principle is schematically demonstrated in Fig. 6a. Firstly, a droplet is irradiated by a laser beam for a certain time, the so-called toff, which is normally less than the tfL (discussed earlier in Fig. 3b). After that time the laser radiation is blocked and at that moment the evaporation is not complete. This process initially drives particles to the centre of the droplet while being irradiated. The droplet was then left to dry without external heating. During this time, the capillary flow will spread particles, which were highly accumulated in the central region, to the whole droplet area. By varying the toff, patterns with different properties are observed (Fig. 6b). Clearly, if toff = 0, the droplet is not heated by the laser so a typical coffee-stain will be obtained. When 0 < toff/tfL < 0.6 (referred as zone 1) the resulting pattern is a coffee-stain-like structure while 0.6 < toff/tfL ≤ 1 (zone 3) results in a reverse of coffee-stain. There is a narrow window where toff/tfL ∼ 0.65 (zone II), and an approximate uniform coating is obtained (ESI,‡ Video 4). Fig. 6c shows formation patterns for toff/tfL = 0.5–0.8, where the transition from the coffee-stain-like structure to uniform coating and reverse of coffee-stain are clearly seen.
It is proposed that the laser induced-flows primarily affect the aqueous suspension. As a result, with a slight modification of laser parameters, similar results can be obtained for different solutes such as PS nanospheres with a standard size of 0.1 μm and organic molecules. Fig. S4 (ESI‡) shows a reversal of the coffee-stain and uniform deposition of droplets containing Rhodamine B molecules on a glass substrate. As a result, our approach should be universally applicable to a variety of research fields, with the proviso that the imposed temperature is not large enough to affect the eventual functionality of the formed pattern. An example of a potential application would be in biotechnology where a facile method for arbitrarily patterning tissues and biomarkers would be desirable.37
Conclusions
The effect of the laser diameter, laser power density and exposure time on fluid flows, evaporation time and resultant distribution of suspended nanoparticles in evaporating droplets has been demonstrated. Due to the localized heating, laser-induced flows drive particles to move and accumulate in any chosen area (within the droplet) with a selective pattern size. Deposited spots can be one order of magnitude smaller than the initial droplet size. This effect has potential applications in biotechnology and disordered photonic devices where high particle density and minimum deposition space are highly important. Interestingly, by scanning the laser beam over the droplet, particles can be deposited in an arbitrary pattern, which opens an opportunity for direct laser writing through suspension liquids. Uniform coatings can also be achieved by manipulating the laser diameter or exposure time, which has potential significance for applications requiring uniform coatings such as ink-jet printing.Acknowledgements
This work is funded by the UK Engineering and Physical Sciences Research Council under grants EP/L017431/1, EP/L017350/1, EP/L016907/1 and EP/L017415/1.References
- G. M. Whitesides and B. Grzybowski, Science, 2002, 295, 2418–2421 CrossRef CAS PubMed.
- J. Xu, J. F. Xia, S. W. Hong, Z. Q. Lin, F. Qiu and Y. L. Yang, Phys. Rev. Lett., 2006, 96, 066104 CrossRef PubMed.
- E. Rabani, D. R. Reichman, P. L. Geissler and L. E. Brus, Nature, 2003, 426, 271–274 CrossRef CAS PubMed.
- M. Byun, R. L. Laskowski, M. He, F. Qiu, M. Jeffries-El and Z. Q. Lin, Soft Matter, 2009, 5, 1583–1586 RSC.
- V. D. Ta, R. Chen and H. D. Sun, Adv. Mater., 2012, 24, OP60–OP64 CrossRef CAS PubMed.
- J. F. Galisteo-López, M. Ibisate, R. Sapienza, L. S. Froufe-Pérez, Á. Blanco and C. López, Adv. Mater., 2011, 23, 30–69 CrossRef PubMed.
- V. D. Ta, R. Chen, D. M. Nguyen and H. D. Sun, Appl. Phys. Lett., 2013, 102, 031107 CrossRef.
- R. D. Deegan, O. Bakajin, T. F. Dupont, G. Huber, S. R. Nagel and T. A. Witten, Nature, 1997, 389, 827–829 CrossRef CAS.
- H. Hu and R. G. Larson, J. Phys. Chem. B, 2002, 106, 1334–1344 CrossRef CAS.
- T. P. Bigioni, X.-M. Lin, T. T. Nguyen, E. I. Corwin, T. A. Witten and H. M. Jaeger, Nat. Mater., 2006, 5, 265–270 CrossRef CAS PubMed.
- P. J. Yunker, T. Still, M. A. Lohr and A. G. Yodh, Nature, 2011, 476, 308–311 CrossRef CAS PubMed.
- W. Han and Z. Q. Lin, Angew. Chem., Int. Ed., 2012, 51, 1534–1546 CrossRef CAS PubMed.
- S. Magdassi, M. Grouchko, D. Toker, A. Kamyshny, I. Balberg and O. Millo, Langmuir, 2005, 21, 10264–10267 CrossRef CAS PubMed.
- T.-S. Wong, T.-H. Chen, X. Shen and C.-M. Ho, Anal. Chem., 2011, 83, 1871–1873 CrossRef CAS PubMed.
- J. Park and J. Moon, Langmuir, 2006, 22, 3506–3513 CrossRef CAS PubMed.
- D. Soltman and V. Subramanian, Langmuir, 2008, 24, 2224–2231 CrossRef CAS PubMed.
- R. Blossey and A. Bosio, Langmuir, 2002, 18, 2952–2954 CrossRef CAS.
- V. Dugas, J. Broutin and E. Souteyrand, Langmuir, 2005, 21, 9130–9136 CrossRef CAS PubMed.
- H. Hu and R. G. Larson, J. Phys. Chem. B, 2006, 110, 7090–7094 CrossRef CAS PubMed.
- H. B. Eral, D. M. Augustine, M. H. G. Duits and F. Mugele, Soft Matter, 2011, 7, 4954–4958 RSC.
- A. Crivoi and F. Duan, J. Phys. Chem. B, 2013, 117, 5932–5938 CrossRef CAS PubMed.
- Y.-F. Li, Y.-J. Sheng and H.-K. Tsao, Langmuir, 2013, 29, 7802–7811 CrossRef CAS PubMed.
- J. Mu, P. Lin and Q. Xia, Appl. Phys. Lett., 2014, 104, 261601 CrossRef.
- V. D. Ta, A. Dunn, T. J. Wasley, J. Li, R. W. Kay, J. Stringer, P. J. Smith, C. Connaughton and J. D. Shephard, Appl. Surf. Sci., 2016, 365, 153–159 CrossRef CAS.
- D. Noguera-Marín, C. L. Moraila-Martínez, M. A. Cabrerizo-Vílchez and M. A. Rodríguez-Valverde, Langmuir, 2014, 30, 7609–7614 CrossRef PubMed.
- A. K. Thokchom, A. Gupta, P. J. Jaijus and A. Singh, Int. J. Heat Mass Transfer, 2014, 68, 67–77 CrossRef CAS.
- M. Dietzel and D. Poulikakos, Phys. Fluids, 2005, 17, 102106 CrossRef.
- R. G. Larson, AIChE J., 2014, 60, 1538–1571 CrossRef CAS.
- J. E. Bertie and Z. Lan, Appl. Spectrosc., 1996, 50, 1047–1057 CrossRef CAS.
- A. Merlin, J. Angly, L. Daubersies, C. Madeira, S. Schöder, J. Leng and J.-B. Salmon, Eur. Phys. J. E: Soft Matter Biol. Phys., 2011, 34, 58 CrossRef CAS PubMed.
- Y. Gao, V. D. Ta, X. Zhao, Y. Wang, R. Chen, E. Mutlugun, K. E. Fong, S. T. Tan, C. Dang, X. W. Sun, H. Sun and H. V. Demir, Nanoscale, 2015, 7, 6481–6486 RSC.
- D. S. Wiersma, Nat. Phys., 2008, 4, 359–367 CrossRef CAS.
- Y. Wang, V. D. Ta, Y. Gao, T. C. He, R. Chen, E. Mutlugun, H. V. Demir and H. D. Sun, Adv. Mater., 2014, 26, 2954–2961 CrossRef CAS PubMed.
- S. N. Varanakkottu, M. Anyfantakis, M. Morel, S. Rudiuk and D. Baigl, Nano Lett., 2016, 16, 644–650 CrossRef CAS PubMed.
- H. Kim, F. Boulogne, E. Um, I. Jacobi, E. Button and H. A. Stone, 2016, arXiv preprint arXiv:1602.07937.
- A. Marin, R. Liepelt, M. Rossi and C. J. Kahler, Soft Matter, 2016, 12, 1593–1600 RSC.
- S. V. Murphy and A. Atala, Nat. Biotechnol., 2014, 32, 773–785 CrossRef CAS PubMed.
Footnotes |
| † All relevant data present in this publication can be accessed at http://dx.doi.org/10.17861/222eda1f-ba44-42e9-8e6e-ab7f9d1095f4 |
| ‡ Electronic supplementary information (ESI) available: Fig. S1–S3 show three dimensional profiles of formation patterns. Fig. S4 demonstrates optical images of distribution of dye molecules on a glass substrate without and with laser radiation. Movies S1–S4 demonstrate the coffee-stain effect, reverse of the coffee-stain effect and uniform deposition. See DOI: 10.1039/c6sm00465b |
| This journal is © The Royal Society of Chemistry 2016 |

