DOI:
10.1039/C6SM00296J
(Paper)
Soft Matter, 2016,
12, 3760-3769
Mean squared displacement from fluorescence correlation spectroscopy†
Received
3rd February 2016
, Accepted 4th March 2016
First published on 4th March 2016
Abstract
Under certain conditions, the mean squared displacement (MSD) can be retrieved from fluorescence correlation spectroscopy (FCS) measurements. However, in the general case this procedure is not valid, and the apparent MSD obtained from FCS data may substantially differ from the true one. In this work we discuss under which conditions this procedure can be applied. Furthermore, we use computer simulations to obtain the MSD and the apparent MSD for the diffusion of a single polymer chain under various approximations. Based on the simulation results we discuss the reliability of the apparent MSD obtained from FCS, showing that it systematically deviates from the true MSD. We also propose a general procedure to verify the reliability of the apparent MSD by measurements at various focal spot sizes.
1 Introduction
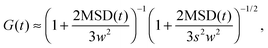
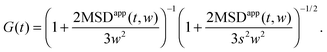
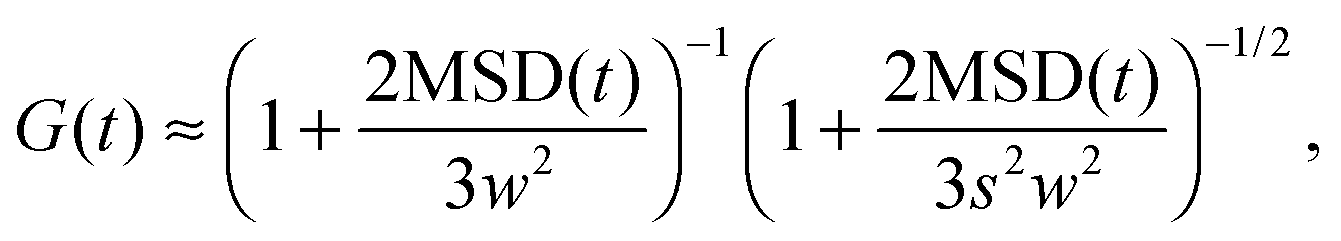
Fluorescence correlation spectroscopy (FCS) has become a well established single-molecule technique, which allows for selective measurement of diffusion of fluorescent molecules (fluorophores) in a non-fluorescent matrix.1,2 Due to its non-invasiveness, it has become particularly popular in biophysical applications.2,3 In the last years, it has gained in significance also in traditional macromolecular and colloid science, which deals with synthetic macromolecules, rather than biological ones.4–12 In a typical FCS measurement a micron-sized sample volume is irradiated by an excitation laser. When a fluorophore is found within the focused volume, it is excited and emits fluorescence. Fluorophores diffusing in and out of the focal volume cause fluctuations of the fluorescence intensity. The primary quantity measured in FCS is the autocorrelation function of the intensity fluctuations, G(t) (see eqn (2) in Section 2.1). In the case of normal diffusion of point-like fluorophores, and Gaussian molecule detection function, G(t) is linked by a simple relation to the diffusion coefficient, D, the waist diameter of the focal volume, w, and its asymmetry s:13| | 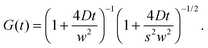 | (1) |
The diffusion time, τD = w2/4D is often introduced as a characteristic decay time of G(t). Since for normal diffusion the mean squared displacement is MSD(t) = 6Dt, it is possible to replace τD in eqn (1) to obtain G(t) in terms of MSD(t) (see eqn (14) in Section 2.1), which can be inverted to obtain MSD(t) from G(t). This approach has been first used to measure the MSD(t) of fluorescently labeled DNA exhibiting Rouse dynamics.14 Since then, it has been used by many researchers to investigate diffusive motion of various fluorescently labeled species.15–21 In particular, the plot of MSD(t) obtained from G(t) has been used to identify anomalous diffusion – subdiffusive or superdiffusive processes. This approach has been questioned by some researchers in the context of the limits of optical resolution.22 Others have claimed that if the subdiffusive behaviour is not supported by an appropriate microscopic model, the apparent subdiffusion can correspond to a crossover regime on intermediate time scales, which incidentally fall into the window covered by FCS,23 or can result from a combination of several diffusive processes with similar characteristic time scales.6,7 As we explain in full detail in Section 2.1, if the motion of particles is not described by normal diffusion, the inversion of G(t) does not yield exactly MSD(t). This fact is usually neglected in the analysis of experimental results. In this work we address the question of how much the apparent mean-squared displacement, MSDapp(t), obtained by the inversion of G(t), may differ from the actual MSD(t). For this purpose, we performed computer simulations of a model system consisting of a single fluorescently labeled polymer chain diffusing in a dilute solution. From the simulation trajectory, we compute the fluorescence intensity autocorrelation function and invert it to obtain MSDapp(t), which we then compare to the actual MSD(t) obtained from the same trajectory. This model system has been used in the FCS experiments of Shusterman et al.,14,18 where the relation between MSD(t) and G(t) was first introduced. It is a well known problem of polymer science, therefore simple analytical models are available for which the scaling of MSD(t) is known from the theory, and they are briefly reviewed in Section 2.2.
2 Theoretical background
2.1 Fluorescence correlation spectroscopy
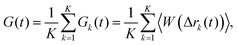
The fluorescence intensity autocorrelation function can be defined as| | 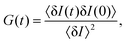 | (2) |
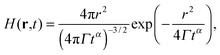
where δI(t) = I(t) − 〈I〉 denotes the fluorescence intensity fluctuation at time t, and the angular brackets denote the ensemble averaging over time. Note that if G(t) is normalized by the square of the absolute intensity, an additional pre-factor 〈δI〉2/〈I〉2 is introduced, with the physical meaning of the inverse average number of fluorophores in the focal volume.2,24 Let us denote by W(r) the probability density that a photon emitted by a fluorophore at position r is detected – often called the molecule detection function. It is often approximated by a Gaussian form:2,24| | 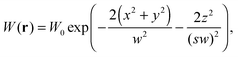 | (3) |
where r = (x, y, z) and W0 is a constant pre-factor proportional to the excitation beam intensity and to the fluorophore concentration. The parameter w represents the diameter of the excitation beam in the x and y directions, perpendicular to the optical axis. The parameter s defines the asymmetry of the excitation beam in the z direction parallel to the optical axis.
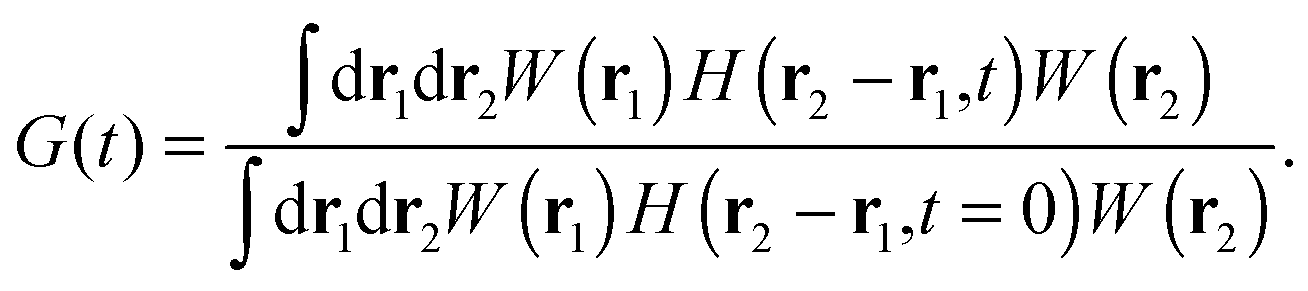
We can express G(t) as a convolution of the molecule detection function and the Van Hove correlation function,13H(r2 − r1,t), which is the probability of finding a diffusant at r2 at time t, provided that it was at r1 at time t = 0:
| | 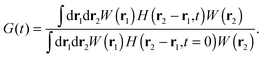 | (4) |
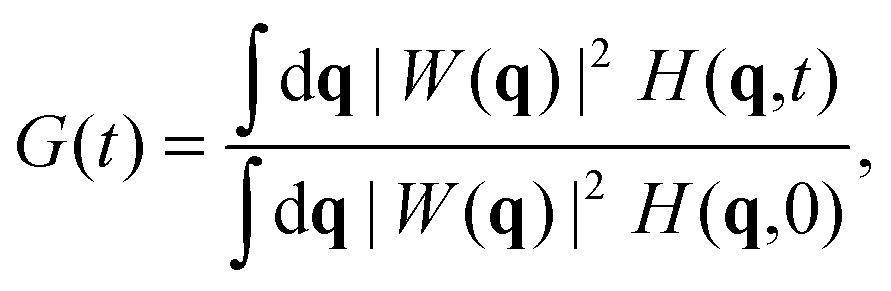
In a homogeneous and isotropic system the Van Hove correlation function depends only on the magnitude of the displacement vector, Δr(t) = r2(t) − r1(0). Upon Fourier transformation, the convolution transforms to a product and eqn (4) becomes:
| |  | (5) |
where
| | | H(q,t) = 〈e−iq·Δr(t)〉, | (6) |
and
| | 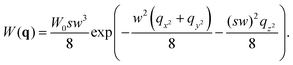 | (7) |
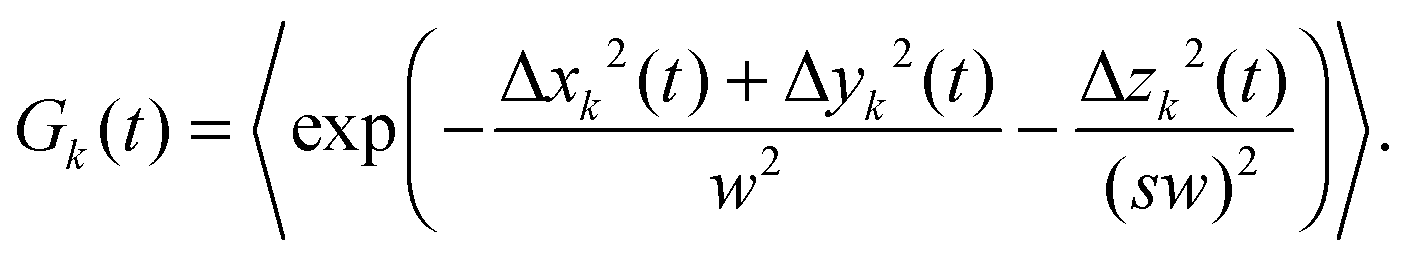
At high dilutions individual fluorophores are not correlated with each other, so that the distinct contribution to the correlation vanishes and only the self contribution remains.
25 Integrating
eqn (7) over
q we obtain for fluorophore
k:
| |  | (8) |
If different fluorophores are not equivalent but still mutually uncorrelated, then
G(
t) is a simple average over the autocorrelation functions of individual fluorophores:
| |  | (9) |
where the index
k denotes a particular fluorophore, and
K denotes the total number of fluorophores.
Eqn (9) is useful for simulations because it allows us to calculate
G(
t) from the simulation trajectory as an alternative to explicitly considering individual photophysical events (excitation and emission).
26 The limitation of
eqn (9) is that it requires all photophysical processes to relax on a shorter time scale than that of the intensity correlations. At the same time it greatly enhances the statistical quality of the data, because the result is averaged over all possible mutual positions of the diffusant and the focal spot, and is not limited by the flux of photons. This enhancement of statistics appears essential, since the statistical error of the computed
G(
t) increases with
t and quickly becomes greater than the actual measured value.
Provided that motions along all three Cartesian axes are independent, denoted by β ∈ {x, y, z}, we can express H(q,t) as a cumulant expansion:
| | 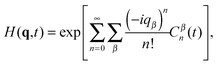 | (10) |
where
Cβn are cumulants of the order
n for motion along coordinate
β. If the motions along different axes are not independent, additional cross terms appear in
eqn (10). In an isotropic system
H(−
q,
t) =
H(
q,
t) and odd cumulants vanish. Then the first three non-vanishing cumulants are:
| | | Cβ2(t) = 〈Δrβ2(t)〉 = 〈Δr2(t)〉/3 = MSD(t)/3, | (12) |
| | | Cβ4(t) = 〈Δrβ4(t)〉 − 〈Δr2(t)〉. | (13) |
Truncating the expansion in
eqn (10) at
n = 2, substituting
W(
q) from
eqn (7) into
eqn (5) and integrating over
q, we obtain
| |  | (14) |
which is the well known equation, commonly used to obtain MSD(
t) from experimentally measured
G(
t). The argument that
eqn (14) can be obtained as a truncation of the cumulant expansion has been originally presented to us by J. Enderlein in a private communication. Very recently, a similar argument has been published by Phillies.
27 Only if
H(
r,
t) is Gaussian,
i.e. of the form
| |  | (15) |
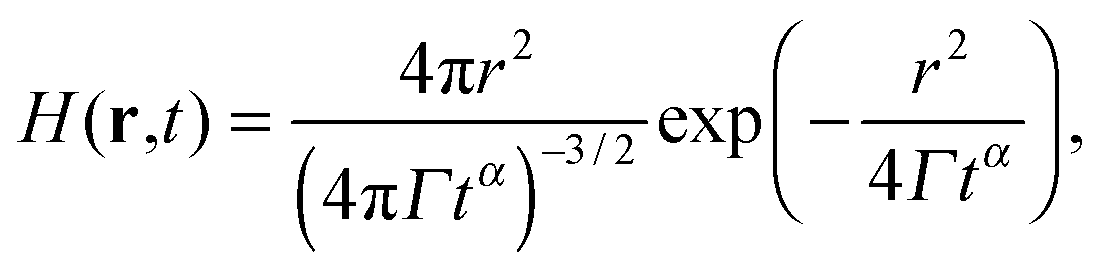
then higher order cumulants vanish and
eqn (14) becomes an exact relation. Here the proportionality constant
Γ can be viewed as a generalized form of the diffusion coefficient. In the special case of
α = 1 we attain normal diffusion and
Γ becomes equivalent to the normal diffusion coefficient. In the case of 0 <
α < 1 or
α > 1, we attain subdiffusion or superdiffusion, respectively. In complex fluids, however, Gaussian approximation to the Van Hove correlation function is generally invalid
27,28 as soon as the underlying process is not normal diffusion. The form given in
eqn (15) is just one of the infinite amount of possibilities, that lead to the subdiffusive scaling of MSD(
t). Different microscopic models which predict subdiffusion lead to other forms of
H(
r,
t),
29 and we are not aware of any microscopic models that would lead to the form of
eqn (15). Therefore, one should in principle verify that the assumption of Gaussian
H(
r,
t) is satisfied, before using
eqn (14) to obtain MSD(
t) from
G(
t). However, if
H(
r,
t) was accessible experimentally, then MSD(
t) could be computed directly from
H(
r,
t), without the need to extract it from
G(
t).
We adopt a different approach to verify the applicability of eqn (14). For this purpose, we implicitly define the apparent mean squared displacement, MSDapp(t,w), in analogy with eqn (14):
| |  | (16) |
Then we use computer simulations of different model systems and compare the true MSD(
t), computed from the particle trajectory, with the apparent MSD
app(
t,
w) obtained from
G(
t), which in turn is obtained from the same simulation trajectory. Here we emphasize that while the mean squared displacement is unique for a given simulation trajectory, this is not necessarily true for the apparent one, which can depend on the focal spot size,
w, and asymmetry,
s. Comparing MSD
app(
t,
w) obtained for different values of
w to MSD(
t), we can quantify the systematic error of MSD
app(
t,
w), introduced by truncating the expansion in
eqn (10).
2.2 Diffusion of polymer chains in dilute solutions
In this section we review some theoretical results for the diffusion of single polymer chains in dilute solutions. These will be important for the subsequent discussion of MSD(t) and MSDapp(t) obtained from simulations. We particularly focus on the Rouse model, which considers an ideal chain consisting of N segments connected with harmonic springs, without any excluded volume interactions. We denote the mean squared displacement of segment k as| | | MSDk(t) ≡ g1,k(t) = 〈[rk(t) − rk(0)]2〉, | (17) |
where the angular brackets denote averaging over different time origins. MSD(t) averaged over all monomers of the chain, has been conventionally denoted by g1(t):30| | 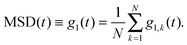 | (18) |
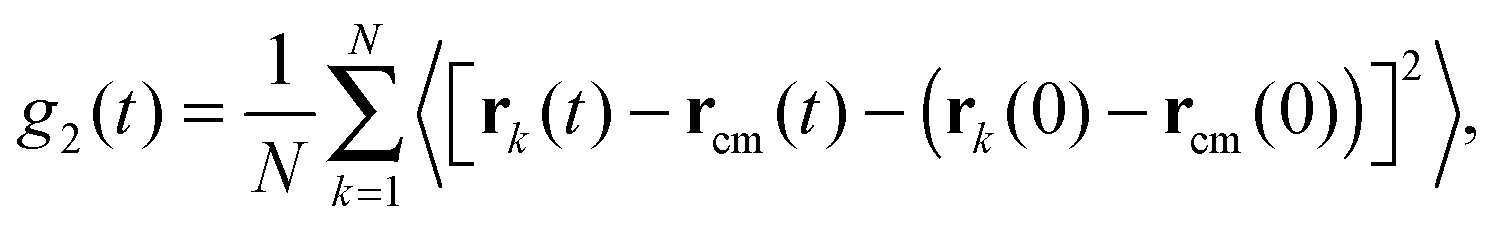
It is also useful to define the mean squared displacement of a segment with respect to the centre of mass of the chain, rcm, denoted by g2(t):| | 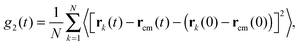 | (19) |
and the mean squared displacement of the centre of mass of the polymer, denoted by g3(t):| | | g3(t) = 〈[rcm(t) − rcm(0)]2〉. | (20) |
On short time scales, g1(t) is dominated by the internal motions of the chain, and exhibits subdiffusive scaling. Within the Rouse model we obtain:31
| | | g1(t) ≈ g2(t) ∼ t1/2 for t ≪ τR, | (21) |
where
τR is the Rouse time, so that
g1(
τR) = 〈
Rg2〉. The magnitude of
g3(
t) is limited by the chain's own size, given by the radius of gyration,
Rg. Therefore, a crossover to normal diffusion occurs on this length scale, and on the corresponding time scale,
τR. On long time scales, the motion is dominated by the displacement of the whole polymer, therefore
| | | g1(t) ≈ g3(t) = 6DRNt = 6D1t/N for t ≫ τR, | (22) |
where
DRN is the Rouse diffusion coefficient of a polymer of length
N, related to the diffusion coefficient of a single free monomer,
D1, as
The short-time and long-time limits for
g1(
t) are well separated for very long chains. For shorter chains, the motion of the centre of mass significantly contributes to
g1(
t). Therefore the scaling exponent 1/2 is reached for
g1(
t) only in the limit of
N → ∞, while for shorter chains the increase is steeper. The transition between the short-time and long-time behaviour is not sharp, therefore the crossover time and length scales,
τR and 〈
Rg2〉, are order of magnitude estimates and should not be taken too literally. For the Rouse model Van Hove correlation function is Gaussian,
31 therefore we expect MSD
app(
t) = MSD(
t) on all time and length scales.
Because of the lack of excluded volume and of hydrodynamic interactions, the Rouse model does not provide a good description of the diffusion of real polymers in dilute solutions. Dynamics of real polymers exhibit the same qualitative features, namely subdiffusive scaling on short time scales and a crossover to normal diffusion on long time scales, where the crossover length scale is given by Rg. The subdiffusive scaling exponent of real polymers is close to 2/3 and the diffusion is faster than predicted by the Rouse model, DN > DRN and scales with a different power of N.32 Both hydrodynamic interactions and the excluded volume introduce forces which scale non-linearly with displacement. In such a case, the Gaussian form of the Van Hove correlation function holds only approximately.31 For the more realistic models we expect MSDapp(t) ≠ MSD(t) on the length scales below Rg. The equality should be recovered on length scales much greater than Rg, when diffusion of the whole chain dominates.
3 Simulation model and method
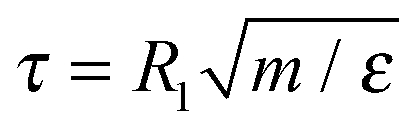
We use several different generic coarse-grained polymer models. As a reference system we use the Rouse model which consists of N beads connected by harmonic springs without any additional interactions. Next, we use the standard Kremer–Grest model,30 with excluded volume interactions represented by the Weeks–Chandler–Andersen (WCA) potential, connected by anharmonic springs represented by the finite-extensible non-linear elastic (FENE) potential. Since the forces are non-linear in displacements, it should lead to MSDapp(t) ≠ MSD(t). We use a system of reduced units where the mass of a single bead, m, is the unit of mass, the effective size of the bead, R1, is the unit of length, and the thermal energy kBT is the unit of energy. We set the parameters of the WCA potential to ε = kBT and σ = R1. We simulate the Kremer–Grest model without hydrodynamic interactions using the Langevin thermostat (KG–Lan), implemented in the ESPResSo simulation software.33,34 We use the time step of δt = 0.0125τ and the friction coefficient γ = 1.0τ−1, where  is the reduced unit of time.35 In such a case, the diffusion coefficient of a free monomer is D1 = 1 in our system of reduced units, and for the Rouse polymer chain of N monomers we obtain DRN = D1/N = 1/N. To include hydrodynamic interactions, we simulate the Kremer–Grest model using the lattice-Boltzmann method (LB)36 with the following parameters: grid spacing a = 1.0σ, fluid density ρ = 0.8m/σ3, solvent viscosity η = 2.8σ−2(mε)1/2, friction coupling coefficient γ = 13.0σm/τ, and the integration time step identical to the KG–Lan model. We employ the D3Q19 method and the friction coupling scheme proposed by Ahlrichs and Dünweg37 for simulations of polymer chains in solution, and successfully used by various authors.38–41 Thanks to the efficient GPU implementation in ESPResSo,42 the LB hydrodynamics require only about 4 times higher computational effort per time step compared to the simulations without hydrodynamics with the Langevin thermostat. With the given parameters of the lattice-Boltzmann method we obtained for the free monomer D1 = 0.1, and for the diffusion coefficient of the polymer with N = 50 we obtained D50 = 0.058 ≈ 3DR50 in the reduced units.
3.1 Localization of the fluorophore and data processing
We use the multiple tau correlator43 engine of ESPResSo34 to compute time–correlation functions spanning more than 6 decades in time scale. For each system, we perform 20 independent simulations with different initial conditions, each of them lasting roughly 106τ (108 time steps). For each monomer k in each of the independent realizations we obtain an independent MSDk(t) viaeqn (17) and Gk(t,w) viaeqn (8). For simplicity, we set the focal spot asymmetry parameter to s = 1, and vary only the beam waist in the range w = 5–40R1. From Gk(t,w) we obtain MSDappk(t,w) viaeqn (16).
We consider two different cases of localization of the fluorophore: (i) attached to a random monomer unit of the chain, and (ii) attached to a specific monomer unit k. They can be obtained from the same simulation trajectory by different processings. In case (i) we average over all the monomer units of the chain viaeqn (9) and (18), while in case (ii) we only average over symmetrically equivalent monomers k and (N + 1 − k). Situation (i) considers mutually uncorrelated fluorophores, which can be achieved if there is at most one fluorophore per chain. This is not identical to the continuously labeled polymers, for which analytical expressions for G(t) have been derived within the Zimm approximation.44,45 To compare our results to these analytical estimates, it would be necessary to include cross-correlations between all pairs of different monomers, which is computationally much more expensive. Finally, we average over the independent realizations of the trajectory. For each data point in the final result we estimate the statistical error as the standard deviation over the independent realizations. This allows us to distinguish systematic deviations from random fluctuations in different correlation functions. In this context it is noteworthy that statistical errors of neighbouring data points of time–correlation functions are highly correlated with each other and even if the correlation function appears smooth it is possible that the statistical error is comparable to the measured value. To avoid overloading the figures, we show only a fraction of data points explicitly with their respective estimated errors. The lines connecting these points pass through all actual data points without any additional smoothing.
3.2 Mapping of time and length scales
Experimentally, MSD(t) of fluorescently labeled DNA has been studied using FCS by Shusterman et al.14,18 To make a connection between experiments and our simulations, it is necessary to map the simulation time and length scales on those of the real experiments. To map the length scales, we use the fact that two polymers can be mapped on each other if their persistence lengths are matched.32,46 A semi-flexible polymer of total contour length L and a persistence length of lp ≪ L can be mapped on a flexible polymer of N = L/(2lp) monomer units, where 2lp = lK is the Kuhn segment length. Taking lK ≈ 100 nm ≈ 340 bp (base pairs) for dsDNA, a fully flexible polymer with N = 50 segments maps to 5 μm or 17 kbp, which is well within the 2–23 kbp range used in the experiments.14 The Rouse model used in our simulations is a fully flexible polymer by construction, so that R1 = lK. The Kremer–Grest model has a persistence length of 2lp = lK ≈ 1.5σ,47 which shifts the above mapping roughly by a factor of 1.5. Such mapping only works for length scales greater than lp. It fails on local length scales below lp, but these do not play any significant role in our results. The width of the focal spot with this mapping becomes w = 5R1 ≈ 500 nm, which is the typical value used in FCS given by the diffraction limit of the excitation beam.24 Lower values of w are not accessible, but it is possible to use higher values of w in order to probe diffusion on different length scales.16,48 Last but not least, the mapping of the time scale is achieved by matching the diffusion coefficient of a free polymer bead to that of an equivalent dsDNA fragment D1 ≈ 15 × 10−8 cm2 s−1.21,49 In simulations of coarse grained models in implicit solvents the microscopic dynamics are accelerated. Therefore the time scale cannot be mapped by simply substituting for the reduced unit of time. Instead, we can estimate the time scale on which the Kuhn segment diffuses over its own size, t = R12/6D1 ≈ 1 μs, which is well within the experimentally relevant time scales. Note that this leads to different mappings of time scales with the Langevin thermostat and with lattice-Boltzmann dynamics. In addition, mapping of the dynamical time scale is quite arbitrary, since friction with the surrounding continuum (implicit solvent) and monomer size or the Kuhn length of the polymer are independent parameters in the simulation model. Similarly, if the experiments would be performed in a medium with different viscosity, the relevant time scales would be merely re-scaled by a constant factor. The relevant quantities, which needs to be mapped correctly, are the ratios lK/w and Rg/w, which determine the range of intermediate length scales where the motion of monomers is dominated by internal dynamics, and hence subdiffusive. On length scales smaller than lK, artifacts of the Langevin dynamics in the implicit solvent affect the monomer motion, while on length scales much greater than Rg the motion of the center of mass of the polymer dominates MSD, which then converges to normal diffusion.
4 Results and discussion
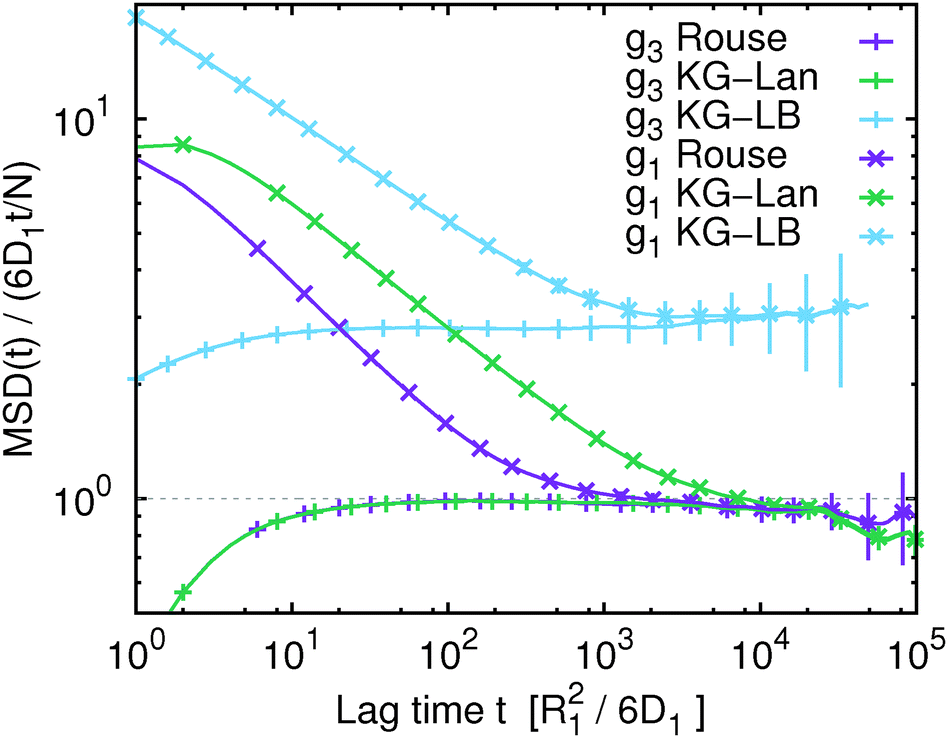
In Fig. 1 we show the mean squared displacement of individual monomers in the polymer chain averaged over all monomers, g1(t), calculated from the trajectory, i.e. using eqn (17) and (18). For comparison, we also show the mean squared displacement of the centre of mass of the whole chain, g3(t). In this figure and all subsequent figures only a fraction of the data points is shown explicitly with their respective statistical error, while the solid lines connect all the actual data points to guide the eye. Fig. 1 illustrates that on the qualitative level all the simulated models exhibit similar features: subdiffusive scaling of g1(t) on intermediate time and length scales, and a crossover to diffusive scaling on longer time and length scales. In quantitative terms we observe that the slope of g1(t) in the intermediate subdiffusive regime increases in the order Rouse model < Kremer–Grest model with the Langevin thermostat (KG–Lan) without hydrodynamics < Kremer–Grest model with lattice-Boltzmann hydrodynamics (KG–LB). The lack of excluded volume in the Rouse model results in 〈Rg2〉1/2 = 2.887 ± 0.005σ, consistent with the analytical result  , and smaller than in the case of the KG model with 〈Rg2〉1/2 = 5.17 ± 0.01σ. Correspondingly, the subdiffusive motion in the KG–Lan case spans a slightly broader range of time and length scales. Obviously, even in the absence of hydrodynamics in the KG–Lan case, the excluded volume alone noticeably alters g1(t) on intermediate time scales compared to the Rouse model. However, due to the absence of hydrodynamics they both converge to the same limiting behaviour with the Rouse diffusion coefficient DRN = D1/N. Finally, the difference in the short-time scaling of g1(t) of the KG model with hydrodynamics (KG–LB) and without hydrodynamics (KG–Lan) is rather small, which is a consequence of the relatively short chain length, N = 50, and hence incomplete separation of internal dynamics from diffusion of the centre of mass. The KG–LB model exhibits subdiffusive behaviour on the same range of length scales but on a narrower range of time scales and eventually converges to a higher value of DN ≈ 3DRN. This difference becomes clearer in the plot of MSD(t)/(6DRNt) in Fig. 2. In this representation deviations from normal diffusion are emphasized. The decreasing part of the curve on intermediate time scales indicates subdiffusion, and on long time scales the curve converges to a constant given by DN/DRN. Fig. 2 also shows that the influence of subdiffusive motion on g1(t) is measurable roughly up to about 103R12/6D1 for the Rouse and KG–LB model and 5 × 10³R12/6D1 for the KG–Lan model. Beyond the Rouse time, τR = (N/π2) ≈ 250R12/6D1, this difference is only observable in Fig. 2 but not in Fig. 1, because the ratio g1(t)/g3(t) is very close to unity.
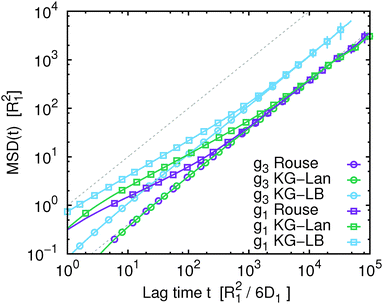 |
| | Fig. 1 The mean squared displacement, MSD(t) (data points), for the Rouse model (Rouse), the Kremer–Grest model with the Langevin thermostat (KG–Lan) and the Kremer–Grest model with the lattice-Boltzmann hydrodynamics (KG–LB). For comparison, we show the MSD(t) of the centre of mass of the chain (g3) and of a single monomer (g1) averaged over all monomers of the chain. The grey dashed lines show the expected MSD(t) for normal diffusion with diffusion coefficients of a single monomer, D1, and of the Rouse polymer, DRN (eqn (22)). | |
 |
| | Fig. 2 Same data as Fig. 1, scaled by the mean squared displacement of the centre of mass of the Rouse polymer (eqn (22)) to emphasize deviations from normal diffusion and differences between different polymer models. | |
Fig. 1 and 2 provide the reference data of the single monomer mean squared displacement, MSD(t) = g1(t), computed from definition of this quantity. We will now compare these to the apparent MSDapp(t,w) obtained from FCS. Fig. 3 shows the FCS autocorrelation functions, G(t,w), obtained from the simulation trajectory viaeqn (9) for the Rouse model and for several different values of the focal spot diameter, w. We observe that in comparison with G(t,w) for normal diffusion with the diffusion coefficient DRN (dashed lines), the G(t,w) curves of the polymer are noticeably deformed. This deformation is due to subdiffusion which occurs on time scales t ≲ τR and vanishes on time scales t ≫ τR. Consequently, the deformation of G(t,w) is clearly visible if w ≲ Rg or τD ≲ τR, while it disappears when w ≫ Rg or τD ≫ τR. Plots of G(t,w) for the other two considered models are provided in Fig. S3 of the ESI.† The above discussion applies analogously to the other two models, only the involved time and length scales are slightly shifted as discussed in the previous paragraph.
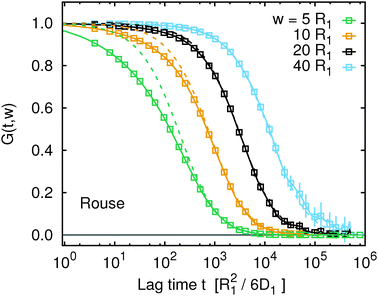 |
| | Fig. 3 The FCS correlation functions, G(t,w) (data points), from simulation trajectories for the Rouse model. For comparison, G(t,w) of single particles performing normal diffusion with diffusion coefficient DRN are shown as dashed lines. Analogous plots for the Kremer–Grest model with the Langevin thermostat and with the lattice-Boltzmann hydrodynamics look qualitatively similar and are available in Fig. S3 of the ESI.† | |
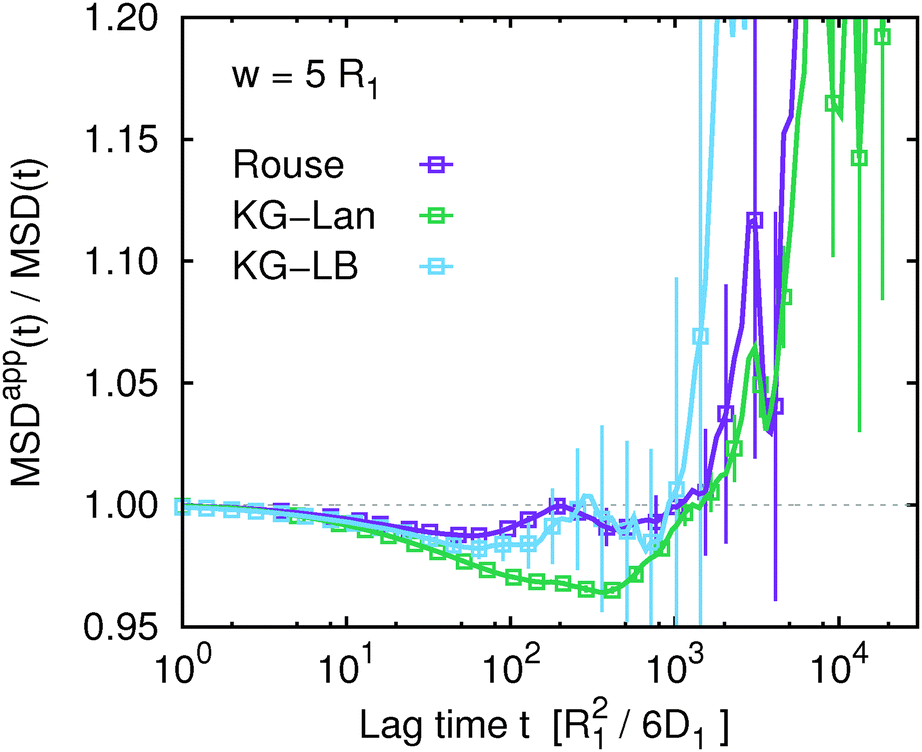
At this point it seems appropriate to ask the key question: how well does the apparent mean squared displacement, MSDapp(t,w), obtained from G(t,w) viaeqn (16), correspond to the true MSD(t)? The answer is provided in Fig. 4 for the Rouse model (and in Fig. S4 of the ESI† for the other two models). At first glance it seems that the correspondence is perfect, as all the data sets for different w collapse on the same master curve given by the true MSD(t). The lack of a systematic deviation is in apparent contradiction with the motivation and theoretical arguments given in the first two sections of the article. Once again, choosing a different representation of the data emphasizes the differences. This is achieved using the ratio MSDapp(t)/MSD(t) shown in Fig. 5 for w = 5R1 (for other values of w see Fig. S5 of the ESI†). Ideally, this ratio should be unity within the estimated statistical accuracy. In Fig. 5 we observe a systematic deviation on intermediate time scales for all three models. For the Rouse model, the systematic deviation amounts to about 1% and spans a very narrow range of time scales. For the KG–Lan model, the deviation is greater, around 5%, and spans a broader range of time scales, in accordance with the non-ideal behaviour due to the short-range excluded volume interactions. Surprisingly, for the KG–LB model, the deviation is not greater but smaller than in the KG–Lan model. Apparently, the introduction of hydrodynamic interactions does not further increase the error, but rather results in a cancellation of errors. It is also interesting to note that all three curves in Fig. 5 rise steeply beyond t ≈ 103R12/6D1. While in the case of KG–Lan this increase is greater than the statistical error and it can be considered a systematic deviation, in the case of Rouse and KG–LB, the greater statistical error does not allow us to conclude that this is a systematic trend. Overall, however, the systematic deviations never exceed 10% of the measured value of MSD(t), and diminish further with an increasing ratio of w/Rg. From the above quantitative analysis, we may conclude that the apparent mean squared displacement, MSDapp(t), obtained from the FCS autocorrelation function using eqn (16) provides a very good approximation to the true mean squared displacement. In addition, the quality of this approximation improves if the characteristic length scale of the instrument (the beam waist w) is greater than the characteristic length scale of subdiffusion (see Fig. S6 of the ESI†). Nevertheless, it cannot be ruled out that for some other non-diffusive dynamical processes eqn (16) fails. Since it is impossible in experiment to directly verify the assumptions under which eqn (16) is valid, our results provide an alternative route to its practical verification: if G(t,w) is measured for several different values of w, and the obtained MSDapp(t,w) depends on w, then eqn (16) is not valid. In such a case, the dependence of MSDapp(t,w) on w can serve as a first order estimate of the systematic error. On the other hand, if MSDapp(t,w) is independent of w, then eqn (16) provides a good approximation to MSD(t).
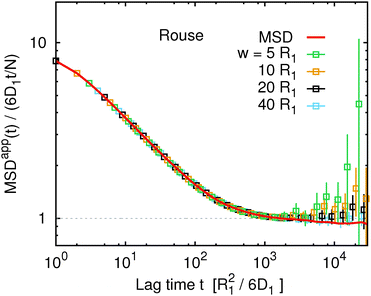 |
| | Fig. 4 The scaled apparent mean squared displacement, MSDapp(t,w), obtained from G(t,w) for the Rouse model. For comparison, the true mean squared displacement, MSD(t), is shown as a red solid line. Analogous plots for the Kremer–Grest model with the Langevin thermostat and the Kremer–Grest model with the lattice-Boltzmann hydrodynamics look qualitatively similar and are in Fig. S4 of the ESI.† | |
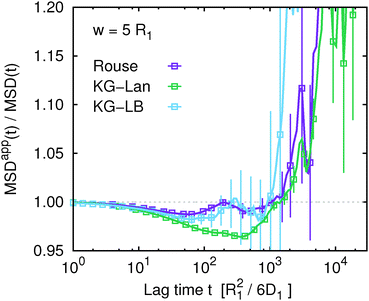 |
| | Fig. 5 The ratio of the apparent and true mean squared displacement, MSDapp(t,w)/MSD(t), for w = 5 comparing all three considered models: Rouse model, Kremer–Grest model with the Langevin thermostat (KG–Lan) and Kremer–Grest model with the lattice-Boltzmann hydrodynamics (KG–LB). Plots for other values of w are available in Fig. S5 of the ESI.† | |
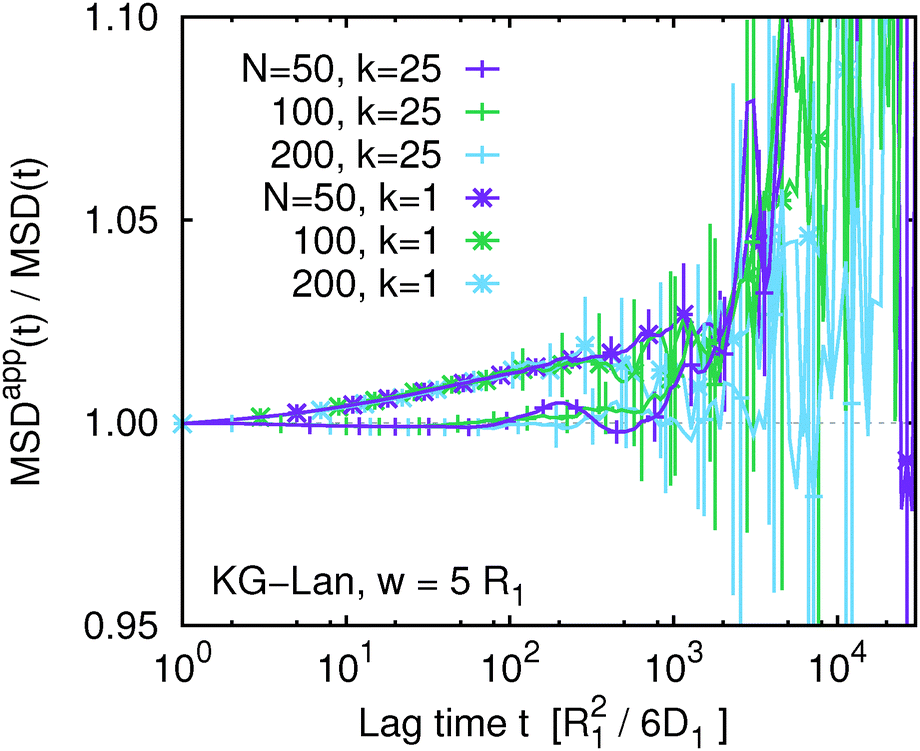
We might speculate that the systematic deviation between MSDapp(t) and MSD(t) is so small because the polymer length N = 50 is too short and the subdiffusive regime is not well developed. Therefore we investigated the influence of chain length within the Kremer–Grest model with the Langevin thermostat. Fig. 6 shows the ratio MSDapp(t)/MSD(t) for w = 5 and a series of chain lengths N = 50, 100, 200. We observe qualitatively the same behaviour for the two longer chains with a shallow minimum on intermediate time scales, followed by a steep increase on long time scales. With increasing N, the corresponding time scales increase, but the magnitude of the deviation from unity stays the same within the statistical accuracy. We did not investigate the influence of chain length for the Rouse model, because there the deviations were negligible. We also did not investigate the influence of chain length in the KG–LB model, because it is computationally more expensive and for longer chains it would not be possible to reach sufficient statistical accuracy.
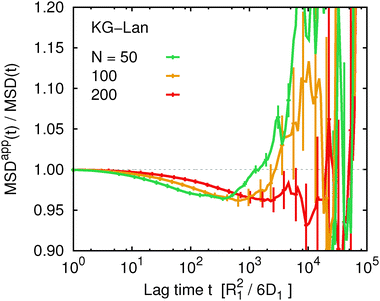 |
| | Fig. 6 The ratio of the apparent and true mean squared displacement, MSDapp(t,w)/MSD(t), for w = 5 comparing different chain lengths for the Kremer–Grest model with the Langevin thermostat. | |
Obviously, statistical accuracy is the limiting factor of our simulations. It would be desirable to achieve the same accuracy on the time scales of 104R12/D1, as we presently have on the time scales of 103R12/D1. In principle it can be improved by running longer simulations and collecting more statistical samples. However, the bottleneck is the required computational effort, which can be conveniently quantified in terms of computational difficulty – the computer time required to achieve a desired accuracy.50 The simulation time needed for an independent sample can be estimated from the relaxation time, τR ∼ N2, and the computer time needed for one time step increases as Na where 1 < a < 2 depending on the implementation. As a rule of thumb, a twofold increase in chain length thus requires an order of magnitude increase in computational effort to achieve the same statistical accuracy. On top of that, the computational difficulty per unit time R12/D1 with LB hydrodynamics is more than 10 times the effort in the KG or in the Rouse models. Similarly, to achieve the same accuracy at 10 times longer time scales, the computational effort would have to be increased by a factor of 102. Thus, while lattice-Boltzmann provides the most realistic description of internal dynamics, it quickly reaches the limits of available computational power. On the other hand, the Rouse model is computationally cheap but too idealized to exhibit significant deviations in MSDapp(t)/MSD(t). The KG–Lan model exhibits easily measurable deviations at an acceptable computational difficulty so that the desired statistical accuracy is achievable.
4.1 Influence of fluorophore localization
Up to this point, we have considered the experimental situation where the fluorophore is attached to a random position on the chain. If each chain carries at most one fluorescent label and the solution is sufficiently dilute so that different chains are not correlated, then the resultant G(t,w) is obtained using eqn (9). However, it is possible to prepare a fluorescently labeled polymer with a label attached to a well defined position. Typically, the fluorophore would be attached at the end or in the middle.51,52 On the length and time scale of internal dynamics of the chain, g1(t) for the middle and for the end segment is different. In such a case eqn (8) cannot be used. Moreover, we might speculate that the systematic deviations discussed in previous paragraphs might stem from the averaging in eqn (9) between two non-linear transformations. Therefore it is possible that MSDappk(t,w) = MSDk(t,w) for each segment k, but the averaged quantities differ, MSDapp(t,w) ≠ MSD(t).
Fig. 7 compares MSDappk(t,w) for selected values of k with MSDapp(t,w) for the Rouse model at w = 5R1. Independent of the value of k, we observe that within the statistical error MSDappk(t,w) = MSDk(t,w). This is consistent with the original expectations that for the Rouse model eqn (16) should provide a very good approximation. In addition, we can conclude that the deviation of MSDapp(t,w) from MSD(t) is indeed caused by averaging between two non-linear transformations. However, we have to keep in mind that such averaging is not artificial but corresponds to a different experimental situation.
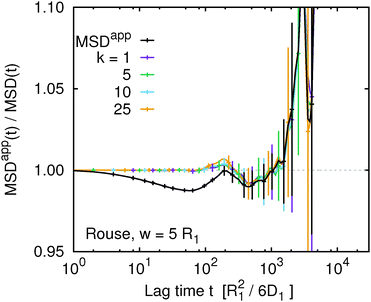 |
| | Fig. 7 The ratio of the apparent and true mean squared displacement, MSDappk(t,w)/MSDk(t), of k-th monomer in the chain, compared to the same quantity averaged over the whole chain using eqn (9) for the Rouse model at w = 5. | |
A different picture emerges if we consider the apparent mean squared displacement of individual monomers in the KG–Lan and KG–LB models, shown in Fig. 8 and 9, respectively. The behaviour of both systems is qualitatively similar, except that the magnitude of the effect is smaller and the statistical errors are greater in the KG–LB case. Here we observe that MSDappk(t,w) significantly depends on k, especially if k = 1 (or k = N due to symmetry with respect to the central monomer). This is again expected, since the motion of the terminal segment is different from the motion of the central part. More importantly, the ratio MSDapp1(t,w)/MSD1(t) monotonically increases with t. For higher values of k, MSDappk(t,w)/MSDk(t) stays close to unity for a time interval that increases with k, but eventually rises off and exhibits systematic deviations similar to the case of k = 1. Especially in the KG–Lan model it is quite clear that the deviations of MSDapp1(t,w)/MSD1(t) from unity are systematic and significantly above the statistical error, even at rather long time scales. Interestingly, these systematic deviations have the opposite sign on intermediate time scales, compared to MSDapp(t,w), obtained from G(t,w) averaged over all monomers. Although the magnitude of the effect is rather small, there is a clear message: different ways of labeling the polymer chain – random, or well defined at the end or in the middle – result in different systematic deviations of the apparent mean squared displacement obtained from the true one. Moreover, not just the magnitude but also the direction of the deviation differs.
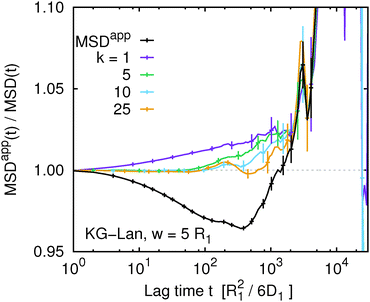 |
| | Fig. 8 The ratio of the true and apparent mean squared displacement, MSDappk(t,w)/MSDk(t), of k-th monomer in the chain and the same quantity averaged over the whole chain using eqn (9) for the Kremer–Grest model with the Langevin thermostat at w = 5. | |
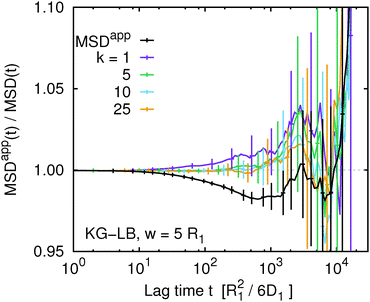 |
| | Fig. 9 The ratio of the true and apparent mean squared displacement, MSDappk(t,w)/MSDk(t), of k-th monomer in the chain and the same quantity averaged over the whole chain using eqn (9) for the Kremer–Grest model with lattice-Boltzmann hydrodynamics at w = 5. | |
Finally, we have seen that MSDapp(t,w) depends on the chain length, N, so it is interesting to see how the apparent mean-squared displacement of individual monomers depends on N. This is shown in Fig. 10, comparing MSDappk(t,w) for the terminal and central monomer for three different chain lengths at w = 5R1. Interestingly, the systematic deviations for a given k seem to be completely independent of N.
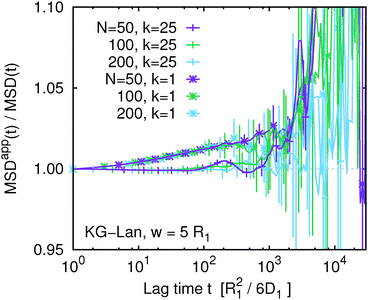 |
| | Fig. 10 The ratio of the true and apparent mean squared displacement, MSDappk(t,w)/MSDk(t), of the central monomer (k = 25) and the end monomer (k = 1) for three different chain lengths indicated in the legend. Kremer–Grest model with the Langevin thermostat at w = 5. | |
5 Conclusions
In this work we used computer simulations of simple model polymer systems to investigate possible systematic deviations of the apparent mean squared displacement, MSDapp(t,w), from the actual mean squared displacement, MSD(t). Both these quantities were computed from the same simulation trajectory. While MSD(t) was computed from the definition of the mean squared displacement, MSDapp(t,w) was computed viaeqn (16) from the FCS correlation function, G(t,w), which in turn was obtained from the simulation trajectory viaeqn (9). In the general case, MSDapp(t) ≠ MSD(t). Only if the Van Hove correlation function is Gaussian (normal diffusion or some special cases of subdiffusion), then MSDapp(t) = MSD(t). Our simulation results show that for the motion of a monomer unit in a polymer chain diffusing in solution MSDapp(t,w) provides an excellent approximation to MSD(t) even in the subdiffusive regime, where the assumptions of eqn (16) may not be fulfilled. Furthermore, we have shown that different positions of the fluorophore within the polymer chain – random or at a well defined location – lead to different systematic deviations due to the different way of averaging as well as due to the different dynamics of the terminal or central monomers. Direct verification of the assumption of Gaussian Van Hover correlation function is hardly possible in experimental systems at the nanoscale. However, it is feasible to vary the beam diameter in FCS experiments. Therefore we propose an indirect way to verify the reliability of the approximation MSDapp(t,w) ≈ MSD(t) by checking whether MSDapp(t,w) depends on the beam waist diameter w.
Acknowledgements
The authors would like to thank Prof. Jörg Enderlein for pointing out the relation between MSD(t) and the cumulant expansion. The authors acknowledge support from the Czech Science Foundation (P208/14-23288J) and from the Ministry of Education, Youth and Sports of the Czech Republic (grant LK21302). Access to the computing facilities of CERIT-SC (CZ.1.05/3.2.00/08.0144) and the National Grid Infrastructure MetaCentrum (LM2010005) are acknowledged too.
References
- D. Magde, W. W. Webb and E. Elson, Phys. Rev. Lett., 1972, 29, 705 CrossRef CAS.
- O. Krichevsky and G. Bonnet, Rep. Prog. Phys., 2002, 65, 251 CrossRef CAS.
- P. Schwille, J. Korlach and W. W. Webb, Cytometry, 1999, 36, 176–182 CrossRef CAS PubMed.
- C. Papadakis, P. Kosovan, W. Richtering and D. Woll, Colloid Polym. Sci., 2014, 292, 2399–2411 CAS.
- D. Wöll, RSC Adv., 2014, 4, 2447–2465 RSC.
- A. Vagias, R. Raccis, K. Koynov, U. Jonas, H.-J. Butt, G. Fytas, P. Košovan, O. Lenz and C. Holm, Phys. Rev. Lett., 2013, 111, 088301 CrossRef PubMed.
- A. Vagias, P. Košovan, K. Koynov, C. Holm, H.-J. Butt and G. Fytas, Macromolecules, 2014, 47, 5303–5312 CrossRef CAS.
- P. Jia, Q. Yang, Y. Gong and J. Zhao, J. Chem. Phys., 2012, 136, 084904 CrossRef PubMed.
- M. Gianneli, P. W. Beines, R. F. Roskamp, K. Koynov, G. Fytas and W. Knoll, J. Phys. Chem. C, 2007, 111, 13205–13211 CAS.
- N. Ziebacz, S. A. Wieczorek, T. Kalwarczyk, M. Fialkowski and R. Holyst, Soft Matter, 2011, 7, 7181–7186 RSC.
- J. Xie, K. Nakai, S. Ohno, H.-J. Butt, K. Koynov and S. Yusa, Macromolecules, 2015, 48, 7237–7244 CrossRef CAS.
- J. Xie, M. Doroshenko, U. Jonas, H.-J. Butt and K. Koynov, ACS Macro Lett., 2016, 190–194 CrossRef CAS.
-
B. J. Berne and R. Pecora, Dynamic Light Scattering, Dover Publications, 1976 Search PubMed.
- R. Shusterman, S. Alon, T. Gavrinyov and O. Krichevsky, Phys. Rev. Lett., 2004, 92, 048303 CrossRef PubMed.
- S. Zustiak, R. Nossal and D. Sackett, Biophys. J., 2011, 101, 255–264 CrossRef CAS PubMed.
- L. Wawrezinieck, H. Rigneault, D. Marguet and P.-F. Lenne, Biophys. J., 2005, 89, 4029–4042 CrossRef CAS PubMed.
- A. Bernheim-Groswasser, R. Shusterman and O. Krichevsky, J. Chem. Phys., 2006, 125, 084903, DOI:10.1063/1.2244550.
- R. Shusterman, T. Gavrinyov and O. Krichevsky, Phys. Rev. Lett., 2008, 100, 098102 CrossRef PubMed.
- T. Wocjan, J. Krieger, O. Krichevsky and J. Langowski, Phys. Chem. Chem. Phys., 2009, 11, 10671–10681 RSC.
- T. K. Piskorz and A. Ochab-Marcinek, J. Phys. Chem. B, 2014, 118, 4906–4912 CrossRef CAS PubMed.
- E. P. Petrov, T. Ohrt, R. Winkler and P. Schwille, Phys. Rev. Lett., 2006, 97, 258101 CrossRef CAS PubMed.
- J. Enderlein, Phys. Rev. Lett., 2012, 108, 108101 CrossRef PubMed.
- A. Ochab-Marcinek, S. A. Wieczorek, N. Ziebacz and R. Holyst, Soft Matter, 2012, 8, 11173–11179 RSC.
- K. Koynov and H.-J. Butt, Curr. Opin. Colloid Interface Sci., 2012, 17, 377–387 CrossRef CAS.
- J. Ricka and T. Binkert, Phys. Rev. A: At., Mol., Opt. Phys., 1989, 39, 2646–2652 CrossRef CAS.
- L. Feng, J. Yang, J. Zhao, D. Wang, K. Koynov and H.-J. Butt, J. Chem. Phys., 2013, 138, 214902, DOI:10.1063/1.4807860.
- G. D. J. Phillies, Biopolymers, 2016, 105, 260–266 CrossRef CAS PubMed.
- G. D. Joseph Phillies, Soft Matter, 2015, 11, 580–586 RSC.
- I. M. Sokolov, Soft Matter, 2012, 8, 9043 RSC.
- G. S. Grest and K. Kremer, Phys. Rev. A: At., Mol., Opt. Phys., 1986, 33, 3628–3631 CrossRef CAS.
-
M. Doi and S. F. Edwards, The Theory of Polymer Dynamics, Oxford Science Publications, 1986 Search PubMed.
-
M. Rubinstein and R. H. Colby, Polymer Physics, Oxford University Press, Oxford, UK, 2003 Search PubMed.
- H. J. Limbach, A. Arnold, B. A. Mann and C. Holm, Comput. Phys. Commun., 2006, 174, 704–727 CrossRef CAS.
-
A. Arnold, O. Lenz, S. Kesselheim, R. Weeber, F. Fahrenberger, D. Röhm, P. Košovan and C. Holm, Meshfree Methods for Partial Differential Equations VI, 2013, pp. 1–23 Search PubMed.
-
D. Frenkel and B. Smit, Understanding Molecular Simulation, Academic Press, San Diego, 2nd edn, 2002 Search PubMed.
- A. Ladd and R. Verberg, J. Stat. Phys., 2001, 104, 1191–1251 CrossRef CAS.
- P. Ahlrichs and B. Dünweg, J. Chem. Phys., 1999, 111, 8225–8239 CrossRef CAS.
- S. Raafatnia, O. A. Hickey and C. Holm, Macromolecules, 2015, 48, 775–787 CrossRef CAS.
- S. Raafatnia, O. A. Hickey, M. Sega and C. Holm, Langmuir, 2014, 30, 1758–1767 CrossRef CAS PubMed.
- O. A. Hickey and C. Holm, J. Chem. Phys., 2013, 138, 194905 CrossRef PubMed.
- J. Smiatek, M. Sega, C. Holm, U. D. Schiller and F. Schmid, J. Chem. Phys., 2009, 130, 244702 CrossRef PubMed.
- D. Roehm and A. Arnold, Eur. Phys. J. Spec. Top., 2012, 210, 89–100 CrossRef.
- J. Ramirez, S. K. Sukumaran, B. Vorselaars and A. E. Likhtman, J. Chem. Phys., 2010, 133, 154103 CrossRef PubMed.
- R. Winkler, S. Keller and J. Rädler, Phys. Rev. E: Stat., Nonlinear, Soft Matter Phys., 2006, 73, 041919 CrossRef CAS PubMed.
- R. G. Winkler, J. Chem. Phys., 2007, 127, 054904 CrossRef PubMed.
-
P. G. de Gennes, Scaling Concepts in Polymer Physics, Cornell University Press, Ithaca, NY, 1979 Search PubMed.
- P. Bačová, P. Košovan, F. Uhlík, J. Kuldová, Z. Limpouchová and K. Procházka, Eur. Phys. J. E, 2012, 35, 1–10 CrossRef PubMed.
- V. Ruprecht, S. Wieser, D. Marguet and G. J. Schütz, Biophys. J., 2011, 100, 2839–2845 CrossRef CAS PubMed.
- S. S. Sorlie and R. Pecora, Macromolecules, 1990, 23, 487–497 CrossRef CAS.
- A. J. Schultz and D. A. Kofke, J. Chem. Theory Comput., 2014, 10, 5229–5234 CrossRef CAS PubMed.
- S. Wang and Y. Zhu, Soft Matter, 2011, 7, 7410–7415 RSC.
- S. Wang, S. Granick and J. Zhao, J. Chem. Phys., 2008, 129, 241102 CrossRef PubMed.
Footnote |
| † Electronic supplementary information (ESI) available. See DOI: 10.1039/c6sm00296j |
|
| This journal is © The Royal Society of Chemistry 2016 |
Click here to see how this site uses Cookies. View our privacy policy here. 
 Open Access Article
 This Open Access Article is licensed under a Creative Commons Attribution-Non Commercial 3.0 Unported Licence
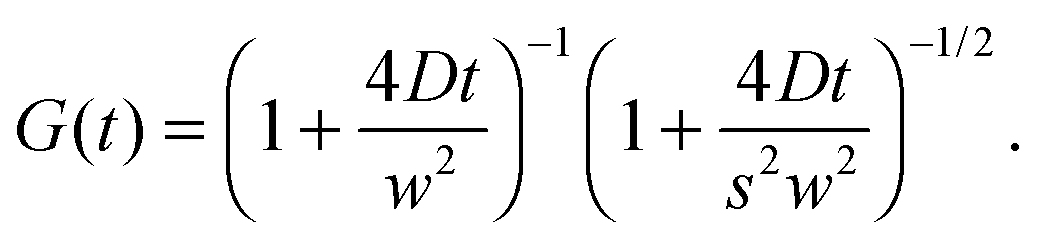


 is the reduced unit of time.35 In such a case, the diffusion coefficient of a free monomer is D1 = 1 in our system of reduced units, and for the Rouse polymer chain of N monomers we obtain DRN = D1/N = 1/N. To include hydrodynamic interactions, we simulate the Kremer–Grest model using the lattice-Boltzmann method (LB)36 with the following parameters: grid spacing a = 1.0σ, fluid density ρ = 0.8m/σ3, solvent viscosity η = 2.8σ−2(mε)1/2, friction coupling coefficient γ = 13.0σm/τ, and the integration time step identical to the KG–Lan model. We employ the D3Q19 method and the friction coupling scheme proposed by Ahlrichs and Dünweg37 for simulations of polymer chains in solution, and successfully used by various authors.38–41 Thanks to the efficient GPU implementation in ESPResSo,42 the LB hydrodynamics require only about 4 times higher computational effort per time step compared to the simulations without hydrodynamics with the Langevin thermostat. With the given parameters of the lattice-Boltzmann method we obtained for the free monomer D1 = 0.1, and for the diffusion coefficient of the polymer with N = 50 we obtained D50 = 0.058 ≈ 3DR50 in the reduced units.
 , and smaller than in the case of the KG model with 〈Rg2〉1/2 = 5.17 ± 0.01σ. Correspondingly, the subdiffusive motion in the KG–Lan case spans a slightly broader range of time and length scales. Obviously, even in the absence of hydrodynamics in the KG–Lan case, the excluded volume alone noticeably alters g1(t) on intermediate time scales compared to the Rouse model. However, due to the absence of hydrodynamics they both converge to the same limiting behaviour with the Rouse diffusion coefficient DRN = D1/N. Finally, the difference in the short-time scaling of g1(t) of the KG model with hydrodynamics (KG–LB) and without hydrodynamics (KG–Lan) is rather small, which is a consequence of the relatively short chain length, N = 50, and hence incomplete separation of internal dynamics from diffusion of the centre of mass. The KG–LB model exhibits subdiffusive behaviour on the same range of length scales but on a narrower range of time scales and eventually converges to a higher value of DN ≈ 3DRN. This difference becomes clearer in the plot of MSD(t)/(6DRNt) in Fig. 2. In this representation deviations from normal diffusion are emphasized. The decreasing part of the curve on intermediate time scales indicates subdiffusion, and on long time scales the curve converges to a constant given by DN/DRN. Fig. 2 also shows that the influence of subdiffusive motion on g1(t) is measurable roughly up to about 103R12/6D1 for the Rouse and KG–LB model and 5 × 10³R12/6D1 for the KG–Lan model. Beyond the Rouse time, τR = (N/π2) ≈ 250R12/6D1, this difference is only observable in Fig. 2 but not in Fig. 1, because the ratio g1(t)/g3(t) is very close to unity.