
 Open Access Article
 This Open Access Article is licensed under a
 Creative Commons Attribution 3.0 Unported Licence
Interaction dynamics of two diffusing particles: contact times and influence of nearby surfaces
B.
Tränkle
a,
D.
Ruh
a and
A.
Rohrbach
*ab
aDepartment of Microsystems Engineering (IMTEK), University of Freiburg, 79110 Freiburg, Germany. E-mail: rohrbach@imtek.de
bBIOSS Centre for Biological Signalling Studies, University of Freiburg, 79104 Freiburg, Germany
First published on 21st January 2016
Abstract
Interactions of diffusing particles are governed by hydrodynamics on different length and timescales. The local hydrodynamics can be influenced substantially by simple interfaces. Here, we investigate the interaction dynamics of two micron-sized spheres close to plane interfaces to mimic more complex biological systems or microfluidic environments. Using scanned line optical tweezers and fast 3D interferometric particle tracking, we are able to track the motion of each bead with precisions of a few nanometers and at a rate of 10 kilohertz. From the recorded trajectories, all spatial and temporal information is accessible. This way, we measure diffusion coefficients for two coupling particles at varying distances h to one or two glass interfaces. We analyze their coupling strength and length by cross-correlation analysis relative to h and find a significant decrease in the coupling length when a second particle diffuses nearby. By analysing the times the particles are in close contact, we find that the influence of nearby surfaces and interaction potentials reduce the diffusivity strongly, although we found that the diffusivity hardly affects the contact times and the binding probability between the particles. All experimental results are compared to a theoretical model, which is based on the number of possible diffusion paths following the Catalan numbers and a diffusion probability, which is biased by the spheres' surface potential. The theoretical and experimental results agree very well and therefore enable a better understanding of hydrodynamically coupled interaction processes.
1. Introduction
The evolution of life over billions of years has been accompanied by many safety mechanisms.1 The simplest of these control mechanisms is based on a multitude of interactions between cellular components or between molecules, which act on specific short ranges and unspecific long ranges, but also on different time-scales. Among the long-range interactions hydrodynamic interactions play a superordinate role, since they affect the interaction dynamics between small particles in close vicinity, as e.g. through the viscosity of the surrounding fluid. In this way, the interaction probability between two binding particles can be strongly reduced, if the arrival of one particle is delayed at the interaction site. Living cells vary the size of their compartments and the distance to interfaces such as membranes and thereby change the local viscous drag.2A typical strategy to better understand these mechanistic principles, is to mimic cellular systems or colloidal solutions and to reduce their complexity. A popular mimetic system consists of a few diffusing colloids in a controllable external potential, where the diffusion coefficients of one or two coupled spheres can still be determined experimentally and theoretically.3,4 The motion of colloidal particles such as micron-sized spheres can be measured and manipulated with optical tweezers and position tracking techniques.
In this way, the hydrodynamic coupling of two particles was investigated by means of two adjacent static optical traps.5,6 Here, position correlation functions turned out to be a versatile analysis tool to gain insights into hydrodynamic coupling. Optical traps were also used to induce colloidal interactions and to investigate the influence of nearby surfaces.7–10 The tracking of the colloids translational motion allows to determine interaction parameters such as relative diffusion coefficients and interparticle contact times. In this context, the influence of nearby cell membranes on the particle motion were measured by means of magnetic11 and also optical tweezers.12
The diffusion inside small artificial vesicles was investigated13 using video microscopy, which is still the standard particle tracking technique, although it is rather slow and erroneous in axial direction. Until now, there have been only very few studies, investigating the interaction of several particles influenced by nearby surfaces.10,14–16 A second nearby surface was only investigated for single diffusing particles or by bulk measurements.17,18 The influence of further boundaries was theoretically described by a linear superposition principle.19
Experimentally it is far from trivial to determine the 3D positions of many diffusing particles on short timescales. Back focal plane (BFP) interferometry is not only a precise and fast 3D tracking technique for a single particle,20 it can also be used for several particles in an extended single optical potential21,22 or in an array of optical point traps.23 In this way the hydrodynamic interaction of two microspheres touching each other in a single optical potential could be investigated on a time window between 100 μs and 2 s.22
Although several novel tracking techniques have emerged, none of them has been applied to investigate how interfaces influence the hydrodynamic coupling and the contact times of two diffusing particles touching each other. How quickly do relative modes of motion decay, how is the diffusion coefficient influenced or how is the distribution of contact times altered by the interface?
These questions are addressed in our paper, which is organized as follows: first, we analyse the motion of two particles in a single potential with respect to their contact times and put this in the context of a mathematical framework, which helps to explain the observed contact time distributions. In the second part we study the coupling of two particles diffusing in a single potential nearby one and two flat glass interfaces.
Experimental principle of investigation
In our approach, we use an extended, line-shaped optical potential, also called a line optical trap to trap two silica-microspheres (radius a ≈ 489 nm, Bangs labs, size variation 10–15%) in the same optical potential. The extended optical potential is generated by scanning a optical point trap at 10 kHz in a unidirectional manner (see ref. 21 and 22 for details). The extended optical trap allows the particles to diffuse in all three directions, where the weakest confinement (several micrometer) of the optical trap is in the scanning direction x, while in the perpendicular directions y and z the particles motions are much stronger confined, with estimated fluctuation widths Δx = 36 nm and Δz = 115 nm (see Fig. 1). While scanning the laser focus, light is scattered at the particles and interferes with unscattered light. The interference intensity is projected onto two quadrant photodiodes,21,24 which are used to determine the particles positions in 3D with nanometer precision and at sub-millisecond time resolution.22,25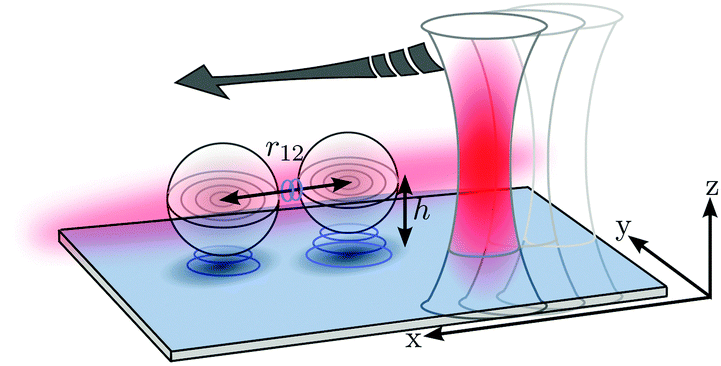 | ||
| Fig. 1 Experimental scheme to investigate hydrodynamic coupling. The laser focus is scanned fast in one dimension to generate a line optical trap. The trapped particles diffuse rather freely in x-direction, but are confined in y- and z-direction. The spheres diffusivities are influenced by nearby surfaces and mutual hydrodynamic coupling (indicated by the blue circles). | ||
To study the impact of nearby surfaces outlined in Fig. 1, we used the piezo stage to alter the spheres' position with respect to one or two horizontal flat interfaces. This was achieved by confining the spheres in a chamber consisting of two opposing coverslips. The samples were prepared using a small coverslip, placed on top of a bigger coverslip. The height of the chamber was roughly controlled by the volume of the colloidal solution brought in between the two plates. To avoid fluid flow and evaporation, the chamber was sealed with vacuum grease. The height L ≈ 7 μm of the chamber was measured as follows. While trapping a colloid in the optical trap, the chamber was moved stepwise in axial direction using a piezo stage. For a sphere center height h ≈ a and for h ≈ L − a, the sphere was displaced from the center of the trap by the coverslip surfaces. The axial displacement was precisely recorded using BFP-interferometry, with a spatial resolution of 3–5 nm. The distance between the two points where the mean axial particle position begins to shift from of the trap center yields the chamber height L + 2a.
2. Theoretical framework
2.1 Distribution of contact times
The diffusive behavior of a Brownian particle is often modeled via a stochastic driving force, resulting in stochastic variables for the particles' degrees of freedom. Since for contact events between particles only the interparticle distance r12 is decisive, we can describe the occurrence of contact events by a single stochastic position variable in relative coordinates r12(t) (see Fig. 1). For each time step, this distance variable increases or decreases randomly by Δd. If r12 falls below the threshold distance R0, a contact is assumed to be possible and the time τon = τend − τstart is measured (blue trajectories in Fig. 2).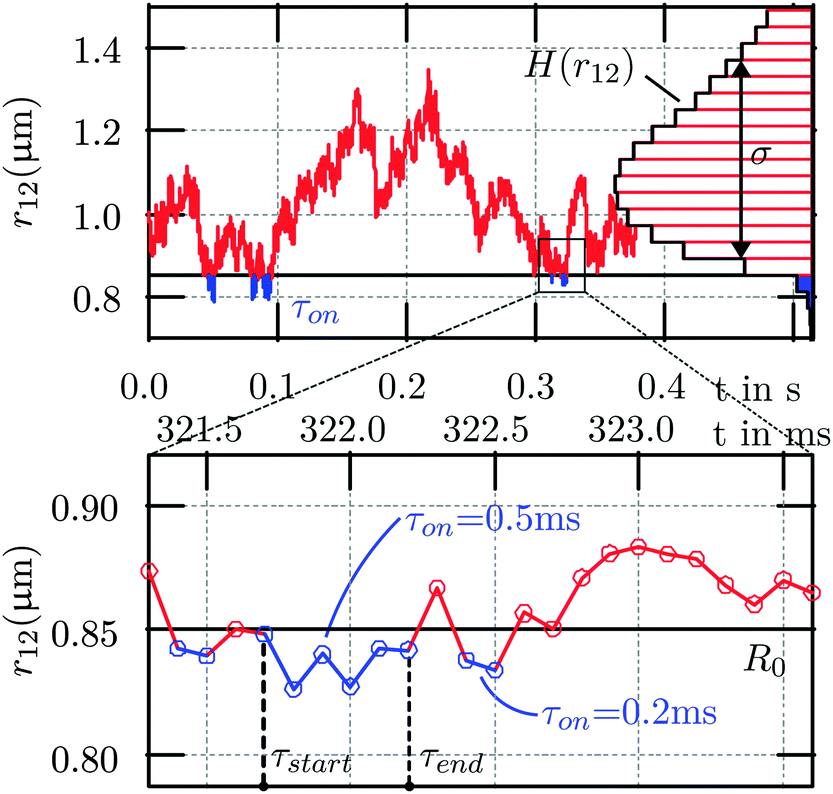 | ||
| Fig. 2 Interparticle distance trajectory and distance histogram. Determination of contact times τon for two particles in a single potential: the interparticle distance r12 is determine by the 3D trajectories r1(t) and r2(t). Each time r12 falls below a threshold distance R0, the time τon is counted. | ||
In our model, the start of a contact process is depicted by the green point in Fig. 3, where the number of paths, which lead to a certain grid point (i.e. a position sample point) is indicated by the black numbers above the paths shown in Fig. 3. The number of possible return paths (random walks) that lead out of the contact zone after n steps, is given by the number series 1, 1, 2, 5, 14,…(red numbers in Fig. 3). As it turns out, this series is well known for diffusive processes and in game theory and is given by the so called Catalan numbers C(n).26
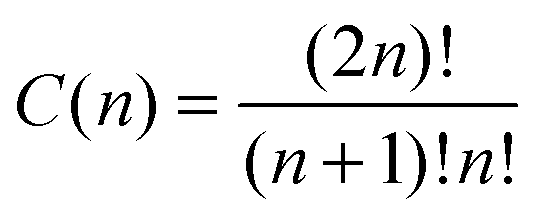 | (1) |
 | ||
| Fig. 3 Schematic illustrating the Catalan numbers. The diffusion pathways after n time steps Δt can be modeled by a stochastic variable r12. The number of possible paths to each knot is counted by the numbers above. Starting at r12 = R0, there is a single path leaving the contact zone after n = 1 time step and overall Z = 4 possible paths. After n = 3 time steps there are C = 5 leaving paths and altogether Z = 64 possible paths. | ||
The total number of possible paths after n time steps is Z(n) = 22n (green numbers in Fig. 3), since there are always two possible directions and the contact zone can only be left after an even number of substeps 2n. Therefore, the probability to find a path of length n which has never left the contact zone is given by
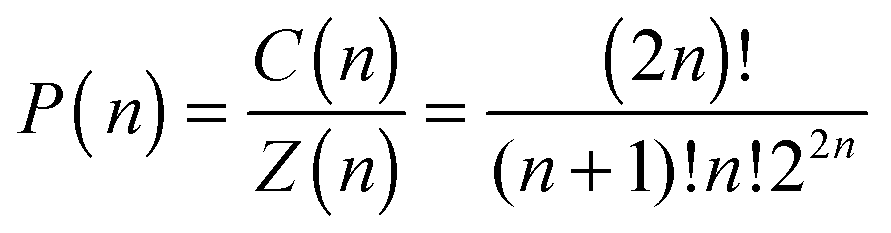 | (2) |
 for n → ∞, one finds
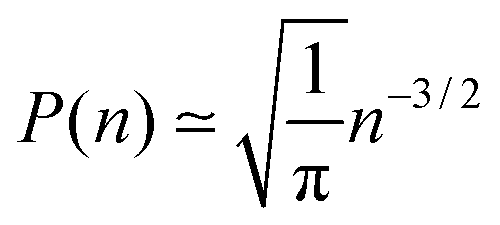 | (3) |
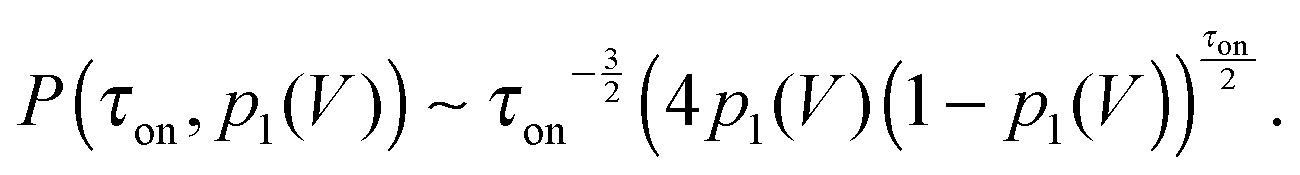
For two colloidal particles in a single potential, a further interaction potential V has to be taken into account. Electrostatic repulsion between the spheres leads to a shift in the stepping probability for steps towards or out of the contact zone. In terms of first return probabilities this effect has been modeled using different probabilities for steps back and forth by Wan et al.28 If the probability for one substep is denoted by p1 and a substep in reverse direction by (1 − p1) (see Fig. 3), the contact time distribution in eqn (3) has to be expanded by an additional term28
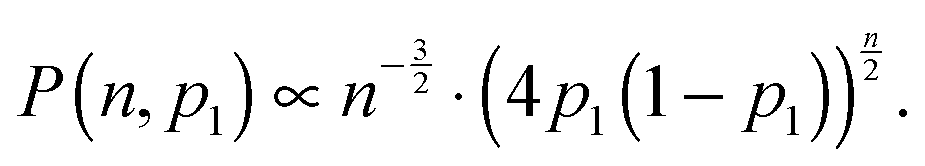 | (4) |
 | (5) |
 of the interaction potential at a defined distance r12 = R0. The potential V(r12) = −kT·ln(H(r12)) + V0 can be derived by Boltzmann statistics from the interparticle distance histogram H(r12) (see Fig. 2). The steeper the repulsive surface potential V(r12), the larger is the repelling force
 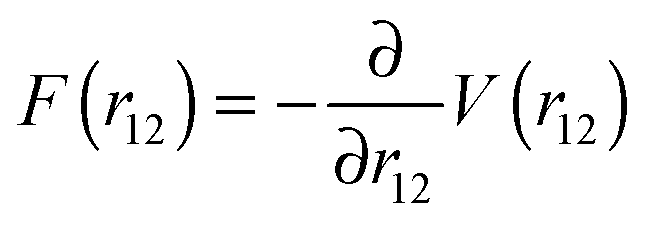 . In the case the particles can get into contact with each other at r12 = 2a and experience a maximum repulsive surface force Fmax, a straightforward way to express the forward step probability is given by
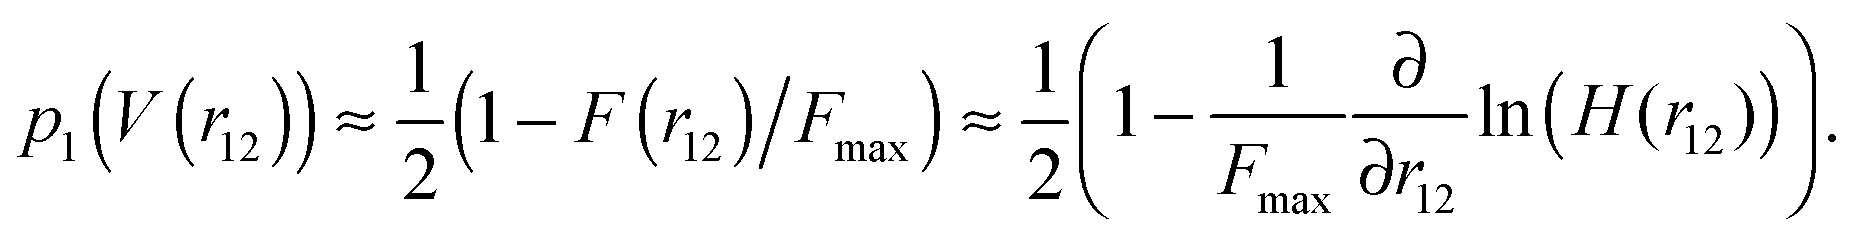 | (6) |
By averaging the contact time distribution P(τon) over the whole measurement time Tmes, the association constant kA is obtained: 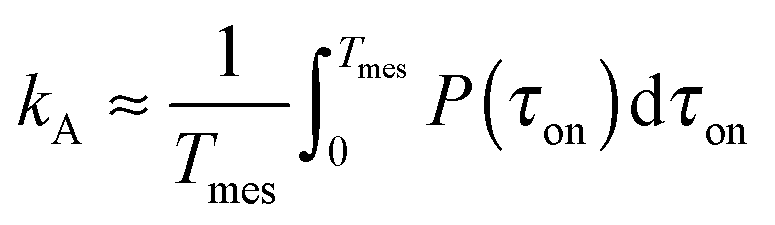 . kA is the average time, the particles are in contact relative to the total measurement time Tmes = ∑(τon + τoff). As illustrated in Fig. 2 in blue colors, kA can also be obtained from the distance distribution H(r12).
In our experiments, we measure contact times τon = n·Δt in seconds, which are multiples of the minimal sampling time Δt = (10 kHz)−1 = 0.1 ms.
2.2 Diffusion coefficients nearby surfaces
The motion of particles in a fluid are coupled via the hydrodynamic flow field. For two particles in external potentials with fixed distances it was shown, that this coupling results in an anti-correlated behavior of the particle fluctuations, i.e. their position cross-correlation function Ccx(τ) in x direction is negative.6,29 This characteristic could be explained by the difference in diffusion coefficients for collective and relative particle motion.5 These findings could be extended by us experimentally to the diffusion of two particles in a single potential and theoretically by the incorporation of an additional surface force.22 In our present study, we introduce nearby surfaces in addition, which slow down the particle fluctuations.The diffusion coefficients derived for a single particle moving parallel to a single surface is given by19,30
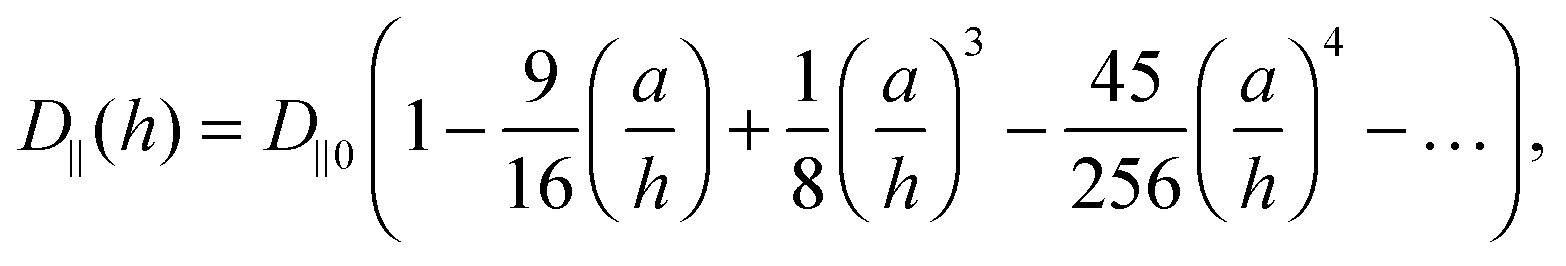 | (7) |
 | (8) |
| D−1(h,L) = D−1(h) + D−1(L − h − 2a) − D0−1. | (9) |
A theory describing the relative and collective diffusion coefficients of two particles in a chamber is so far not available. As a first estimation, one can apply the superposition principle shown in eqn (9) using the relative and collective diffusion coefficients in eqn (8). Here, one has to keep in mind that this leads to an overestimation of the mutual hydrodynamic coupling, i.e. the difference in Dc and Dr. This is because the superposition not only takes into account the second surface, but also includes again the correction terms for Dc and Dr. Although a simple superposition leads to twice the interparticle coupling, this approach can give a first impression of particle dynamics in confined volumes.
3. Experimental results
3.1 Distribution of measured contact times
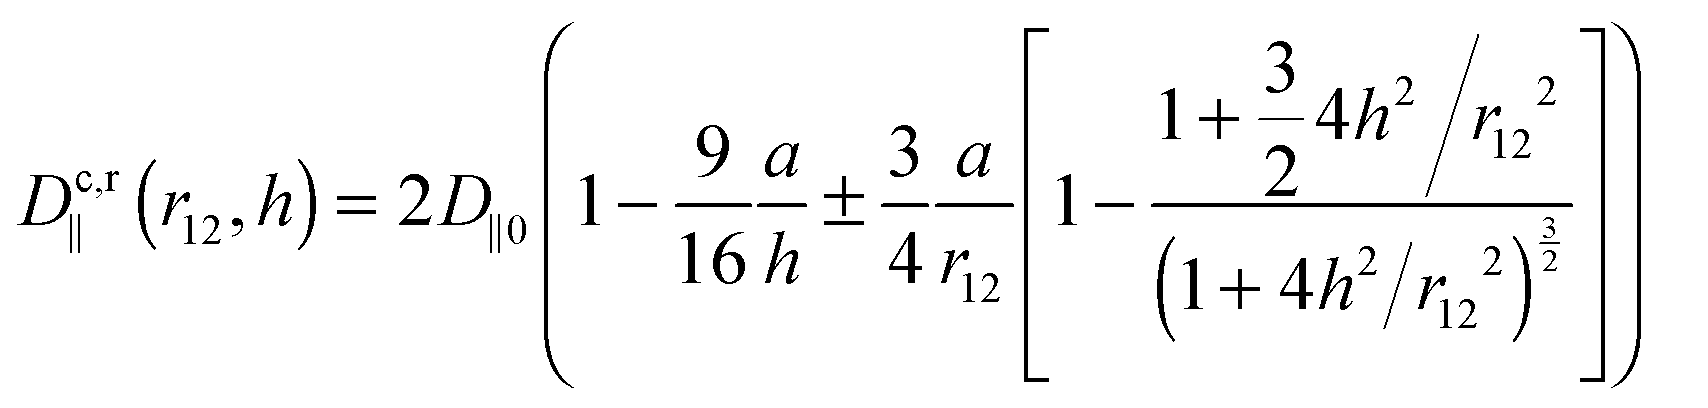
The 3D position fluctuation data of two particles diffusing in a single potential was used to investigate their contact dynamics. In contrast to ensemble measurements, where the readout usually consists of the ratio of educts and products, line optical traps allow to check contact processes of single particles. The interparticle potential of the used particles is mainly determined by electrostatic repulsion. Therefore, irreversible bonds do not take place and contact processes can be investigated with high repeatability in a single measurement. The contact times were determined as sketched in Fig. 2. We first obtained the interparticle distance through r12(t) = |r1(t) − r2(t)|. Subsequently, we scanned r12(t) for those trajectory parts, where r12(t) is throughout smaller than the threshold distance R0 (blue trajectories in Fig. 2). All trajectory parts with the same duration τon were summarized and diagrammed in the distribution P(τon) (see Fig. 4a). In Fig. 4a, the predicted decrease in P(τon) for higher contact durations is clearly visible (the curves were normalized to contacts/second). The contact times of the same trajectory were determined for 3 different threshold distances R0. These characteristic distances are displayed in Fig. 4b, where the interparticle histogram H(r12) reveals the repulsive interaction for small distances. For higher values of r12, H(r12) drops again due to the optical potential, which confines the diffusion volume of both spheres. In good approximation, repulsive and attractive forces cancel out at the potential minimum, i.e. close to R0 = 1.05 μm where the histogram is maximal. According to our model, the interparticle distance r12 decreases or increases at R0 = 1.05 μm with the same stepping probability p1 = (1 − p1) = 1/2. In this case, a scale free power law was deduced with the exponent α = −3/2, derived by the Catalan numbers C(n). The same exponent α = −3/2, can be measured by the blue line in Fig. 4a, which fits very well to the experimentally found data (blue symbols). By varying R0 we can estimate the influence of the interaction potential V(r12) = −kT·ln(H(r12)) + V0 on the single step probability p1 and thereby on P(τon,R0). The green and red symbols correspond to contact durations with a smaller contact zone. The increase in V(r12) can be described by a decrease in p1. The lines in Fig. 4a correspond to eqn (5) with probabilities p1(R0 = 0.95 μm) = 0.465 and p1(R0 = 0.88 μm) = 0.4 respectively. As predicted, a higher repulsive potential leads to a steeper decrease in P(τon,p1).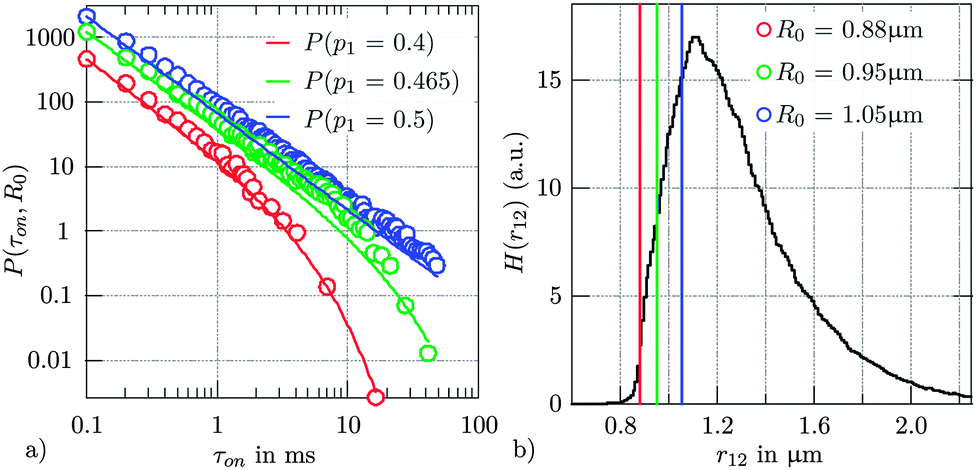 | ||
| Fig. 4 Distribution of contact times and interparticle distance. (a) The frequency of contact times decreases for longer contact times. Experimental data is shown with markers for several threshold distances R0. Theoretical data (shown with lines) corresponds to eqn (5) with step probabilities p. (b) Histogram of interparticle distances H(r12) with threshold distances R0 marked in coloured lines. The three distances R0 correspond to three different strengths of the repulsive surface potential. | ||
4. Hydrodynamic coupling to nearby surfaces
As predicted by eqn (7) and (8), the diffusion D∥(h) of a single particle, but also the relative diffusion Dr∥(r12,h) of two adjacent particles nearby a surface is slowed down due to an increased viscous drag. Therefore one may ask how this change in diffusivity influences the distribution P(τon,h) of the contact times, the correlation between their position fluctuations, but also the diffusion of one particle close to another one and close to the surface.4.1 Contact times between particles nearby surfaces
In the experiments, the mean distance 〈h〉 of the particles to the wall was varied by steering the height hp of the piezo table. The contact time distribution P(τon,h) was determined for 3 distinct distances h. Interestingly, the influence of the nearby surface on the contact time distribution is insignificant as shown in Fig. 5. This underlines the scale free formalism in eqn (3), which does not depend on time or local changes in diffusion coefficients. For short contact times, the power law is clearly visible (see Fig. 5a).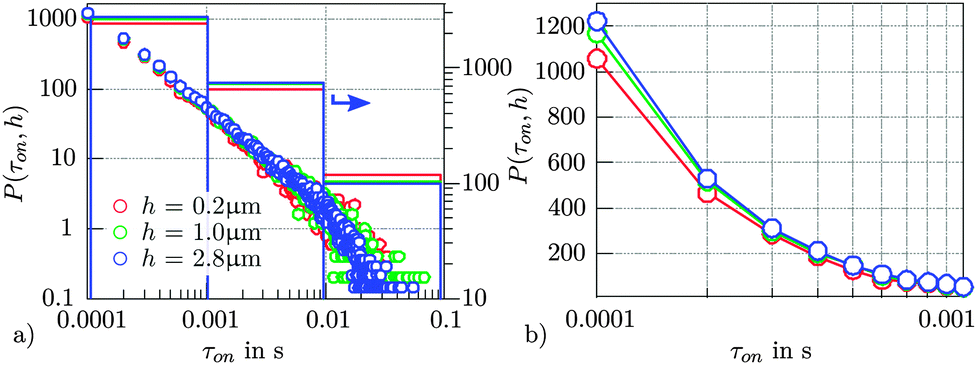 | ||
| Fig. 5 Influence of nearby surfaces on the interaction probability. (a) Contact time distribution P(τon,h) of two particles in a single potential up to τon = 100 ms. The distance h of the optical trap to the surface was stepwise decreased. The bars represent the sum over all contact events in the indicated time window. (b) Inset of P(τon,h) for short contact times up to τon = 0.1 ms. | ||
For sake of clarity, we summed all contact events in a certain time window (bars in Fig. 5a) and depict P(τon,h) in the first time window of 0.1–1 ms in Fig. 5b. For smaller distances h, short contact processes occur slightly less often at higher viscosity. Since the sum of all contact times is determined by H(r12), longer contact times occur more often.
4.2 Diffusion coefficients near surfaces
For the determination of the diffusion coefficients we calculated the autocorrelation function Cai(τ) = 〈ri1(t),ri2(t + τ)〉 of the particle trajectories rij(t), (j = 1, 2, i = x, y, z). On short timescales the particle does not see the potential and the diffusion coefficients are proportional to the slope of the autocorrelation function, Ca(τ) ≈ −D·τ. Fig. 6 shows the result of this analysis for a single bead diffusing parallel to a coverslip (x-direction) at a distance h (Fig. 6a) or between two coverslips (Fig. 6b). In Fig. 6a the curves are each normalized by their corresponding diffusion coefficients D0 determined far from the coverslip surface (∼40 μm), where hydrodynamic coupling to the surface can be neglected in good approximation. The theoretical prediction of eqn (7) is depicted by the solid red line. | ||
| Fig. 6 Single particle diffusion coefficients in the vicinity of one or two surfaces. The regions inaccessible to the spheres due to the plane glass walls are shaded blueish. Their positions were determined using eqn (7) and (9). (a) Diffusion coefficients D∥(h) as a function of distance h from the interface for a single particle with and without a nearby particle. Solid lines correspond to a fit of eqn (7). (b) D∥ for one and two particles between two flat surfaces. The solid lines were calculated using eqn (9). The thickness of the chamber was L ≈ 7 μm. | ||
The very same experiments were carried out with a second particle nearby (green and blue symbols in Fig. 6a). Here, the diffusion is not only hindered by the nearby wall but also influenced by the diffusion of the other particle in the same optical trap. For colloidal suspensions, it was shown that an increase in particle density leads to a drop of the self diffusional coefficient.31 Furthermore, time multiplexed optical traps were used to study the influence of next neighbour particles in a 3 × 3 grid of trapped colloids.23 As expected, a second nearby particle leads to a decrease in the single particle diffusion coefficient. Far away from the surface, we find a drop in D0 by 17%.
For particles in the midplane between two walls, the sphere's diffusivity is suppressed near either wall (see Fig. 6b, black symbols correspond to a single particle in the trap, blue and green symbols to the diffusities for two particles in the same trap). A nearby particle leads to a drop in D0 of about 15%. However, the qualitative behaviour of D(h) close to surfaces does not change. As shown by the blue and green solid lines in Fig. 6a and the black dotted line in Fig. 5b, the course of D(h) is well reproduced by eqn (7) and (9). A nearby particle leads to a decrease of the diffusion coefficient D0 of 15%. A hydrodynamic decay length Λ can be defined by fitting an exponential such that D(r12,h) ≈ a·exp(−h/Λ(r12)) + b. According to these fits, the coupling lengths Λ(r12) decrease by a factor of about 3 for small r12 relative to r12 → ∞ (single particle).
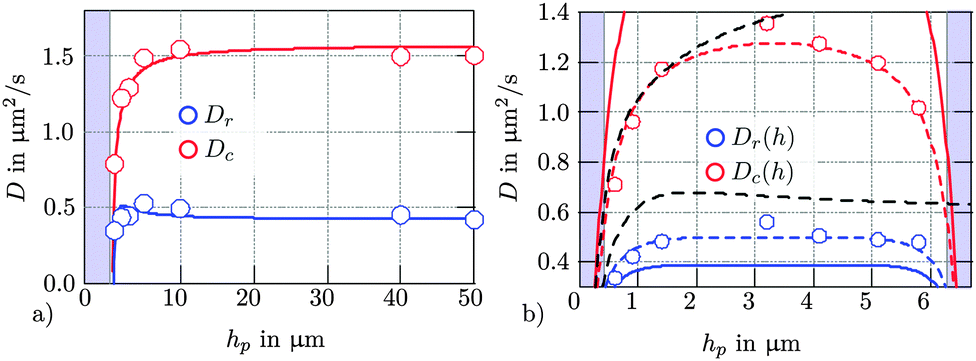 | ||
| Fig. 7 (a) Relative and collective diffusion coefficients of two particles in the vicinity of one or two surfaces. Collective and relative diffusion coefficients of two colloids are plotted in red and blue, respectively. Circles represent experimental data, lines belong to theoretical predictions. The regions inaccessible to the spheres due to the plane glass walls are shaded blueish. (a) Single flat surface: solid lines correspond to eqn (8). (b) Two flat surfaces: Solid lines were calculated by eqn (9). Black dotted lines represent the theoretical course of D for a single surface according to eqn (8). Dashed lines: course given by eqn (9) with r12 = 2.5 μm (blue) and r12 = 1.5 μm (red). The thickness of the chamber was L ≈ 7 μm. | ||
5. Influence of nearby surfaces on the interaction dynamics
The position fluctuations of two diffusing particles (index j = 1, 2) are stochastic, but correlated. The hydrodynamic coupling of their diffusive motion can well be seen in the cross-correlation Cci(τ) = 〈ri1(t),ri2(t + τ)〉 of the trajectories ri1(t) and ri2(t) (i = x, y, z).5,6,23 For a better comparison, it is useful to normalize the function Cci(τ) by the particles standard deviation, which leads to the normalized correlation function Ĉci(τ).The theoretical course of Cci(τ) for two particles with fixed distance in two external potentials was predicted by Meiners et al.29 For two particles in a single potential the correlation function is depending on short range interaction forces in addition.22,32 The course of Cci is then determined by the acting surface forces and the difference in relative and collective diffusion coefficients.22
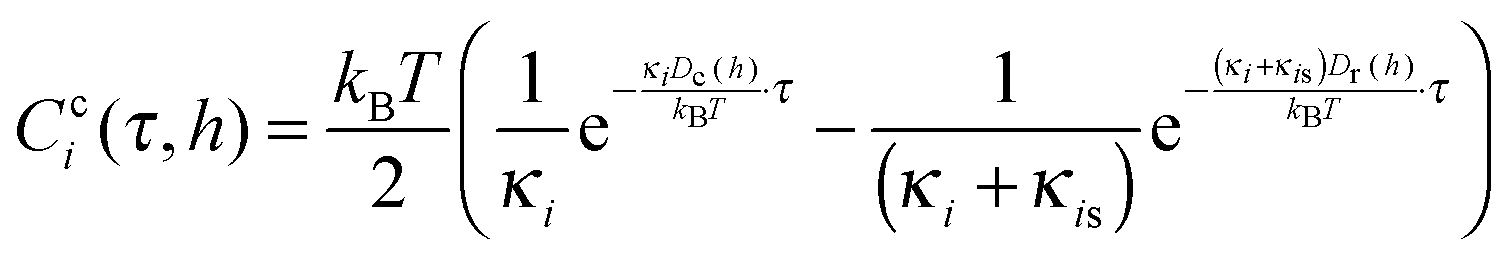 | (10) |
As shown in Fig. 7, the diffusivities Dc,r are reduced in the vicinity of surfaces and therefore we expect an influence on the particle correlation functions. Fig. 8 displays the normalized cross-correlation functions Ĉci(τ) of two particles in a single potential in all 3 dimensions (i = x, y, z). The distance to the surface was lowered by altering the glass surface hpvia the piezo stage. Corresponding to our previously obtained results,22 the correlation function remains positive in the x-direction, since mutual surface forces dominate the spheres' motion. The particles predominantly move in the same direction (pronounced collective motion), favored by the electrostatic force. In other words, the relative (surface and optical) potential is steeper than the collective (optical) potential, leading to higher fluctuation widths in collective direction. In y- and z-direction, the surface force is less dominant and the potentials are approximately equal. Since relative position fluctuations decay faster than collective fluctuations due to the lower relative diffusivity, Ĉci(τ) shows a negative slope according to eqn (10).22
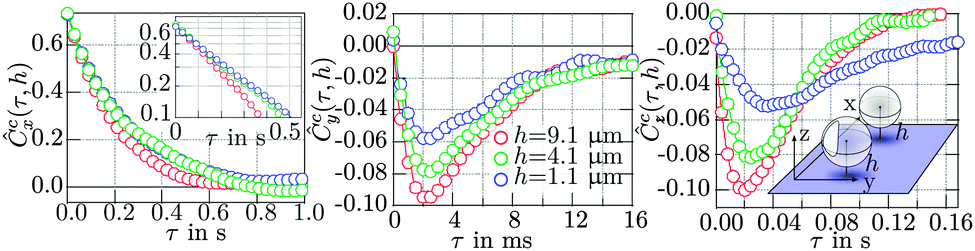 | ||
| Fig. 8 Position cross-correlation functions for fluctuations parallel to the surface. The distance to the nearby surface was decreased stepwise. (a) A stepwise decrease of the distance h leads to a slower decrease in Ĉcx(τ). (b and c) For smaller distances h, the dip in Ĉcy(τ) and Ĉcz(τ) becomes less pronounced. | ||
As shown before, a nearby surface reduces both Dc and Dr. Therefore, Ĉci(τ) in x-direction shows a slower decay. However, the decrease in D(h) is steeper for relative motion than for collective motion. If r12 tends to infinity and h becomes minimal (h → a), the hydrodynamic coupling to the surface is much stronger than the coupling between the spheres. A major benefit of using linetraps is that we can measure correlations effects in a timeframe of up to 2 s.
The effect, that a plane surface nearby two particles suppresses the hydrodynamic coupling, can be well seen in the correlation curves Ĉcy(τ) and Ĉcz(τ) of Fig. 8. The depth of the dips in Ĉcy(τ) and Ĉcz(τ) are expected to become smaller for decreasing distances h to the surface.
The two particle diffusion experiments in the chambers (two plane surfaces) underline the results found for a single flat surface. As displayed in Fig. 9, we observed a symmetric dependency of Cci (i = x, y) on the distance to one of the two surfaces. Again, the diffusion coefficients decrease and lead to a slower decay in Ĉcy(τ), whereas in y-direction, the negative values in Ĉcz(τ) become less pronounced. The maximal amplitude of the cross-correlation functions is significantly reduced by the influence of the surface.
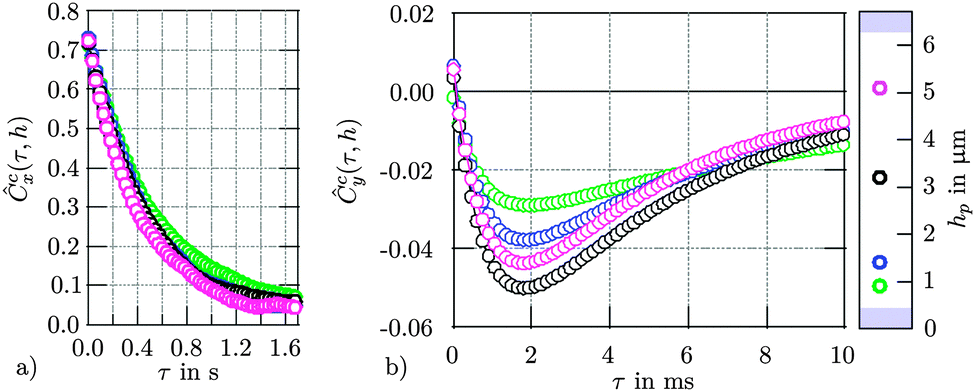 | ||
| Fig. 9 Position cross-correlation function for two particles at two nearby surfaces. The fluctuation data was recorded at different distances of the line optical trap with respect to the surfaces. These positions relative to the surfaces are indicated by the colored markers on the right. (a) Cross-correlation function Ĉcx(τ) in scanning direction x. (b) Cross-correlation function Ĉcy(τ) in lateral y-direction. | ||
6. Discussion
It remains an open question how interfaces influence the hydrodynamic coupling and the contact times of two diffusing particles touching each other. How quickly do relative modes of motion decay, how is the diffusion coefficient influenced or how is the distribution of contact times altered by the interface?The principle of investigation
The technique we used for the hydrodynamic particle coupling via interfaces was a combination of an optical line trap together with 3D back focal plane interferometry and had been introduced in our recent papers.22,23 The presence of one or two horizontal glass interfaces had no influence on the 3D tracking precision, which will be likely not the case for additional vertical interfaces. However, the glass interfaces pushed the diffusing particles upwards in z-direction, which led to a reduced fluctuation volume. This stiffness of the optical trap in x- and y- direction, was not affected by the reduced z-fluctuations. Moreover the distance L between both interfaces needs to be varied in future experiments.Distribution of contact times and interparticle distances
We could show that the Catalan numbers, which describe the number n of defined paths out of a defined volume, can be identified as a distribution of contact times τon = n·Δt between two diffusing spheres for a defined threshold distance R0. R0 is typically some nanometers larger than the sum of the radii spheres (here 2a). For a diffusion without external forces or potentials, the probability to find the two particles within the contact distance over the time period τon, P(τon,p1) ∼ τon−3/2(4p1(1 − p1))τon/2, corresponds to a power law. For a repulsive surface potential between the spheres, the forward step probability p1 is reduced, and P(τon,p1) changes such that longer contact times occur less frequently, whereas shorter contact times are more likely. The single step probability p1(V) can be derived qualitatively from the interaction potential V(r12), or can be obtained through Boltzmann statistics by the histogram of interparticle distances. It remains an interesting task how a non-linear interaction force translates into the distribution of contact times.As shown in Fig. 4, the power law like behavior could be verified very well by our experimental results. Remarkably, the course of P(τon,h) holds also for increased friction due to a decreased distance h to a surface. Whereas a nearby surface slows down the relative and collective particle diffusion, the distribution of contact times is hardly affected by the change in friction. This result is well described by our scale free formalism.
Hydrodynamic coupling to nearby interfaces
The hydrodynamic coupling of the spheres was analyzed in terms of cross-correlation functions (Fig. 8). In scanning direction, the particles motion is slowed down by a nearby wall and shows a positive correlation. In the perpendicular directions, the correlation functions reveal the anti-correlated behavior reported earlier.5 A nearby surface strongly affects the particle motion for small distances. In this case, the mutual coupling is damped in comparison to the increase in friction and the negative dip in the correlation function attenuates.This behavior is a result of differing diffusivities of the collective and relative particle motion. The diffusivities were determined experimentally in the vicinity of one and two confining surfaces for two particles in a single potential. For a single surface, the measurements agree well with theoretical predictions. However, in proximity of the second particle, the diffusivity of the first particle is reduced notably and the hydrodynamic coupling length Λ(r12) is decreased significantly as shown by Fig. 6 and 7. Furthermore, a second nearby surface leads to even higher friction coefficients. The diffusivities of two particles in a chamber could be explained by a linear superposition principle and shows the qualitative expected behavior.
7. Conclusion
Hydrodynamic coupling is supposed to play a key role in biological processes, especially in particle interactions and binding probabilities in confined compartments33 Whereas changes in viscous drag hardly affect the contact times and the binding probability between the particles, the diffusivity is reduced strongly. If the size of a cellular compartment is reduced to increase the binding probability of two particles therein, the increase in contact times is achieved simply by the reduced reaction volume pushing the particles together. The accompanying increased viscous drag simply slows down all processes in time. In this way less information per time can be transferred between particle and surface, e.g. through hydrodynamic momentum transfer.34 We believe that our experimental results in combination with the theoretical framework can be used to explain reaction processes in more complex environments containing more complex particle distributions.Acknowledgements
This study was supported by the Excellence Initiative of the German Federal and State Governments (EXC 294) and by the Deutsche Forschungsgemeinschaft (DFG), grant number RO 3615/1.References
- M. a. Nowak and H. Ohtsuki, Prevolutionary dynamics and the origin of evolution, Proc. Natl. Acad. Sci. U. S. A., 2008, 105, 14924–14927 CrossRef CAS PubMed.
- B. Alberts, Essential Cell Biology, Garland Science, 2010 Search PubMed.
- G. K. Batchelor, An introduction to fluid dynamics, 1998 Search PubMed.
- J. K. G. Dhont, An Introduction to Dynamics of Colloids, Elsevier, Amsterdam, 1996 Search PubMed.
- J. Meiners and S. R. Quake, Direct Measurement of Hydrodynamic Cross Correlations between Two Particles in an External Potential, Phys. Rev. Lett., 1999, 82, 2211–2214 CrossRef CAS.
- P. Bartlett, S. Henderson and S. Mitchell, Measurement of the hydrodynamic forces between two polymer-coated spheres, Philos. Trans. R. Soc. London, 2001, 359, 883–895 CrossRef CAS.
- E. Schäffer, S. F. Norrelykke and J. Howard, Surface Forces and Drag Coefficients of Microspheres near a Plane Surface Measured with Optical Tweezers, Langmuir, 2007, 23, 3654–3665 CrossRef PubMed.
- L. P. Faucheux and A. J. Libchaber, Confined Brownian motion, Phys. Rev. E: Stat., Nonlinear, Soft Matter Phys., 1994, 49, 5158–5163 CrossRef CAS.
- E. Dufresne, D. Altman and D. Grier, Brownian dynamics of a sphere between parallel walls, EPL, 2001, 53, 264–270 CrossRef CAS.
- E. R. Dufresne, T. M. Squires, M. P. Brenner and D. G. Grier, Hydrodynamic coupling of two brownian spheres to a planar surface, Phys. Rev. Lett., 2000, 85, 3317–3320 CrossRef CAS PubMed.
- M. Irmscher, A. M. De Jong, H. Kress and M. W. J. Prins, Probing the Cell Membrane by Magnetic Particle Actuation and Euler Angle Tracking, Biophys. J., 2012, 102, 698–708 CrossRef CAS PubMed.
- H. Kress, E. H. K. Stelzer, G. Griffiths and A. Rohrbach, Control of relative radiation pressure in optical traps: Application to phagocytic membrane binding studies, Phys. Rev. E: Stat., Nonlinear, Soft Matter Phys., 2005, 71, 061927 CrossRef PubMed.
- A. Cervantes-Martínez, A. Ramírez-Saito, R. Armenta-Calderón, M. Ojeda-López and J. Arauz-Lara, Colloidal diffusion inside a spherical cell, Phys. Rev. E: Stat., Nonlinear, Soft Matter Phys., 2011, 83, 1–4 CrossRef PubMed.
- X. Xu, S. a. Rice, B. Lin and H. Diamant, Influence of Hydrodynamic Coupling on Pair Diffusion in a Quasi-One-Dimensional Colloid System, Phys. Rev. Lett., 2005, 95, 158301 CrossRef PubMed.
- G. M. Cicuta, J. Kotar, A. T. Brown, J.-H. Noh and P. Cicuta, Hydrodynamic coupling in polygonal arrays of colloids: Experimental and analytical results, Phys. Rev. E: Stat., Nonlinear, Soft Matter Phys., 2010, 81, 051403 CrossRef PubMed.
- A. Zöttl and H. Stark, Hydrodynamics Determines Collective Motion and Phase Behavior of Active Colloids in Quasi-Two-Dimensional Confinement, Phys. Rev. Lett., 2014, 112, 118101 CrossRef PubMed.
- L. Lobry and N. Ostrowsky, Diffusion of Brownian particles trapped between two walls: Theory and dynamic-light-scattering measurements, Phys. Rev. B: Condens. Matter Mater. Phys., 1996, 53, 12050–12056 CrossRef CAS.
- H. Diamant, B. Cui, B. Lin and S. a. Rice, Hydrodynamic interaction in quasi-two-dimensional suspensions, J. Phys.: Condens. Matter, 2005, 17, S2787–S2793 CrossRef CAS.
- J. Happel and H. Brenner, Low Reynolds Number Hydrodynamics. Englewood Cliffs NJ, 1991, Kluwer Academic Publishers, vol. 40, pp. 1–553 Search PubMed.
- L. Friedrich and A. Rohrbach, Improved interferometric tracking of trapped particles using two frequency-detuned beams, Opt. Lett., 2010, 35, 1920–1922 CrossRef PubMed.
- M. Speidel, L. Friedrich and A. Rohrbach, Interferometric 3D tracking of several particles in a scanning laser focus, Opt. Express, 2009, 17, 7–9 CrossRef.
- B. Tränkle, M. Speidel and A. Rohrbach, Interaction dynamics of two colloids in a single optical potential, Phys. Rev. E: Stat., Nonlinear, Soft Matter Phys., 2012, 86, 1–5 CrossRef PubMed.
- D. Ruh, B. Tränkle and A. Rohrbach, Fast parallel interferometric 3D tracking of numerous optically trapped particles and their hydrodynamic interaction, Opt. Express, 2011, 19, 1832–1835 CrossRef PubMed.
- L. Friedrich and A. Rohrbach, Improved interferometric tracking of trapped particles using two frequency-detuned beams, Opt. Lett., 2010, 35, 1920–1922 CrossRef PubMed.
- D. Ruh, B. Tränkle and A. Rohrbach, Fast parallel interferometric 3D tracking of numerous optically trapped particles and their hydrodynamic interaction, America, 2011, 021907, 1832–1835 Search PubMed.
- P. Hilton and J. Pedersen, Catalan numbers, their generalization, and their uses, Math. Intel., 1991, 13, 65–75 Search PubMed.
- I. N. Bronstein, K. A. Semendjajew, G. Musiol and H. Mühlig, Taschenbuch der Mathematik. Taschenbuch der Mathematik, Verlag Harri Deutsch, 2001, vol. 23, p. 1216 Search PubMed.
- J. Wan and X. Xu, Pólya number and first return of bursty random walk: Rigorous solutions, Physica A, 2012, 391, 1919–1927 CrossRef.
- J.-C. Meiners and S. R. Quake, Direct Measurement of Hydrodynamic Cross Correlations between Two Particles in an External Potential, Phys. Rev. Lett., 1999, 82, 2211–2214 CrossRef CAS.
- H. Faxen, Dissertation, 1921.
- G. K. Batchelor, Diffusion in a dilute polydisperse system of interacting spheres, J. Fluid Mech., 1983, 131, 155 CrossRef CAS.
- M. N. Skryabina, E. V. Lyubin, M. D. Khokhlova and A. A. Fedyanin, Probing of pair interaction of magnetic microparticles with optical tweezers, JETP Lett., 2012, 95, 560–564 CrossRef CAS.
- A. Fallah-Araghi, et al. Enhanced Chemical Synthesis at Soft Interfaces: A Universal Reaction-Adsorption Mechanism in Microcompartments, Phys. Rev. Lett., 2014, 112, 028301 CrossRef PubMed.
- F. Jünger, et al. Measuring local viscosities near plasma membranes of living cells with photonic force microscopy, Biophys. J., 2015, 109, 869–882 CrossRef PubMed.
| This journal is © The Royal Society of Chemistry 2016 |