 Open Access Article
Creative Commons Attribution 3.0 Unported Licence
An optimized protocol for the analysis of time-resolved elastic scattering experiments
Michelle A.
Calabrese
,
Norman J.
Wagner
and
Simon A.
Rogers†
 *
*
University of Delaware Department of Chemical and Biomolecular Engineering, Center for Neutron Science, 150 Academy St., Newark, DE, USA. E-mail: srogers@udel.edu; Fax: +1 302-831-1048; Tel: +1 302-831-8079
First published on 12th January 2016
Abstract
A deconvolution protocol is developed for obtaining material responses from time-resolved small-angle scattering data from light (SALS), X-rays (SAXS), or neutrons (SANS). Previously used methods convolve material responses with information from the procedure used to group data into discrete time intervals, known as binning. We demonstrate that enhanced signal resolution can be obtained by using methods of signal processing to analyze time-resolved scattering data. The method is illustrated for a time-resolved rheo-SANS measurement of a complex, structured surfactant solution under oscillatory shear flow. We show how the underlying material response can be clearly decoupled from the binning procedure. This method greatly reduces the experimental acquisition time, by approximately one-third for the aforementioned rheo-SANS experiment.
Introduction
The study of soft matter is a multidisciplinary and active area of research that often includes materials with time-dependent structures, resulting from self-assembly, phase transitions or an external excitation, such as a shear or electromagnetic field. Accessing structural information on the relevant length scales in soft matter science can be achieved through light, X-ray, or neutron scattering. During a scattering experiment, a beam of particles of a specified wavelength is directed onto the material of interest. This elastic scattering is collected at a detector that records the spatial position of the particle and the time of acquisition. Scattering from stationary or steady-state materials provides microstructural information about the quiescent or locally time-independent state; thus the material properties can be represented by the time-average over the experimental period, T. However, there has been a recent increase of interest surrounding time-resolved scattering experiments, where materials such as biological macromolecules,1,2 gels,3–5 vesicles and membranes,6–8 polymers and polymer crystal phases,9,10 and micelle solutions11–14 have been investigated. The structure of materials responding to an applied excitation should not be analyzed by this simple time-average of the scattering, as the time-dependent nature of the response cannot be discerned. Accordingly, the development of new methods to analyze time-dependent scattering data is essential to both accurately and efficiently determine the true temporal material response.Time-dependent scattering is often analyzed by an averaging procedure known as ‘binning.’ The binning procedure groups the scattering information into fixed intervals (bins) of duration tw, referred to as the bin width. Here, the material response is examined on a timescale much shorter than that of the full experiment, tw ≪ T. By dividing the scattered particles into discrete time bins, the material properties are averaged over tw and are assumed to be relatively constant within the bin. For example, in a scattering experiment of 30 minute duration (T = 30 min), researchers may choose to examine the structural changes after every minute (tw = 1 min). In this case, the average material structure per one-minute time bin is analyzed.
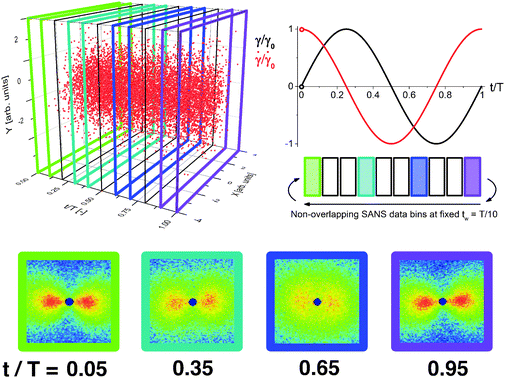
In order for such analysis to be performed, the detector must time-stamp each detected particle in addition to recording its spatial position. Fig. 1 shows an example data set, where the X and Y position on the detector and the time of detection for each scattering event are shown in three dimensions for a typical small angle neutron scattering (SANS) experiment. The red data points in Fig. 1 represent neutrons scattered during a cycle of an oscillatory shear experiment of period T, so that the time axis is normalized as t/T. The spatial and temporal dependence of the scattering events leading to this detector response, as shown in Fig. 1, is indicative of the continuously varying dynamics inherent to the system of interest.
In the standard binning method, three dimensional spatially- and temporally-resolved data are reduced to a sequence of two-dimensional patterns, where the detector response to the scattering is grouped into non-overlapping time bins of duration tw. As shown in Fig. 1, the detected scattering events are binned with tw = T/10 (between black or colored lines) to form a total of ten scattering patterns over the experiment period, T. By using the standard binning method, all derived material properties have an equal temporal resolution and precision of tw. The temporal precision of the binned data is determined by the bin width, tw, whereas the temporal resolution is determined by the time step between consecutive bins, which in the standard binning method is also tw. Any properties that are changing on time scales faster than tw cannot be detected. The scattering patterns shown result from the data binned between each set of colored lines and contain information about the material properties during that specific portion of the oscillation. In the previous example of a 30 minute scattering experiment with a bin width of one-minute, the standard binning method would result in 30 total bins each of duration one minute. Any structure changes occurring faster than one minute would not be detected using this method.
Processing time-dependent scattering
The data binning procedure is analogous to applying a moving average to a time series, as they both result in smoothed, time-averaged data. However, unlike in the moving average procedure, the data binning procedure is necessary to examine time-resolved data, as the material response cannot be elucidated without data processing. The goal of the time-resolved data analysis, therefore, is to resolve the underlying material response. In the context of time-resolved scattering experiments, the coarse-grained binning procedure is necessary to reduce the dimensionality of the data for analysis. In many cases, the binned data is referred to as being the ‘true’ material response, which is not accurate because the binned data depends on the choice of bin width. The true material response should be independent of the analysis method. By applying an ever-widening bin-width to the same experimental data, the finer features of the response will be ‘averaged out’ until eventually the bin is the same width as the period. Thus to determine the true material response, the method of analysis should account for, and remove, artifacts associated with the coarse graining procedure.Convolution and deconvolution
Suppose that the underlying material response of interest, m(t), is continuous and is represented by time-resolved elastic scattering data. The material response of interest could be the intensity or position of a particular peak, for example, or some integral function of the pattern such as an alignment factor or order parameter. These responses necessarily change as a function of real time throughout the experiment, and may be brought about from external forces such as shear or temperature change. This time-dependent response, m(t), is not to be confused with the instrument resolution function or the material scattering function, which are defined in the inverse space domain. These functions are inherent to the instrument and the scattering data and are convolved in the inverse space domain, resulting in the instrument-smeared signal that is recorded during a scattering experiment. The function m(t) therefore describes the time-dependent nature of the instrument-smeared signal; the following procedure does not attempt to alter or correct the signal based on instrument smearing. We also note that a finite wavelength distribution of neutrons in SANS experiments introduces time smearing of the response and this is not explicitly considered here, such that the method may require additional considerations for experiments performed with a broad distribution of incident velocities, such as in a spallation neutron experiment. The scattering data is grouped into time bins, b(t,tw), of duration tw, which is defined by the boxcar function at a time, t, | (1) |
 | (2) |
 | (3) |
| c(t) = m(t)⊗b(t,tw) | (4) |
![[scr F, script letter F]](https://www.rsc.org/images/entities/char_e141.gif) , and the Fourier transform of a time domain function by a change of variable and capitalization, the theorem states that
, and the Fourier transform of a time domain function by a change of variable and capitalization, the theorem states that![[scr F, script letter F]](https://www.rsc.org/images/entities/char_e141.gif) {c(t)} = C(ω) = {c(t)} = C(ω) = ![[scr F, script letter F]](https://www.rsc.org/images/entities/char_e141.gif) {m(t)⊗b(t,tw)} = M(ω)·B(ω,tw). {m(t)⊗b(t,tw)} = M(ω)·B(ω,tw). | (5) |
 | (6) |
 | (7) |
 | (8) |
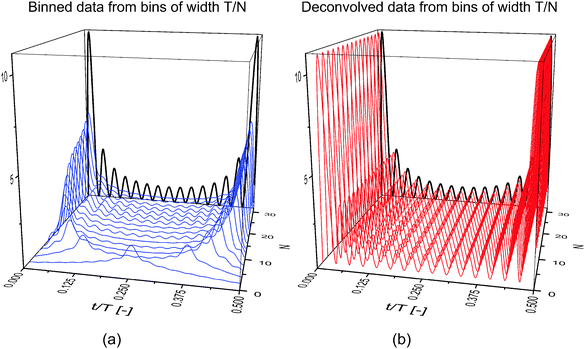
The results in Fig. 2(a) represent the material response that is obtained when different bin sizes are chosen to process the data. For convenience, the bin duration, tw, is expressed as an even integer fraction of the period of oscillation, T, such that tw = T/N. Here, the temporal resolution is approximately continuous through t/T, whereas the temporal precision is determined by the bin width, T/N. Larger integers thus correspond to shorter bins, better approximating the underlying material response. Clearly, the results of binning alone are dependent on the bin size, as significantly different responses are seen with changing N. In Fig. 2(b), the data from Fig. 2(a) is deconvolved to obtain the true material response. The result of the deconvolution is completely independent of the bin size, a property required of the material response.
On the basis of the data displayed in Fig. 2, a bin as wide as half of the period, T/2, can be used, in theory, to accurately determine the material response via deconvolution. Such analysis has clear implications in the length of time required to carry out a time-resolved scattering experiment. In many studies where binning is used, bin widths on the order of T/30 are employed to provide a reasonable balance between temporal resolution and experiment duration.5,14 If a constant number of scattering events per bin is desired (normally around 100![[thin space (1/6-em)]](https://www.rsc.org/images/entities/char_2009.gif) 000 –250
000 –250![[thin space (1/6-em)]](https://www.rsc.org/images/entities/char_2009.gif) 000 or greater, depending on the information sought by the researcher), then scattering events sufficient to fill bins of width T/2 can be collected 15 times faster than the number of scattering events required to fill bins of width T/30. However, experimental limitations and noise in the data limit the practical bin size that can be applied to reduce scattering time, which will be discussed in the next section.
000 or greater, depending on the information sought by the researcher), then scattering events sufficient to fill bins of width T/2 can be collected 15 times faster than the number of scattering events required to fill bins of width T/30. However, experimental limitations and noise in the data limit the practical bin size that can be applied to reduce scattering time, which will be discussed in the next section.
Discretization
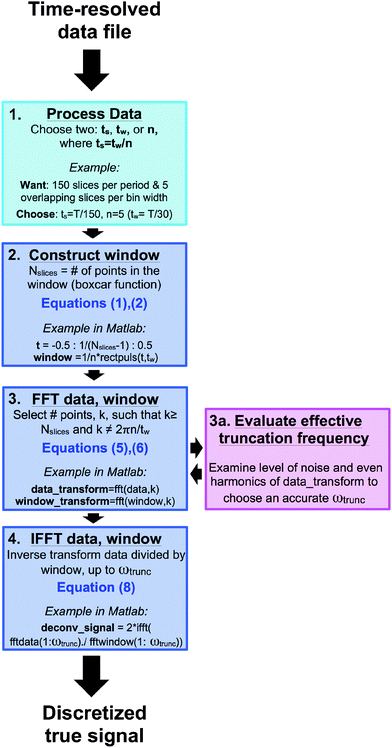
The formalism above in support of deconvolution assumes continuous functions and transforms. Practically, the underlying continuous material response can only be measured discretely, and therefore, the ‘true’ deconvolved signal must also be discrete. The integrals in eqn (3) and those involved in the transforms in eqn (5) and (8) are therefore replaced by sums. While the arguments remain the same, the application of the ideas requires refinement when dealing with discretely-measured data. The primary concerns when deconvolving discrete data are associated with Fourier transformation and inverse Fourier transformation, which can be affected by noise, time-step size, and bin-width. Additionally, the binned data must be processed in a specific manner to implement the deconvolution procedure. In the standard binning method, the temporal precision and temporal resolution are the same because the bins are non-overlapping in time. Accordingly, the binned material response cannot be deconvolved because there exists only one data point per bin width. The binning procedure can be modified to allow the bins to ‘slide’ at a certain time step, ts, where ts ≪ tw. In this method, referred to as the sliding binning method, the bins overlap in time so that neutrons are counted multiple times, but only once per bin. Implementing the sliding binning method greatly increases the temporal resolution of the binned signal (by a factor of n = tw/ts), thus enabling better deconvolution. In the previous example of a 30 minute scattering experiment with a bin width of one-minute, the sliding binning method increases the total bin number by 30n. A chosen value of n = 5 would result in 150 total bins, each of duration one minute (illustrated in Fig. 3). Note that the appropriate choice of n is dependent on the data set, and larger n-values are often required for wider bin widths. This numerical example, given in step 1. of Fig. 3, uses the sliding binning method to achieve five-fold improved temporal resolution over the standard binning method. Fig. 3 also helps to visualize the full procedure, from the data processing to the final deconvolution step. A sample procedure and Matlab commands are provided as a practical example, which addresses issues such as noise and bin width effects (which will be discussed below).Noise effects
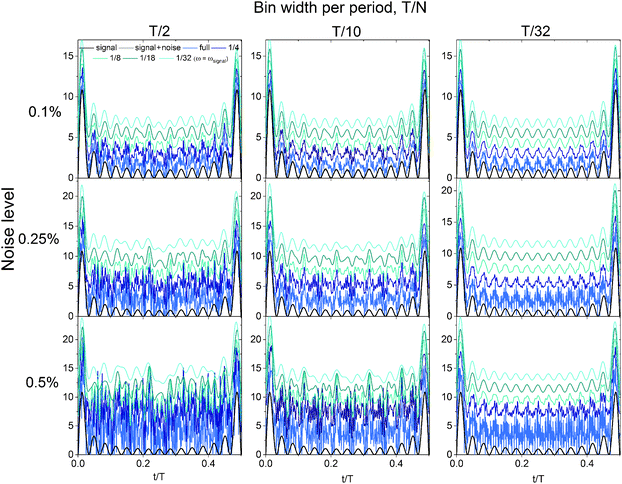
The deconvolution process provides a pathway for dramatically reducing the acquisition time for a time-resolved scattering experiment by using larger bin sizes. However, noise effects limit the practical bin width that can be applied to a data set to obtain an accurate deconvolved signal. Fourier transforming discrete data requires division by the number of points in the time domain signal, and inverse Fourier transformation requires multiplication by the number of points in the frequency domain signal. The signal-to-noise ratio (SNR) of an experimentally-measured signal can be increased by truncating the spectrum in the frequency domain. Truncating the frequency spectrum is almost always necessary based on the noise level and the error associated with experimental data (step 3a, Fig. 3). In time periodic experiments, the truncation frequency can be estimated by examining the magnitude of the noise in the Fourier transform of the time-averaged data, which is most apparent at high frequencies. Truncating the full spectrum thereby removes a significant amount of noise from the signal. The inverse Fourier transform then only uses the frequencies that are above the level of the noise to reconstruct the discrete true signal. In data sets where the noise amplitude is higher than that of a frequency that contributes to the signal, the feature resulting from that frequency cannot be resolved in the true signal. Fig. 4 examines the effect of noise on the deconvolution procedure for different bin widths and different truncation frequencies.The signals in Fig. 4 are calculated by deconvolving the time-average of the original signal featured in Fig. 2 with different levels of added noise. These calculations are the same as those performed in Fig. 2; however noise was added to the time-averaged signal before performing the deconvolution, such that the results are no longer analytically defined. Gaussian-distributed zero-mean white noise was generated in Matlab, where one standard deviation of the noise amplitude was equal to 0.1%, 0.25% or 0.5% of the mean amplitude of the time-averaged signal. Fig. 4 clearly shows the effect of noise on the deconvolved signal at different bin widths (T/2, T/10, T/32), and of truncating the full Fourier spectrum at different frequencies, ranging from the full frequency spectrum (no truncation) to 1/32 of the full spectrum (number of frequencies used to construct the original signal). As seen in Fig. 4, the closer the truncation frequency is to the number of frequencies used to generate the signal, the more noise is filtered, leading to a smoother signal. However, the end of the Convolution and deconvolution section illustrated a case where a bin width of T/2 can reduce the time that would currently be taken to acquire data sufficient for bins of width T/30 by a factor of 15. However, as Fig. 4 shows, there are limitations in the bin width that should be chosen when performing an experiment. Bins of width T/32 handle the noise the best, as the smaller bin width leads to sharper features in the time-averaged signal, which results in a high signal-to-noise ratio. Using bins of T/32, the deconvolution result after truncation is nearly unaffected by the increasing noise level within the range examined. However, the effect of the added noise is pronounced at bins of T/2, where even the truncated deconvolution results greatly differ from the expected original signal. Smaller bin widths are optimal in the deconvolution procedure for several reasons. The width of the sinc function in frequency space is inversely proportional to the bin width in real time, meaning that smaller bin widths cover a wider frequency range. The number of roots in the sinc function also increases with wider bin sizes in the same frequency range, leading to more information loss with wider bins. Lastly, the amplitude of the sinc function at high frequencies is larger when the bin size is smaller, leading to a the higher signal-to-noise ratio when the deconvolution is performed. However, by truncating the spectrum at all bin widths, the deconvolution result becomes closer to that of the original signal. The truncation of the frequency spectrum is important to perform during this procedure (Fig. 3 and 4) such that only the frequencies with amplitudes significantly above the level of the noise are used to reconstruct the discrete true signal.
Time-step size effects
A fundamental result in the field of information theory, often referred to as the Nyquist–Shannon sampling theory states thatIf a function x(t) contains no frequencies higher than B Hz, it is completely determined by giving its ordinates at a series of points spaced 1/(2B) s apart.
The sampling theorem sets the upper limit on the angular frequencies that can be determined by the Fourier transformation of discretely-measured data. The upper frequency limit of the band, denoted by B, and the size of the time step, ts, are therefore related by:
 | (9) |
 as shown in eqn (6). In the deconvolution, the Fourier transform of the convolved data is therefore divided by a number less than or equal to one. It is possible to set a value on how much the frequency response has decayed by truncating the response at a particular frequency. If we refer to the amplitude of the sinc function as L:
 | (10) |
 | (11) |
 . This requires the step size to be thirteen times smaller than the bin width. However, often times the experimental scattering signal decays much faster than that of the sinc function. In oscillatory shear experiments, for example, the stress response is highly indicative of the scattering signal. The higher order harmonics present in the Fourier transform of the stress response are a good estimate of the higher order harmonics present in the structural response. In many of these experiments, it is more realistic to decay the sinc function to 15–20% of the zero-frequency value, where the frequency of the sinc function is near that of the data truncation frequency (determined using step 3a in Fig. 3). At 15–20% of the zero-frequency value, a step size of ts = tw/3 or tw/5 is often sufficient; however, the optimal step size is dependent on the data set and bins of large tw may require finer step sizes.
Bin-width effects
In addition to the amplitude, the phase of the sinc must also be considered to determine which frequencies will be irretrievably lost during the deconvolution. As sin(ω) = 0 when ω = nπ ∀ n∈![[Doublestruck Z]](https://www.rsc.org/images/entities/i_char_e17d.gif) , frequencies equal to
, frequencies equal to  will be eliminated from the deconvolved function. Practically speaking, the deconvolution will be undefined when the discrete Fourier transform (DFT) of the time window contains zeros, as the DFT of the time-averaged data is divided by that of the window function. As mentioned in Fig. 3, the number of points for the transform can be carefully chosen to avoid such complications. Note that the chosen number of points for the transform, k, should be greater than or equal to the number of slices. By doing so, the transform will be padded with zeros (Matlab), as opposed to prematurely truncating the spectrum.
Experimental results and accessibility
The standard and proposed analysis techniques are compared using a time-resolved large amplitude oscillatory shear (LAOS) rheo-SANS experiment taken at the National Institute of Standards and Technology Center for Neutron Research (NCNR). The experiment was performed on a previously characterized15,16 mildly branched wormlike micellar solution with an applied strain amplitude γ0 = 225 and angular frequency ω = 0.2 rad s−1. Scattering was measured in the 1,3 flow-vorticity plane of shear. One material property that is directly calculated from binned neutron data, which therefore may represent c(t), is the alignment factor. The scalar alignment factor is a measure of shear-induced segmental alignment (anisotropy) and is defined by the spatial average on the detector, given by, | (12) |
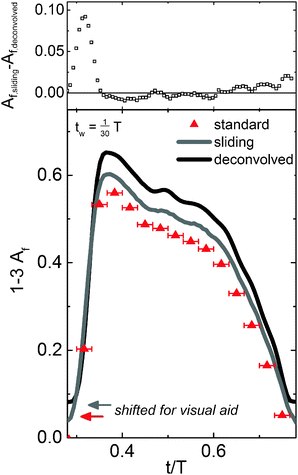
Fig. 5 shows the results for the standard binning method, the sliding binning method, and the full deconvolution (translated for visual aid). First, the alignment factor was calculated for each of the thirty, non-overlapping bins (red) using the standard binning method (tw = ts = T/30). The sliding binning method (gray) was performed on the same data set using overlapping bins with a step size five-fold smaller than the bin width (tw = T/30, ts = T/150 = tw/5), yielding a five-fold improvement in the temporal resolution and 150 total bins. While a value of n = 5 (as seen in Fig. 3) provides sufficient temporal resolution to perform the deconvolution for bins of width T/30 in this experiment, larger values of n may be required when the chosen bin size is larger than T/30. The experimental data processed using the sliding bin method (gray) was then deconvolved to elicit the true (discretized) material response (black). The discrete nature of the standard binning method, which leads to poor temporal resolution, is apparent in Fig. 5, whereas the sliding binning method presents improved temporal resolution. The sliding bin curve (gray) exhibits small oscillations in the alignment factor signal, suggestive of a higher frequency material response, that are not seen with the standard binning method. While portions of the sliding bin curve could be interpolated from the standard bin points, the existence of the higher frequency oscillations in the material structure and the position and value of the maximum alignment would not be resolvable via interpolation. The deconvolved signal (black) displays sharper oscillations in Af that reflect the true material alignment. The residuals in Fig. 5 highlight the improvements to feature sharpness and quality obtained by the deconvolution procedure.
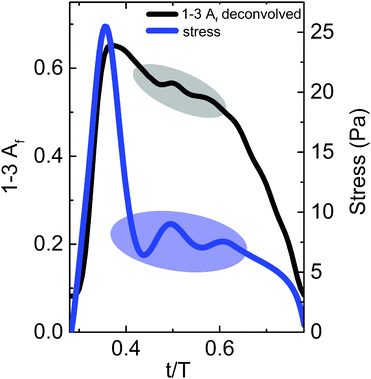
In Fig. 6, we examine the higher frequency oscillations in the alignment factor and compare the deconvolved, true alignment (black) to the measured shear stress (blue). The alignment factor oscillations clearly correspond to similar oscillations in the measured shear stress. These features cannot be resolved using the standard binning method due to poor temporal resolution and limited number of points, making it more difficult to derive information from the stress-SANS law,17 or other empirical relationships. Simply reducing the bin size will not improve the situation, as the statistical accuracy of the data decreases correspondingly. The improved temporal resolution and feature clarity gained from the deconvolution provide a more direct and accurate pathway to quantitatively link the structural alignment to the measured bulk rheological properties. The deconvolution process also provides a method for reducing total experiment time required to achieve a given accuracy in scattering experiments. However, the noise level ultimately limits the resolution that can be obtained. Similar to the results shown in Fig. 4, the experimental deconvolution results for this data set are insensitive to bins of width T/20 compared with T/30 (data not shown), leading to a reduction in scattering (data acquisition) time of one-third.
In additional oscillatory shear conditions, we found that the deconvolution results were also unaffected by the reduction in bin width from T/30 to T/20 (data not shown). Depending on the features present in the signal, further time reduction can be obtained by implementing larger bin sizes. The time-averaged signal in Fig. 6 has two small oscillations on the order of T/10 in the alignment factor and stress signal: one from 0.45 < t/T < 0.55 and the other from 0.55 < t/T < 0.65. Therefore, when a bin size on the order of T/10 is used, the magnitude of the Fourier transform at these frequencies is roughly equivalent to the noise, making an accurate deconvolution difficult to perform. As the material stress response contains complementary features to the alignment factor response, the appropriate bin width can be estimated by examining the width of the stress response features and then choosing a smaller bin size. By decreasing the bin size from T/10 to T/20, the deconvolution was successfully performed for this data set.
In summary, we have shown a procedure to determine the true, underlying material response from a time-periodic signal given discrete data points, such as the alignment factor calculated from neutron events. This is accomplished by rigorously deconvoluting the scattering data, which is unavoidably operated on by a sliding boxcar function in time during data processing. When applied to a particular time-resolved data set, the proposed sliding bin method gives the same temporal precision as the standard bin method, while greatly improving the temporal resolution. The full deconvolution procedure yields the true material response, which is unobtainable using binning alone. This procedure is general and can be applied to many forms of time-periodic scattering data.
Conclusions
An improved method of analyzing time-resolved elastic scattering data is shown to increase the precision of the functions derived from scattering information, while significantly decreasing the data acquisition time. The developed deconvolution procedure greatly improves the temporal resolution and the resulting accuracy of the calculated material response to an external excitation. Sample data sets with and without noise and SANS measurements taken during large amplitude oscillatory shear show that the experiment time can be reduced by one-third or more, depending on the time scale of the features. The improved accuracy and precision of the deconvolved signal features enable the scattering signal to be quantitatively linked to the measured rheology for the development of structure–property relationships.Acknowledgements
We acknowledge the support of the National Institute of Standards and Technology, U.S. Department of Commerce, in providing the neutron research facilities used in this work. This manuscript was prepared under cooperative agreement 70NANB12H239 from NIST, U.S. Department of Commerce. The statements, findings, conclusions and recommendations are those of the author(s) and do not necessarily reflect the view of NIST or the U.S. Department of Commerce.References
- D. I. Svergun, M. H. Koch, P. A. Timmins and R. P. May, Small angle X-ray and neutron scattering from solutions of biological macromolecules, Oxford University Press, 2013, vol. 19 Search PubMed.
- S. M. Perera, U. Shrestha, U. Chawla, A. V. Struts, S. Qian, M. F. Brown and X.-Q. Chu, Biophys. J., 2014, 106, 634a CrossRef.
- T. Nishida, A. Obayashi, K. Haraguchi and M. Shibayama, Polymer, 2012, 53, 4533–4538 CrossRef CAS.
- M. E. Helgeson, S. E. Moran, H. Z. An and P. S. Doyle, Nat. Mater., 2012, 11, 344–352 CrossRef CAS.
- J. M. Kim, A. P. Eberle, A. K. Gurnon, L. Porcar and N. J. Wagner, J. Rheol., 2014, 58, 1301–1328 CrossRef.
- G. Nagy, L. Kovács, R. Ünnep, O. Zsiros, L. Almásy, L. Rosta, P. Timmins, J. Peters, D. Posselt and G. Garab, Eur. Phys. J. E: Soft Matter Biol. Phys., 2013, 36, 1–12 CrossRef.
- S. Mahabir, D. Small, M. Li, W. Wan, N. Kučerka, K. Littrell, J. Katsaras and M.-P. Nieh, Biochim. Biophys. Acta, Biomembr., 2013, 1828, 1025–1035 CrossRef CAS.
- M. Fumagalli, S. Lyonnard, G. Prajapati, Q. Berrod, L. Porcar, A. Guillermo and G. Gebel, J. Phys. Chem. B, 2015, 119, 7068–7076, DOI:10.1021/acs.jpcb.5b01220.
- S. Jaksch, A. Schulz, K. Kyriakos, J. Zhang, I. Grillo, V. Pipich, R. Jordan and C. M. Papadakis, Colloid Polym. Sci., 2014, 292, 2413–2425 CAS.
- F. Kaneko, A. Radulescu and K. Ute, Polymer, 2013, 54, 3145–3149 CrossRef CAS.
- D. Q. Ly, T. Honda, T. Kawakatsu and A. V. Zvelindovsky, Macromolecules, 2007, 40, 2928–2935 CrossRef CAS.
- F. Michaux, N. Baccile, M. Impéror-Clerc, L. Malfatti, N. Folliet, C. Gervais, S. Manet, F. Meneau, J. S. Pedersen and F. Babonneau, Langmuir, 2012, 28, 17477–17493 CrossRef CAS.
- S. Rogers, J. Kohlbrecher and M. Lettinga, Soft Matter, 2012, 8, 7831–7839 RSC.
- A. K. Gurnon, C. R. Lopez-Barron, A. P. Eberle, L. Porcar and N. J. Wagner, Soft Matter, 2014, 10, 2889–2898 RSC.
- B. A. Schubert, E. W. Kaler and N. J. Wagner, Langmuir, 2003, 19, 4079–4089 CrossRef CAS.
- M. A. Calabrese, S. A. Rogers, R. P. Murphy and N. J. Wagner, J. Rheol., 2015, 59, 1299–1328 CrossRef CAS.
- M. E. Helgeson, P. A. Vasquez, E. W. Kaler and N. J. Wagner, J. Rheol., 2009, 53, 727–756 CrossRef CAS.
Footnote |
| † Present address: University of Illinois at Urbana-Champaign, Department of Chemical and Biomolecular Engineering, 600 S. Matthews Ave., Urbana, IL, USA. Tel: +1 217 333 0020; E-mail: E-mail: sarogers@illinois.edu |
| This journal is © The Royal Society of Chemistry 2016 |

![[small gamma, Greek, dot above]](https://www.rsc.org/images/entities/i_char_e0a2.gif)
