
Differential scanning fluorimetry illuminates silk feedstock stability and processability†
C.
Dicko‡
*a,
N.
Kasoju‡
bc,
N.
Hawkins
b and
F.
Vollrath
b
aDepartment of Chemistry, Division for Pure and Applied Biochemistry, Lund University, Getigevägen 60, 2241, Lund, Sweden. E-mail: cedric.dicko@tbiokem.lth.se
bDepartment of Zoology, University of Oxford, South Parks Road, OX1 3PS, Oxford, UK
cDepartment of Biomaterials and Bioanalogous Polymer Systems, Institute of Macromolecular Chemistry, Academy of Sciences of Czech Republic, Heyrovského Square 2, 162 06, Prague, Czech Republic
First published on 30th September 2015
Abstract
The ability to design and implement silk feedstock formulations for tailored spinning has so far eluded the bioengineers. Recently, the high throughput screening technique of differential scanning fluorimetry (DSF) demonstrated the link between the instability transition temperature (Ti) and the processability of the silk feedstock. Using DSF we screened a large set of chemicals known to affect solvent quality. A multivariate analysis of the results shows that, regardless of the diversity of chemicals, three groupings are significantly distinguishable: G1 = similar to native silk; G2 = largely dominated by electrostatic interactions; and G3 = dominated by chelating interactions. We propose a thermodynamic analysis based on a pre- and post-transition fit to estimate the van't Hoff enthalpies (ΔHv) and the instability temperature (Ti). Our analysis shows that the ΔTi and ΔHv values were distinct: G1 (ΔTi = 0.23 ± 0.2; ΔHv = −159.1 ± 5.6 kcal mol−1), G2 (ΔTi = −7.3 ± 0.7; ΔHv = −191.4 ± 5.5 kcal mol−1), and G3 (ΔTi = −19.9 ± 3.3; ΔHv = −68.8 ± 6.0 kcal mol−1). Our analysis further combined the ΔTi value and the ΔHv value using stability ΔΔG to find that G1 only marginally stabilizes native silks (ΔΔG = −0.15 ± 0.04 kcal mol−1), whereas G2 and G3 destabilize native silk (ΔΔG = 3.8 ± 0.11 and ΔΔG = 3.8 ± 0.3 kcal mol−1, respectively). Here our analysis shows that native silk has a complex multistep transition that is possibly non-cooperative. However, all three groupings also show a direct and cooperative transition with varied stabilization effects. This analysis suggests that native silks are able to sample multiple substates prior to undergoing (or to delay) the final transition. We conclude by hypothesizing that the observed energetic plasticity may be mediated by a fragile packaging of the silk tertiary structure that is readily lost when the solvent quality changes.
Introduction
Silks are a remarkable class of materials and as such are rapidly becoming benchmark materials not only for the development of novel bio-inspired materials2–4 but also for studies examining processes that control protein folding.5,6 After all, silks are multi-protein composite complexes that have evolved, convergently, in the insects and spiders to form filaments that are spun (i.e. transformed) without much input of external energy from an aqueous dope into a solid filament.7 And it is this significant feature of silk transition and transformation that forms the basis of our investigation presented here.Unspun silks can be harvested, if that is the right word, from the animal in quantities that allow a range of analytical techniques ranging from Differential Scanning Calorimetry, Dynamic Mechanical Thermal Analysis, Thermogravimetric Analysis,8 Rheometry9 and Light Spectroscopy to Neutron and X-Ray scattering.10–12 We note that all of these techniques study molecular transitions in response to modulations in temperature i.e. changes in thermal input. We further note that with all of these techniques throughput is a highly limiting constraint, as they all require individual samples. Differential scanning fluorimetry (DSF) on the other hand allows for a considerable throughput, with the option of concurrently running up to 96 samples of 25 μL for no longer than 190 min to complete a test run.1 This ability of DSF allows us to quickly and efficiently screen a wide range of individual solvents and small molecules in order to analyse their interactions with the folding of the silk protein. Fig. 1 summarises the information content available from a typical DSF profile.
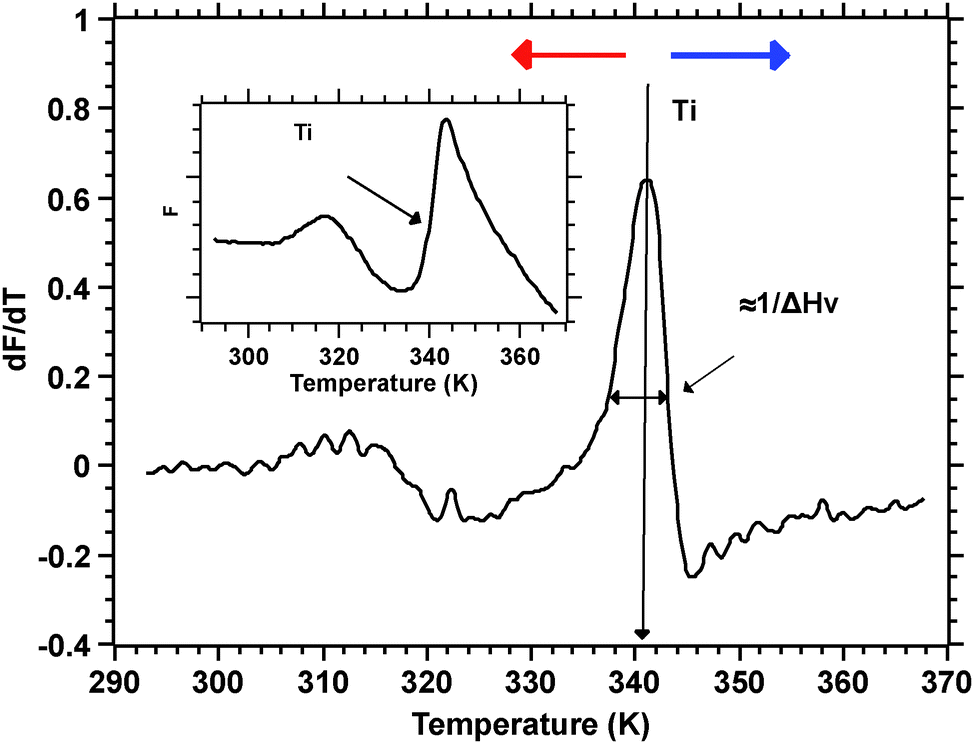 | ||
| Fig. 1 Inset: Typical fluorescence intensity as measured by DSF. The transition temperature Ti is at the inflexion point as shown by the arrow. The main plot shows the derivative of the fluorescence signal. The transition temperature Ti now appears as a peak and its width is inversely proportional to the van't Hoff enthalpy. | ||
Convention assigns a protein a ‘melt’ temperature Tm to denote the onset of molecular reconfiguration during denaturation; this is potentially confusing with the concept of Tm in the polymer literature. To avoid misunderstanding we call the point at which fluorescence changes most rapidly Ti – to denote the temperature induced instability of hydrogen interactions so fundamental to the protein ‘melt’ concept. Shortly after reaching the instability temperature, Ti, the rapid protein aggregation causes dye dissociation and an associated decrease of fluorescence.
There is a great need for such high-throughput studies (as of course there also is a need for high-detail studies) because Nature has produced many thousands of different silks, some with similar compositions and properties, and others differing hugely. Screening (whatever the technology used) allows us to group these silks not only taxonomically but also for their composition and, importantly, their functionality. As silks consist mostly of a set of (typically two) interacting proteins, that have evolved to efficiently and effectively transit from liquid to solid, silk diversity provides us with a powerful paradigm to study protein-folding transitions in great detail.
Here we focus on screening one particular silk, of the commercial mulberry silkworm Bombyx mori, in order to explore the power of the system. We examine, for example, how does trehalose, a well-known cryo-protectant,13 affect the folding transition, and its basis temperature, of a silk protein (it delays). Or, how do urea and guanidine, well known chaotropic agents,14 affect such a transition (they speed-up). Of course, there are concentration effects to be considered and also more subtle interactions to be uncovered by testing the Hoffmeister series.
In conclusion of the Introduction, the hypothesis tested by this study is simple and generic and investigates whether DSF can be used to probe silk protein transitions in a meaningful way.
Experimental
Materials
Live Bombyx mori silkworms about to spin and pupate were provided by the Padua Silk Station in Italy. The origin of the reagents is as follows: urea was from Calbiochem, Germany; sodium sulfate and D-maltose were from Scientific Laboratory Suppliers, UK; Sodium thiocyanate, ammonia and 2-propoanol were from VWR International Ltd, UK; deuterium oxide was from Merck, Germany; protein stabilizing cocktail (PSC) was from Thermo Scientific, UK; 1-Butanol was from Fisher Scientific, UK; Iron(II) chloride, Iron(III) chloride and Copper(II) chloride were from Alfa aesar, England. All other reagents were from Sigma-Aldrich, UK.Silk fibroin isolation from the native gland (NSF)
The worms were killed by decapitation and the glands were carefully dissected out in a clean Petri dish. They were first rinsed in ultrapure water for a few seconds and then submerged in slightly cold ultrapure water. After a couple of minutes, the epithelium was cautiously removed without causing any shear to the dope. The posterior-middle gland contents, which contain the pure fibroin, were collected in a clean Eppendorf tube, and the contents were diluted with ultrapure water in the 1![[thin space (1/6-em)]](https://www.rsc.org/images/entities/char_2009.gif) :10 ratio (w/v). The tubes were then placed horizontally on an orbital shaker, in a cold room, in order to solubilize the native silk dope. The NSF concentration (w/v) was determined by drying 200 μL of solution (oven-dried overnight at 60 °C). If necessary, the final working concentration was adjusted with ultrapure water to 2% (w/v, or 57 μM considering the molecular weight of fibroin as 350 kDa).
:10 ratio (w/v). The tubes were then placed horizontally on an orbital shaker, in a cold room, in order to solubilize the native silk dope. The NSF concentration (w/v) was determined by drying 200 μL of solution (oven-dried overnight at 60 °C). If necessary, the final working concentration was adjusted with ultrapure water to 2% (w/v, or 57 μM considering the molecular weight of fibroin as 350 kDa).
Differential scanning fluorimetry (DSF)
Concentration optimization for GdmHCl and Trehalose
Guanidinium hydrochloride (a standard protein-denaturing agent) and trehalose (a standard protein-stabilizing agent) of concentrations ranging from 57 μM to 1.14 M were tested against a constant NSF concentration (57 μM) to determine the optimum concentration for a test compound to be used. The first derivative fluorescence spectra and the differences in the Ti value are presented in Fig. S1 and S2 (ESI†). The Ti value of NSF was 68 ± 0.2 °C, and it remained so even in the presence of up to 57 mM GdmHCl and Tre. However, a drastic negative shift in Ti by −9 ± 0.1 °C was caused by 570 mM GdmHCl, and it was further shifted by −15.4 ± 1 °C at 1.14 M concentration. Such negative changes in thermal denaturation kinetics were clear signs of the drastic denaturing effects of GdmHCl on NSF. In contrast, a considerable positive shift in Ti by 2.4 ± 0.3 °C was caused by 570 mM Tre, and it was further shifted by 3.4 ± 0.1 °C at 1.14 M concentration. These positive deviations in Ti of NSF can be attributed to the stabilizing effects of Tre. Our observations are in good agreement with the literature. For example, previous DSF studies on bovine lactoperoxidase in the presence of 0.5 M GdmHCl revealed a notable −3.7 °C negative change in the Ti value;15 similarly, DSF studies on the silk fibroin dope showed that 0.2 M Tre positively shifted the Ti value by about 1.3 °C.1 Therefore, in the current study, we begin our experiments by using GdmHCl and Tre as the standard protein-destabilizing and stabilizing agents, respectively; and based on our observations, 570 mM concentration was followed for the rest of the other test compounds in subsequent experiments. By analogy with GdmHCl, urea concentration was also set at 570 mM.Data analysis
 | (1) |
| N ⇆ D | (2) |
 | (3) |
 | (4) |
 | (5) |
 | (6) |
 | (7) |
 | (8) |
 | (9) |
This approach for determining Ti and ΔHv requires that we assume the underlying transition is two states (eqn (2)). Although a two-state assumption can be an oversimplification, this analysis is still useful. Intermediates often accumulate preferentially under conditions far from the Ti. Such intermediates include pre-melting transitions and aggregation. In favourable cases, the denaturation transition closely approaches a two-state process at the midpoint of the process.17,18 Moreover, differential transition profiles are approximately symmetrical about Ti. Therefore, agreement between fits using primarily pre- vs. post-transition data provides an independent method for identifying some classes of non-two-state transitions. To further understand the DSF data we exploit the latter assumption and compute for all samples, the full fit, and the pre- and post-transition fit using eqn (7). We define the pre-transition fit from the start temperature to the temperature at 80% of the transition peak. We define the post-transition fit from the temperature at 80% of the transition peak to the temperature at which dF/dT = 0.
Statistical evaluation of thermodynamic analysis
To determine the significance of the calculated thermodynamic parameters (Ti, van't Hoff enthalpy, ratio of enthalpy and stability) the observables from groupings G1, G2 and G3 were added to a general linear model (GLM) using Minitab 17 (Minitab Inc.). The calculated thermodynamic parameters were analysed simultaneously and a pairwise Tukey test was applied to compare the groups.Results and discussion
Multivariate analysis
To analyse the large amount of data generated by the experiment we performed a multivariate analysis on the full DSF profiles to help identifying any underlying trends in the dataset. Here we choose an unsupervised classification method, PCA. Fig. 2 shows a biplot of the PCA to directly identify the weight of each observation (the selected solvents) on the grouping of the DSF curves. 3 regions are readily identified: G1, which contains the native silk as well as the more loosely defined groupings G2 and G3. Details of the group composition and ΔTi are given in Table 1.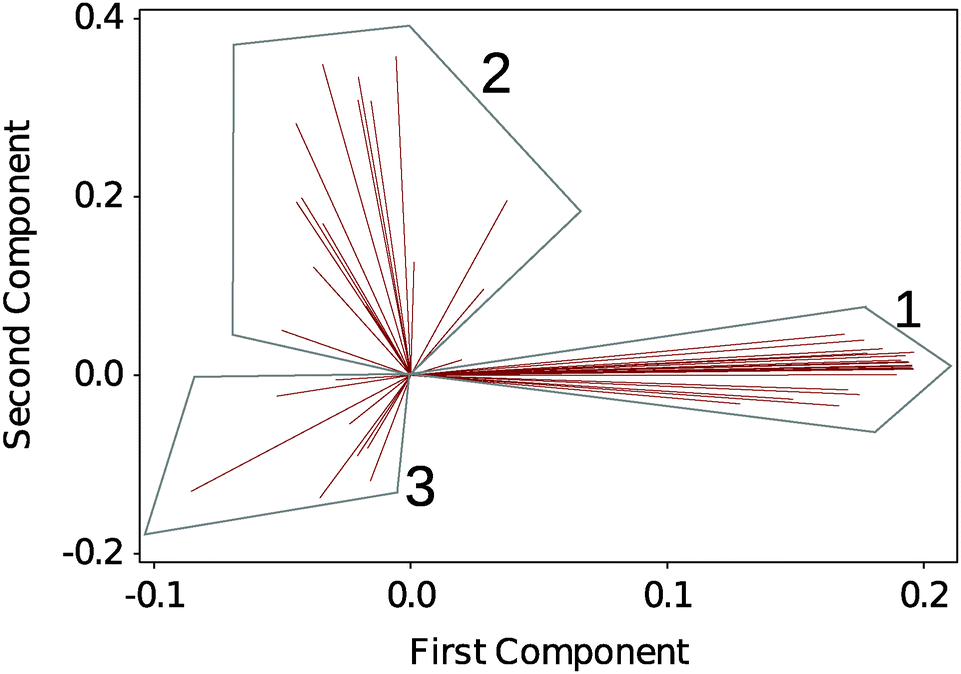 | ||
| Fig. 2 Biplot analysis of DSF curves using principal component analysis (PCA). 3 groups are identified. Each line identifies a solvent condition. Table 1 summarizes the groups' composition. | ||
| Group 1 | Group 2 | Group 3 | |||
|---|---|---|---|---|---|
| Agent | ΔTi | Agent | ΔTi | Agent | ΔTi |
| NA = not available, due to the lack of the prominent peak. | |||||
| Native silk | 0 ± 0.20 | Ammonia | −12.10 ± 0.35 | CuCl2 | NA |
| NaCl | −5.24 ± 0.08 | ZnCl2 | −27.58 ± 0.53 | ||
| Glucose | 0.86 ± 0.32 | KCl | −5.16 ± 0.01 | AlCl2 | NA |
| Sucrose | 2.0 ± 0.13 | NaSCN | −10.81 ± 0.57 | CaCl2 | −14.74 ± 0.61 |
| Maltose | 0.40 ± 0.12 | NaCLO4 | −9.41 ± 0.20 | MgCl2 | −12.64 ± 0.24 |
| Fructose | 1.62 ± 0.41 | NaNO2 | −5.76 ± 0.20 | FeCl3 | NA |
| Trehalose | 2.37 ± 0.28 | Acetic acid | NA | ||
| Formic acid | NA | BSA | NA | ||
| Glycerol | −1.08 ± 0.20 | GdmHCl | −9.12 ± 0.15 | Heparin | −24.68 ± 0.47 |
| PEG4000 | −0.12 ± 0.07 | ||||
| Ethylene glycol | 0.01 ± 0.06 | Na2HPO4 | −21.48 ± 3.48 | ||
| Methanol | 0.16 ± 0.13 | Na2SO4 | −7.26 ± 0.12 | ||
| Ethanol | −0.42 ± 0.22 | EMIM | −6.26 ± 0.09 | ||
| Propanol | −0.84 ± 0.07 | BMIM | −8.59 ± 0.31 | ||
| DMSO | 0.49 ± 0.07 | PSS | −3.48 ± 0.09 | ||
| Urea | −0.94 ± 0.08 | ||||
| D2O | 1.07 ± 0.21 | Butanol | −5.67 ± 0.26 | ||
Within Table 1, the different solvent conditions have been organized so that within each grouping the solvents of similar effects are mapped together. Fig. S3–S9 in the ESI,† show the individual thermograms.
In G1, we recognize the polar solvents, the stabilizing sugars and, surprisingly, the hydrogen bond disruptor urea. In G2, we recognize the organic acids, the monovalent salts, the ionic liquids and as a possible outlier butanol. In G3, we recognize the divalent and trivalent ions as well as the proteins.
In order to understand and quantify the stabilizing or destabilizing effects of the solvent we used the following analysis.
Thermodynamic analysis
The thermodynamic parameters are estimated by fitting eqn (7) to the DSF (dF/dT) profiles. Care must be exercised in order to correctly fit the DSF profiles. First, a truncation must be applied to remove the effect of the dye aggregation. Fig. 3 shows the full DSF profile and the truncation applied.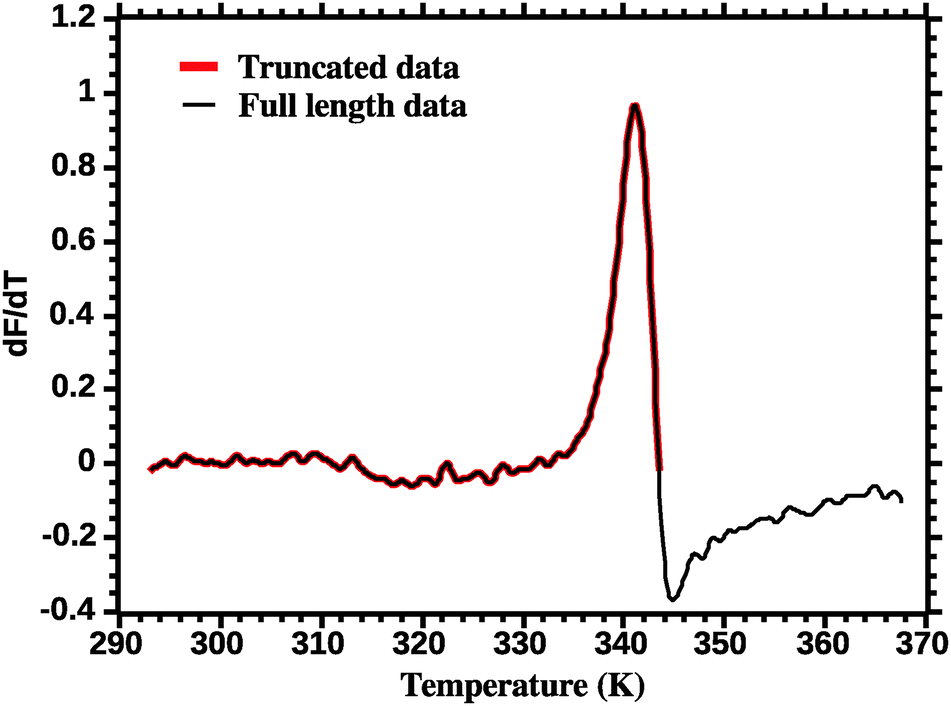 | ||
| Fig. 3 Truncation of DSF data prior to van't Hoff analysis (see the Experimental section for details). | ||
The second critical transformation concerns the range of temperatures to which the fit is applied. Fig. 4 shows a plot of the whole profile; the lack of fit is intrinsic to thermal denaturation monitored by spectroscopic data.
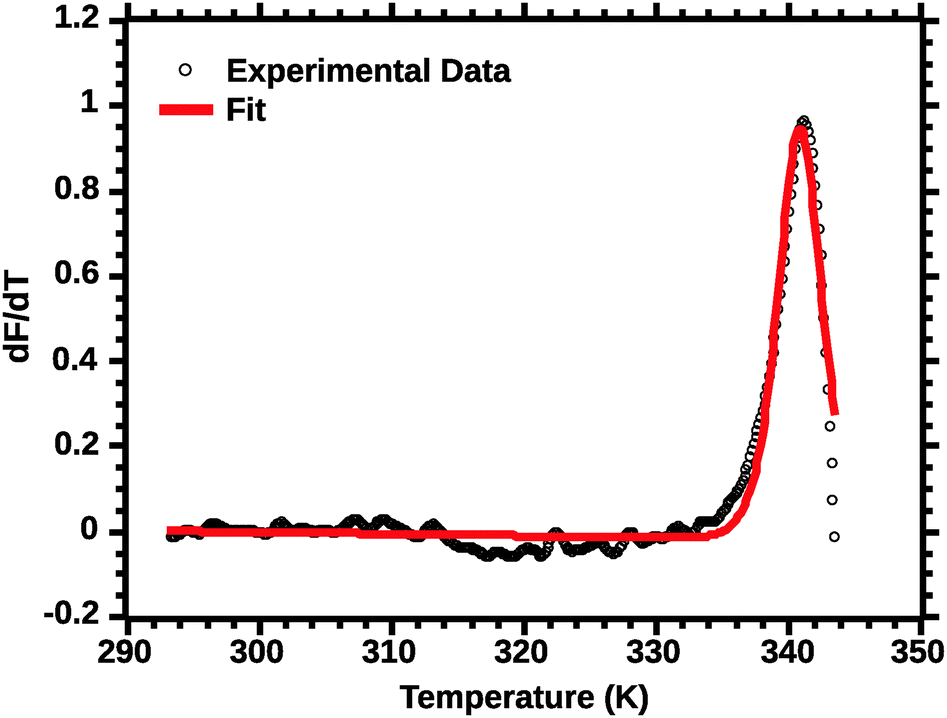 | ||
| Fig. 4 van't Hoff fit of a typical silk DSF truncated profile. Note the poor fit of the transition peak. | ||
Differential transition profiles are approximately symmetrical about transition temperature (Ti).18 Therefore, agreement between fits using primarily pre- vs. post-transition data (compare Fig. 5 and 6) provides an independent method for identifying some classes of non-two-state transitions. For example, early fraying transitions prior to cooperative denaturation of the protein core should be readily detected.17
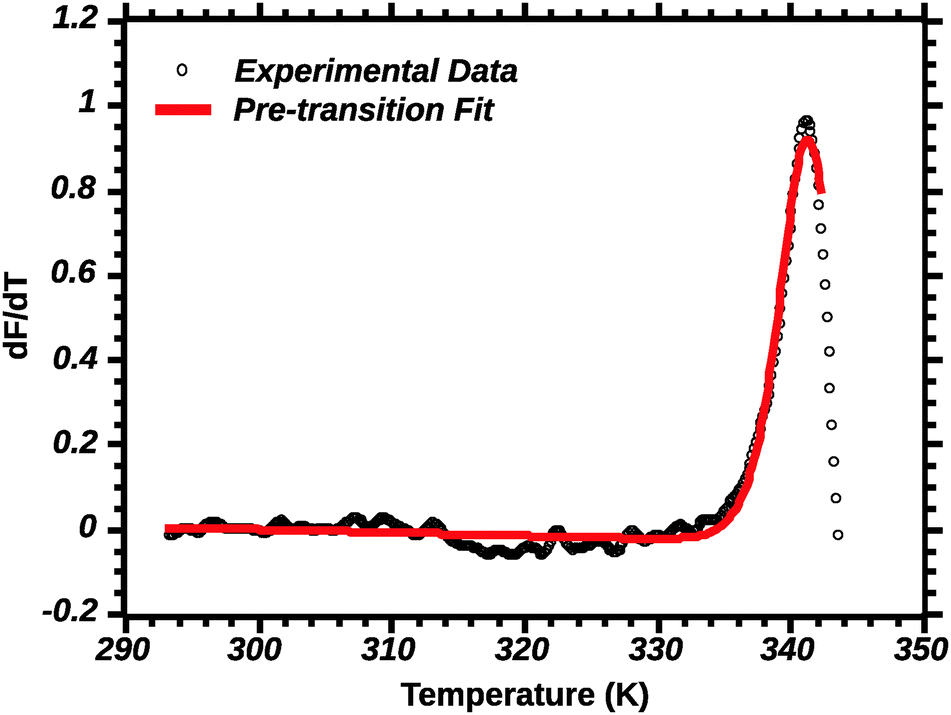 | ||
| Fig. 5 Pre-transition van't Hoff fit of DSF (see the Experimental section for details). Note the poor fit of the transition peak. | ||
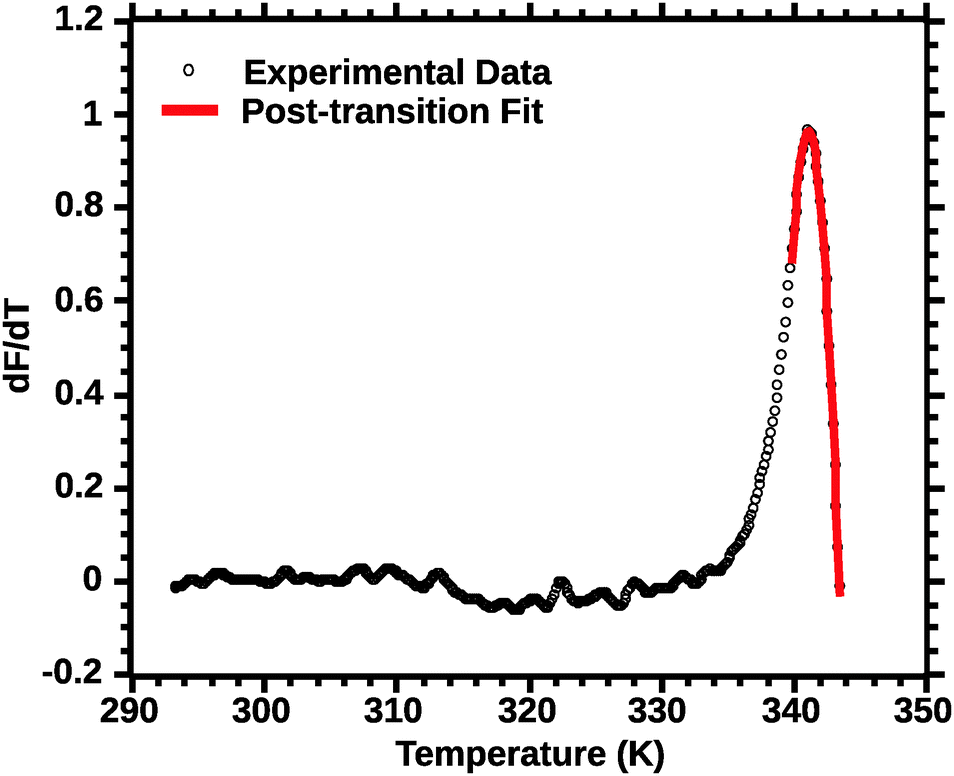 | ||
| Fig. 6 Post-transition van't Hoff fit of DSF (see the Experimental section for details). Note the improved quality of the fit for the transition peak as compared to Fig. 4 and 5. | ||
In favourable cases the transition approaches a 2-state model near the mid-point (Ti).18 A qualitative appraisal of the fits suggests that the post-transition fit (Fig. 6) showed a fit nearest to a 2 state model. Henceforth for the extraction of the thermodynamic parameters we used the post-transition fit. Interestingly, we noted that the Ti alone was conserved regardless of the type of fit used (data not shown). This suggests that Ti is, for the current approach, not a parameter sensitive enough to evaluate the effect of solvent quality on silk stability.
In analogy to the ratio of van't Hoff (ΔHv) and calorimetric (ΔHcal) enthalpies, we computed the ratio of the pre- and-post transition van't Hoff enthalpies. Typically the former ratio (referred as c) is directly proportional to the cooperativity of the transition.19 Here the ratio of the pre- to post-transition ΔHv provides instead an independent method for identifying some classes of non-two-state transitions. A two state model would have a ratio of 1. Fig. 7 shows the ratio of the post- and pre-transition.
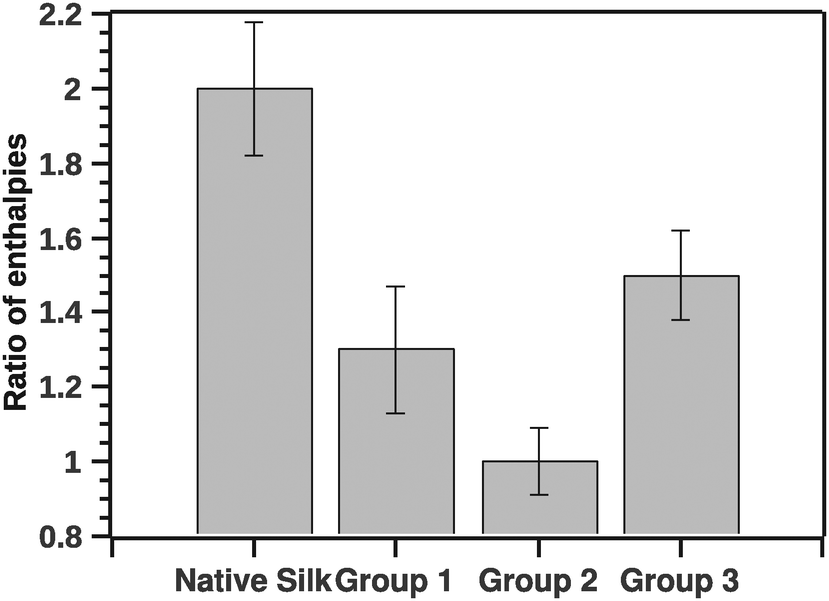 | ||
| Fig. 7 Ratio of pre- to post-transition van't Hoff enthalpies. The ratio is indicative to a number of steps in the transition. Ratio 1 is a typical 2 state transition. | ||
The GLM analysis of the enthalpic ratio at the 95% level was significant regarding differences between the three proposed groupings (N = 44, p < 0.001). The pairwise comparison showed that the enthalpic ratio for native silk was significantly different from G1 (p = 0.011), and from G2 (p < 0.001); but not significantly different from G3 (p = 0.547). Groupings G1, G2 and G3 were not significantly different from each other. Interpreting the ratio suggests that native silk has a more complex transition mechanism (ratio > 2), whereas in all groupings the ratio was closer to 1. This may indicate that the additives alter the initial conformation of native silk and thus likely change a long-range interaction present during silk storage. Interestingly, the change in ratio, although similar in all groups, was not reflected in the Ti of the groups. Fig. 8 summarizes the ΔTi (relative to native silk).
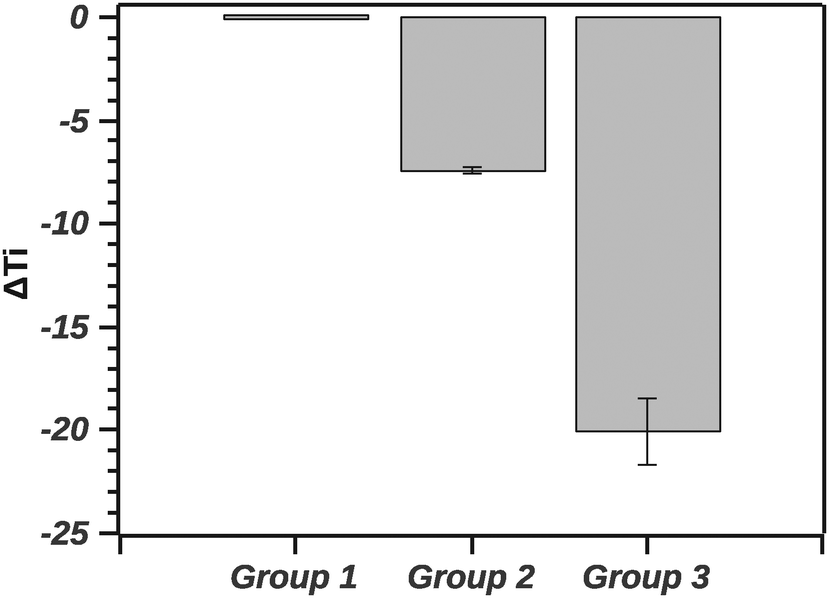 | ||
| Fig. 8 Comparison of ΔTi across groups. ΔTi is the change in Ti relative to native silk. | ||
The GLM analysis of the ΔTi at the 95% level was significant with regard to the groups (N = 44, p < 0.001). The pairwise comparison using the Tukey test shows that native silk was not significantly different from G1 (p = 0.840). On the other hand, native silk Ti was significantly different from each of the group's Ti (p < 0.001). Furthermore all the groups' Ti values were significantly different from one another (p < 0.001). Quantitatively, in Fig. 7, the values of ΔTi indicate that G1 was only marginally different from native silk (as supported by the Tukey test). While G2 with a ΔTi value of −7.3 ± 0.7 and G3 with −19.9 ± 3.3 showed increasing destabilization of the silk proteins in solution. The effect observed within G2, shown in Table 1, could be attributed to electrostatic interactions and from G3 e.g. by chelating effects from multivalent ions.
Another parameter of importance was the van't Hoff enthalpy. As stated above, we considered solely the post-transition fit to extract the Ti and van't Hoff enthalpy. Fig. 9 summarizes the ΔHv value for the native silks as well as all three groupings.
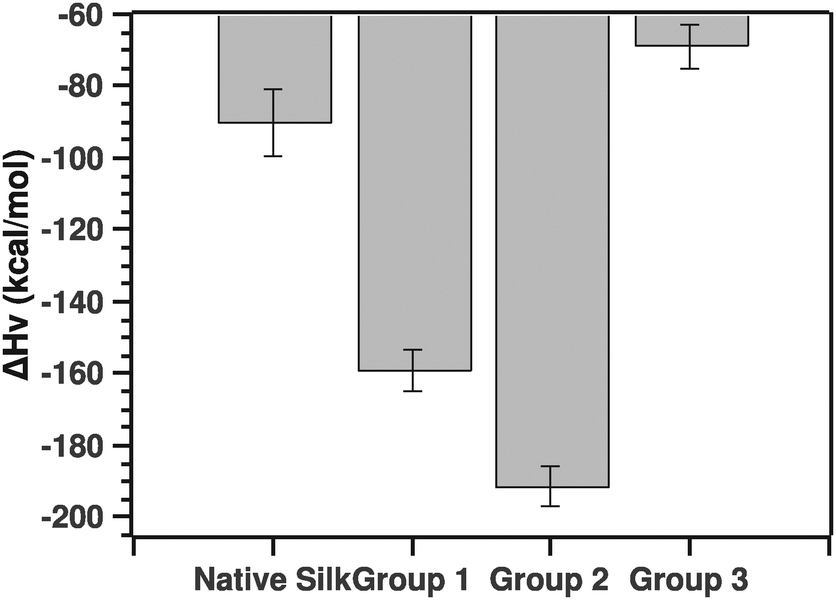 | ||
| Fig. 9 Comparison of van't Hoff enthalpies calculated from the post-transition fit (see the text for details). | ||
The pairwise Tukey test showed that native silk was not significantly different from G3 (p = 0.784), but differed significantly from G1 and G2 (p = 0.034 and p = 0.002, respectively) while G1 and G2 were not significantly different from one another (p = 0.587) and G3 differed significantly from G1 and G2 (p = 0.028 and p = 0.003, respectively).
Before discussing the quantitative aspects of the van't Hoff enthalpy, it is important to remember the meaning of the van't Hoff enthalpy. By definition, the van't Hoff enthalpy measures the rate of change with temperature of the population of the folded state with respect to the unfolded state. This is in contrast to the calorimetric enthalpy that measures the heat absorbed on unfolding subunits. In other words, the larger (in absolute value) the van't Hoff enthalpy is, the sharper the transition and the faster the conversion from one state to the other. Given this interpretation, native silk and to some extend grouping G3 showed transitions dominated by either conformational plasticity or smaller units. The latter point is important to consider since the enthalpy is a molar one, thus dependent on the size of the units undergoing the transition.20 Groupings G1 and G2, on the other hand, had a much higher van't Hoff enthalpy, most likely a more cooperative transition. For example, the protein can form hydrogen bonds easily or interestingly the proteins are already associated in larger units that are in turn undergoing the transition. G3 surprisingly had a low van't Hoff enthalpy. Given the ΔTi, one could speculate that the proteins undergoing the transition may be very large entities.
On a cautionary note: even though the Sypro dye is in excess, one cannot rule out that the SYPRO dye binding interaction is only measuring an apparent conformational change which, in reality, would be a manifestation of dynamic processes of the sypro fluorescence process convoluted with the true conformational change.
Finally, in order to evaluate the stability imparted on native silk by the different agents we use an estimate of the change in stability (see ref. 18) as defined by the change in free energy ΔΔG:
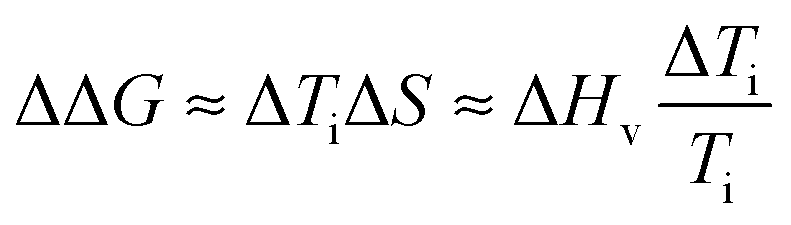 | (10) |
Fig. 10 summarizes the effect of solvent quality for the groups.
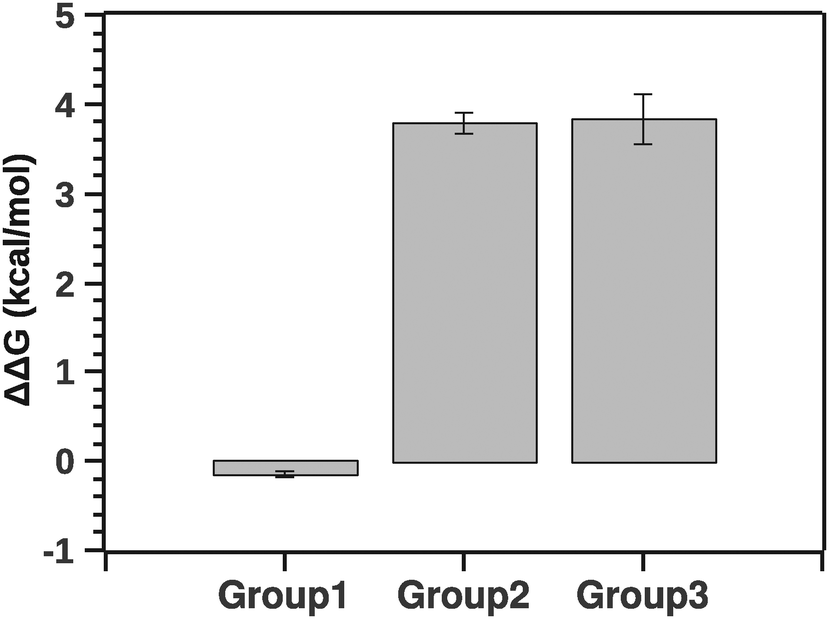 | ||
| Fig. 10 Comparison of stability (ΔΔG) between groups relatively to native silk. Negative ΔΔG shows stabilizing effects (group 1) and positive ΔΔG shows de-stabilizing effects (groups 2 and 3). | ||
The pairwise Tukey test indicates that G1 was significantly different from G2 and G3 (p < 0.001 and p < 0.001, respectively) while G2 and G3 were not significantly different from each other (p = 0.999). Numerically ΔΔG of grouping G1 was marginally negative suggesting a stabilizing effect, whereas ΔΔG of groupings G2 and G3 was positive, implying a destabilizing effect. Interestingly, the destabilization is energetically equivalent to a few hydrogen bonds. This suggests that silk in its native state and silk in the presence of agents may not be so different conformationally. Here it is important to note that a simple change of conformation alone does not guarantee that there is any significant change in enthalpy. Consider a disordered protein: the reason it is disordered is because there are many structures around the (effective) minimum energy of the structure that are very similar in energy, even if they look different visually. So a simple conformational change does not necessarily mean that there is any significant change in the energy.
Conclusions
Silk is rapidly becoming a powerful benchmark material for studies on a class of complex fibrous proteins.5 An interesting analogy to silk is found in the myosin/tropomyosin family of α-helical coiled-coil proteins20,21 where, like in our silks, thermal unfolding is a highly non-cooperative process, involving several overlapping transitions over an extended range of temperatures. This probably represents the unfolding of various independent or semi-independent domains in these large proteins, and makes thermodynamic analysis difficult.21 Our studies presented here confirm the assertion that the technique of DSF is truly remarkable in the sense that a relatively low-cost, high-throughput method can help to specify and test and thus begin to resolve the folding behaviour of fibrous proteins as complex as silk molecules.This rapid evaluation of processability of silk proteins as a function of solvent quality provides valuable and revealing insights. Surprisingly, in our study presented here we discovered that solvent quality yielded 3 distinct groupings of molecular behaviour, each characterized by a specific ΔTi, ΔHv and ΔΔG. The analyses developed in this study revealed that many different aspects of the temperature-induced transition of silk can be investigated using DSF, for example, the departure from 2 state transitions, the sharpness of the transition (linked to substrate plasticity or size of the starting protein) and the stability.
We conclude with the observation that our data support the assertion that Nature has designed and packed native silk protein in such a way that unwanted transitions to the beta-rich state can be, and are, controlled through conformational plasticity that displays only marginal inherent stability.
Acknowledgements
NK acknowledges support from the project BIOPOL (grant number EE2.3.30.0029), which was funded by the Ministry of Education, Youth and Sports of Czech Republic with the participation of the European Union funds. CD acknowledges support from the Craaford foundation (20140817) and the Swedish science council (VR-UFORSK 348-2013-6218). FV and NH acknowledge support from the US-AFOSR (FA9550-12-1-0294).References
- F. Vollrath, et al., Differential Scanning Fluorimetry provides high throughput data on silk protein transitions, Sci. Rep., 2014, 4, 5625 CrossRef CAS PubMed.
- F. Vollrath and D. Porter, Silks as ancient models for modern polymers, Polymer, 2009, 50, 5623–5632 CrossRef CAS.
- F. G. Omenetto and D. L. Kaplan, New Opportunities for an Ancient Material, Science, 2010, 329, 528–531 CrossRef CAS PubMed.
- F. Vollrath, D. Porter and C. Holland, The science of silks, MRS Bull., 2013, 38, 73–80 CrossRef CAS.
- D. Porter and F. Vollrath, Water mobility, denaturation and the glass transition in proteins, Biochim. Biophys. Acta, Proteins Proteomics, 2012, 1824, 785–791 CrossRef CAS PubMed.
- D. Porter and F. Vollrath, Water mediated proton hopping empowers proteins, Soft Matter, 2013, 9(3), 643–646 RSC.
- C. Holland, et al., Silk and synthetic polymers; reconciling 100 degrees of separation, Adv. Mater., 2012, 24, 105–109 CrossRef CAS PubMed.
- T. Tanaka, et al., Thermal properties of bombyx mori and several wild silkworm silks, J. Therm. Anal. Calorim., 2002, 70, 825–832 CrossRef CAS.
- P. R. Laity, S. E. Gilks and C. Holland, Rheological behaviour of native silk feedstocks, Polymer, 2015, 67, 28–39 CrossRef CAS.
- F. Vollrath, D. Porter and C. Dicko, et al., The structure of silk, in Handbook of Textile Fibre Structure, ed. S. J. Eichhorn, Woodhead, 2009, pp. 146–198 Search PubMed.
- I. Greving, et al., Small angle neutron scattering of native and reconstituted silk fibroin, Soft Matter, 2010, 6, 4389–4395 RSC.
- M. Boulet-Audet, et al., Silk protein aggregation kinetics revealed by rheo-IR, Acta Biomater., 2014, 10(2), 776–784 CrossRef CAS PubMed.
- N. K. Jain and I. Roy, Effect of trehalose on protein structure, Protein Sci., 2009, 18(1), 24–36 CAS.
- O. D. Monera, C. M. Kay and R. S. Hodges, Protein denaturation with guanidine hydrochloride or urea provides a different estimate of stability depending on the contributions of electrostatic interactions, Protein Sci., 1994, 3(11), 1984–1991 CrossRef CAS PubMed.
- B. Zelent, K. A. Sharp and J. M. Vanderkooi, Differential scanning calorimetry and fluorescence study of lactoperoxidase as a function of guanidinium–HCl, urea, and pH, Biochim. Biophys. Acta, Proteins Proteomics, 2010, 1804(7), 1508–1515 CrossRef CAS PubMed.
- R. G. Brereton, Data Analysis for the Laboratory and Chemical Plant, Chemometrics, John Wiley & Sons, Ltd., 2003, p. 489 Search PubMed.
- D. M. John and K. M. Weeks, van't Hoff enthalpies without baselines, Protein Sci., 2000, 9, 1416–1419 CrossRef CAS PubMed.
- A. Fersht, Structure and mechanism in protein scinece: a guide to enzyme catalysis and protein folding, Freeman, New York, 1999, p. 631 Search PubMed.
- D. T. Haynie, Statistical thermodynamics, Cambridge University Press, 1988 Search PubMed.
- A. Cooper, Thermodynamic of protein folding and stability, in Protein: A comprehensive treatise, ed. G. Allen, JAI Press Inc, 1999 Search PubMed.
- P. L. Privalov, Stability of proteins, in Proteins which do not present a single cooperative system, Adv. Protein Chem., 1982, 35, 1–104 CrossRef CAS PubMed.
Footnotes |
| † Electronic supplementary information (ESI) available. See DOI: 10.1039/c5sm02036k |
| ‡ CD and NK contributed equally to this work. |
| This journal is © The Royal Society of Chemistry 2016 |