Peroxidised phospholipid bilayers: insight from coarse-grained molecular dynamics simulations
Yachong
Guo
a,
Vladimir A.
Baulin
a and
Fabrice
Thalmann
 *b
*b
aDepartament d'Enginyeria Quimica, Universitat Rovira i Virgili 26 Av. dels Paisos Catalans, 43007 Tarragona, Spain
bInstitut Charles Sadron, CNRS and University of Strasbourg, 23 rue du Loess, F-67034 Strasbourg, France. E-mail: thalmann@ics.u-strasbg.fr; Fax: +33 388414099; Tel: +33 388414097
First published on 1st October 2015
Abstract
An original coarse-grained model for peroxidised phospholipids is presented, based on the MARTINI lipid force field. This model results from a combination of thermodynamic modelling and structural information on the area per lipid, which have been made available recently. The resulting coarse-grained lipid molecules form stable bilayers, and a set of elastic coefficients (compressibility and bending moduli) is obtained. We compare the compressibility coefficient to the experimental values [Weber et al., Soft Matter, 2014, 10, 4241]. Predictions for the mechanical properties, membrane thickness and lateral distribution of hydroperoxide groups in the phospholipid bilayer are presented.
1 Introduction
Oxidative stress1 plays an important role in regulating vital processes in living organisms: defense against bacteria, cell apoptosis, immune response, cell maturation and differentiation. Free radicals or reactive oxygen species (ROS)1 may react chemically with cell constituents, leading to irreversible damage. The first line of defense of cells is the cell membrane2 where lipids, proteins, cholesterol, vitamins and fatty acids first interact with the external environment of the cell.It is generally accepted3,4 that the protection of cell membranes from oxidation stress is due to the incorporation of molecules containing weak chemical bonds (anti-oxidants): vitamins, unsaturated fatty acids, and unsaturated lipids that can break and deactivate free radicals. In particular, oxygen radicals damage the weak double bond in the tails of unsaturated lipids and fatty acids, provoking changes in their conformations and disturbing the bilayer. A balanced amount of free radicals and anti-oxidants is essential for normal function of living organisms.5 However, when this balance is altered, it can lead to a series of diseases ranging from cancer and diabetes to several ageing diseases6 such as Parkinson and Alzheimer diseases.
Lipid peroxidation is a major consequence of oxidative damage to cell membranes due to various external factors1,3 such as reactive oxygen species (ROS), inflammation, catalysis by peroxisomal oxidases, virus phagocytosis, and ultraviolet and ionic irradiation. Photooxidation of giant lipid vesicles allows quantification of the effect of oxidation on lipid bilayers.7–11 In particular, with a careful choice of photosensitizer, it becomes possible to generate specifically lipid peroxides.9 This approach allows control of the rate of oxidation and the total area of the vesicle, providing information on the rigidity of the lipid bilayer and the variation of the area per lipid with the degree of oxidation.
In turn, lipid bilayer structure modifications due to oxidised lipids can be directly assessed using all-atom molecular dynamics (MD) simulations,12 including peroxidised polyunsaturated lipids.13–15 The coarse-grained (CG) model of oxidised species16 and single chain mean field (SCMF) approaches have been introduced only recently.9,17 According to these simulations, the increase of area per lipid, the decrease of bilayer thickness and the shift of the peroxidised group towards the surface of the bilayer are general manifestations of oxidation.
In this paper we introduce a coarse-grained molecular model of hydroperoxidised lipids based on recent experimental data.9,11 Using this model we evaluate the effect of peroxidation on the thermodynamic and mechanical properties of fully peroxidised lipid bilayers.
Coarse-grained models have been widely used to describe the structure and dynamic properties of lipid bilayers, providing good pictures of the self-assembly of lipid bilayers and collective phenomena.18 One of the most widely employed coarse-grained models of lipid bilayers for molecular dynamics simulations is the MARTINI force field,19 which gives realistic structure and elastic properties of lipid bilayers. Thus, we use this model as a starting point for peroxidised phospholipid molecules.
2 Coarse-grained models of hydroperoxidised lipids
We construct oxidised lipid models based on the original MARTINI models19 for 1-palmitoyl-2-oleoyl-sn-glycero-3-phosphocholine (POPC) and 1,2-dioleoyl-sn-glycero-3-phosphocholine (DOPC) phospholipid molecules. We assume that hydroperoxidation acts on the double bond in the tail, C![[double bond, length as m-dash]](https://www.rsc.org/images/entities/char_e001.gif) C, resulting in a shift of its position and the addition of a side –OOH group. Further oxidation damage to lipids may cause chain cleavage and severe lipid degradation, which we do not consider in the present study.
C, resulting in a shift of its position and the addition of a side –OOH group. Further oxidation damage to lipids may cause chain cleavage and severe lipid degradation, which we do not consider in the present study.
The MARTINI coarse-graining strategy is based on a 4 atom to 1 bead correspondence,19 with effective potentials between beads accounting for the thermodynamic mixing properties of the underlying molecular sub-groups. Hydroperoxidation has the effect of adding two oxygens atoms to an existing group of 4 carbons (Fig. 1) as a result of so-called Type II photooxidation reactions.22,23 The CG model must therefore account for 6 atoms with amphipathic properties.
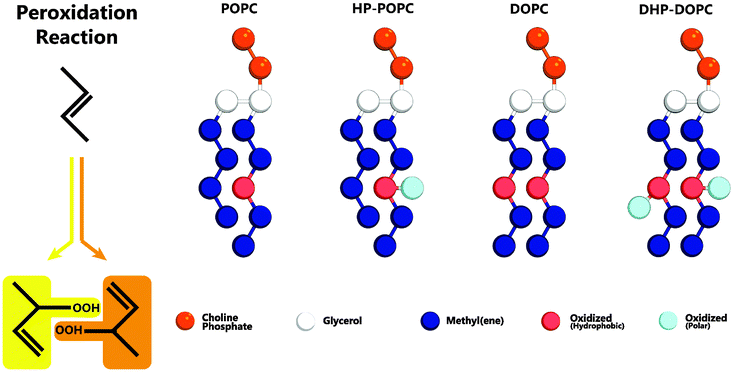 | ||
| Fig. 1 Left: addition of reactive singlet oxygen to a chain unsaturation. Right: oxidised lipid molecules based on MARTINI coarse-grained models for POPC and DOPC phospholipids: HP-POPC and DHP-DOPC, respectively. Bead types without exception are already present in the MARTINI model,19 without change in the mutual interaction parameters. | ||
We consider that the two peroxidised products are indistinguishable at the coarse-grained level adopted here, and assume that both can be suitably represented by a single assembly of beads with average properties. The hydrophobic part retains an unsaturated C![[double bond, length as m-dash]](https://www.rsc.org/images/entities/char_e001.gif) C bond, as in the original target. The hydrophilic part OOH is without doubt a polar group with donor and acceptor hydrogen bonding character. The 6 atom group C4OOH is bulkier than the original unoxidised group C4. One could imagine introducing for that a larger bead, but it would then be necessary to reimplement all the pairwise Lennard-Jones interactions with the other existing coarse-grained beads. Then, a bead of intermediate polarity can only poorly reproduce the two-sided (hydrophobic-polar) character of C4OOH. In contrast, a set of two beads (dimer) can optimally traduce the intrinsic amphipathy of the group. By adjusting the separation between beads, as in the case of the glycerol backbone, the bulkiness of the pair can be set to a reasonable value, 50% higher than the original C4 group (6 atoms instead of 4).
C bond, as in the original target. The hydrophilic part OOH is without doubt a polar group with donor and acceptor hydrogen bonding character. The 6 atom group C4OOH is bulkier than the original unoxidised group C4. One could imagine introducing for that a larger bead, but it would then be necessary to reimplement all the pairwise Lennard-Jones interactions with the other existing coarse-grained beads. Then, a bead of intermediate polarity can only poorly reproduce the two-sided (hydrophobic-polar) character of C4OOH. In contrast, a set of two beads (dimer) can optimally traduce the intrinsic amphipathy of the group. By adjusting the separation between beads, as in the case of the glycerol backbone, the bulkiness of the pair can be set to a reasonable value, 50% higher than the original C4 group (6 atoms instead of 4).
Our systematic investigations lead us to the conclusion that an optimal choice is the adjunction of a MARTINI C3 (hydrophobic) bead to a MARTINI P2 (polar, H-bonding donor and acceptor) bead, separated by 0.33 nm, smaller than the standard lipid bonding distance (0.47 nm). Note that the structural properties of the resulting bilayer depend quite sensitively on this separation. This choice, as explained in Section 4, comes from a comparison with the experimental change in area per lipid resulting from the complete hydroperoxidation of the unsaturated pure POPC and DOPC lipid bilayers. The average increase in area per lipid following complete peroxidation is reported to be +15.6% for POPC bilayers, and +19.1% for DOPC bilayers, respectively.9 Similar area changes were also obtained by monitoring giant vesicles adhering onto specially prepared adhesive surfaces,11 then leading to relative area changes of +14.3% and +18.4% for oxidised POPC and DOPC vesicles, respectively. These values are fairly consistent, given the practical difficulties inherent to these experimental techniques. This combination of results puts stringent constraint on the CG candidate models.
Mapping to this structural quantity, however, is no substitute for performing a thermodynamic mixing assay of the C4OOH target group. For this purpose, knowing the chemical structure of the oxidised lipid, we selected tert-butyl hydroperoxide (TBHP, CAS 75-91-2, a commercial bleaching agent)24 as the best analogue to the peroxidised functional group C4O2. The values of water solubility and octanol/water partitioning log![[thin space (1/6-em)]](https://www.rsc.org/images/entities/char_2009.gif) Pow data of TBHP that we could find are scattered between 0.6 and 1.23, while simulations of the C3–P2 dimer alone suggest a numerical, coarse-grained log
Pow data of TBHP that we could find are scattered between 0.6 and 1.23, while simulations of the C3–P2 dimer alone suggest a numerical, coarse-grained log![[thin space (1/6-em)]](https://www.rsc.org/images/entities/char_2009.gif) Pow = 1.4. Finally, the acidic constant of TBHP, pKa = 12.8, suggests a predominantly protonated, neutral hydroperoxide group, for neutral or slightly acidic pH solutions.
Pow = 1.4. Finally, the acidic constant of TBHP, pKa = 12.8, suggests a predominantly protonated, neutral hydroperoxide group, for neutral or slightly acidic pH solutions.
In what follows, we designate by HP-POPC the hydroperoxidised POPC molecule, and by DHP-DOPC the doubly hydroperoxidised DOPC (Fig. 1). We find that bilayers formed with pure HP-POPC and DHP-DOPC are stable, and provide a set of numerically estimated structural and mechanical parameters, associated with these two lipid bilayers. Snapshots of bilayers formed with POPC, DOPC, HP-POPC and DHP-POPC are provided in Fig. 2.
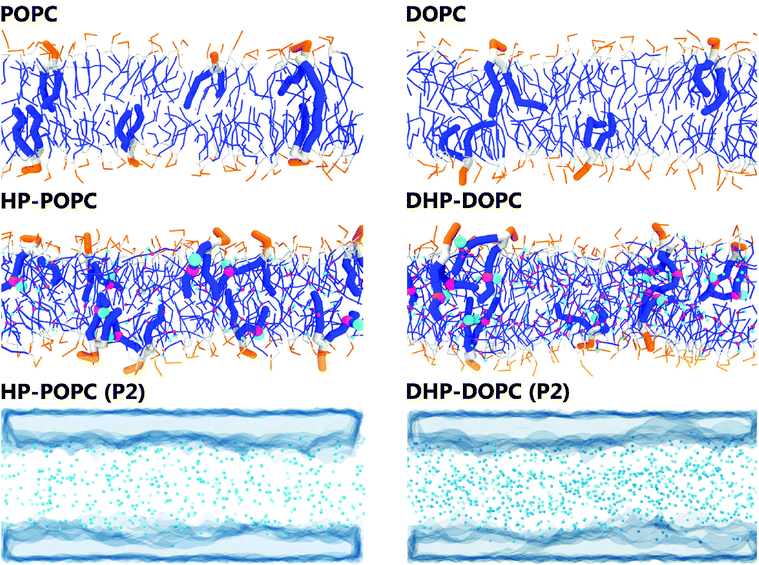 | ||
| Fig. 2 Snapshots of the 512 lipid samples: top and middle rows. Distribution of the polar oxidised beads and water regions in HP-POPC bilayers (bottom left) and DHP-DOPC (bottom right). | ||
3 Results and discussion
3.1 Structural changes upon peroxidation
Pure HP-POPC and DHP-DOPC bilayers appear to be numerically stable and lend themselves to the determination of fairly precise structural properties. The main structural data are summarized in Table 1. The area per lipid was used to set up CG models. Assuming that these values are correct, resulting CG models provide a quantitative estimate of membrane thickness and membrane specific volume changes due to peroxidation. If one assumes that membranes are quasi-incompressible media, the volume change is entirely due to the added hydroperoxide groups, and it becomes possible to split the increase in area per lipid into two contributions: homogeneous increase and structural reorganisation. The homogeneous increase of area is directly proportional to the relative volume change (ΔA/A)hom = 2/3(ΔV/Vb), as if the bilayer was an homogeneous fluid with volume Vb. The second contribution is due to the membrane reorganisation due to changes in chemical affinity and polarity following the addition of the hydroperoxide groups. The corresponding “structural” relative increase of area is (ΔA/A)str = ΔA/A − (ΔA/A)hom.| Lipid | Box area (nm2) | Box thickness (nm) | Box volume (nm3) |
|---|---|---|---|
| POPC | 163.9 ± 0.2 | 6.551 ± 0.004 | 1072.04 ± 0.04 |
| HP-POPC | 190.8 ± 0.3 | 5.821 ± 0.006 | 1110.63 ± 0.04 |
| DOPC | 171.48 ± 0.13 | 6.576 ± 0.005 | 1127.67 ± 0.04 |
| DHP-DOPC | 204.92 ± 0.4 | 5.87 ± 0.02 | 1203.55 ± 0.05 |
Lipids were simulated in a box with lateral x,y directions and the transverse z direction, at a temperature of 300 K. An anisotropic Parinello-Rahman barostat was applied to simulate a tensionless bilayer (all three directions being subject to a 1 bar compressive stress), and the average lateral size Lx = Ly of the system provides the desired bilayer area A = 〈LxLy〉. Changes in the membrane volume and the membrane thickness upon peroxidation are obtained by monitoring the changes in the average simulation box volume 〈Lx2Lz〉 and extension 〈Lz〉.
The area of the simulation box and the area of the bilayer can be considered equal, as the excess area caused by undulations is small, especially for systems comprising only 512 lipids. There is however a significant difference between the volume and the thickness of the box compared with the volume and the thickness of the bilayer only. Let us denote by Vb and Lb the volume and the thickness of the bilayer, and by V and Lz the volume and the thickness of the simulation box mentioned in Table 1. The simplest way to relate V and Vb or Lz and Lb consists of removing the volume of the homogeneous solvent taken at the same pressure and temperature. The volume of the 3072 CG fluid water system is Vs = 366.04 ± 0.07 nm3. The bilayer volume and thickness follow from the expressions
 | (1) |
The resulting bilayer volumes and thicknesses are summarised in Table 2 below. Upon peroxidation, the volume change of the bilayer coincides with the volume change of the simulation box. Relative volume, thickness and area changes are summarised in Table 3. We notice in particular that the structural area variations (ΔA/A)str are almost identical for both oxidised lipids. The higher density of hydroperoxide groups in DHP-DOPC compared with HP-POPC does not lead to an increase in area per lipid beyond a trivial change in bilayer volume Vb.
| POPC | HP-POPC | DOPC | DHP-DOPC | |
|---|---|---|---|---|
| Thickness (nm) | 4.318 ± 0.006 | 3.90 ± 0.01 | 4.442 ± 0.007 | 4.08 ± 0.03 |
| Area (nm2) | 163.9 ± 0.02 | 190.8 ± 0.3 | 171.48 ± 0.13 | 204.9 ± 0.4 |
| Volume (nm3) | 706.02 ± 0.08 | 744.61 ± 0.08 | 761.65 ± 0.08 | 837.53 ± 0.09 |
| Area/lipid (nm2) | 0.6402 ± 0.0008 | 0.7453 ± 0.0012 | 0.6698 ± 0.0006 | 0.8005 ± 0.0016 |
| Volume/lipid (nm3) | 1.3789 ± 0.0002 | 1.4542 ± 0.0002 | 1.4875 ± 0.0002 | 1.6357 ± 0.0002 |
| Lipid | Volume (%) | Area (%) | Thickness (%) | (ΔA/A)str (%) | Weber et al. |
|---|---|---|---|---|---|
| POPC | 5.46 | 16.4 | −9.6 | 12.8 | 15.6% |
| DOPC | 9.96 | 19.5 | −8.1 | 12.9 | 19.1% |
3.2 Hydroperoxide group distribution
The CG models give also a prediction for lateral density profiles, and in particular for the hydroperoxide group distribution. The partitioning of C4OOH between the water interface and the inner hydrophobic region maintains a subtle statistical balance. On the one hand the group must show affinity for the interfacial water, on the other hand, the h-bonding donor and acceptor character promotes self-interaction.The density distribution of an equilibrated coarse grained DHP-DOPC bilayer and HP-POPC bilayer is shown in Fig. 3. Both density distributions were obtained from a simulation of a bilayer patch containing 512 DHP-DOPC/HP-POPC lipids at full hydration (6 CG water beads equivalent to 24 water molecules per lipid) at room temperature (T = 300 K) with the lateral and normal pressures independently coupled to a pressure of 1 bar. The local center of the bilayer was calculated and used in the present work to determine the density as follows: the xy plane of the simulation box was divided into 8 × 8 regions, and the local positions of the bilayer center were calculated as ![[z with combining macron]](https://www.rsc.org/images/entities/i_char_007a_0304.gif) = 〈z〉, where the averaging was performed over all lipid monomers in the given region. This position was further used in binning the density profile to shift the bilayer center.
= 〈z〉, where the averaging was performed over all lipid monomers in the given region. This position was further used in binning the density profile to shift the bilayer center.
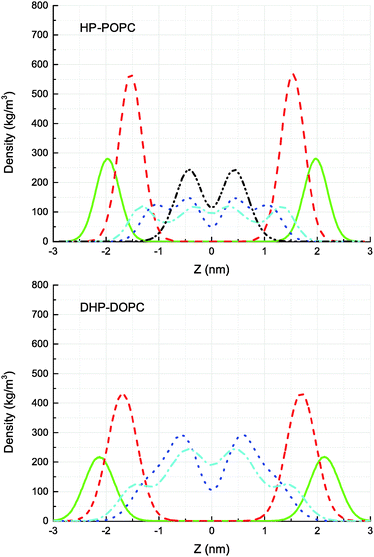
The hydroperoxide group is represented by two connected beads, one is hydrophobic (C3) referred to as hydrophobic oxidised and the other is hydrophilic (P2) referred to as polar oxidised, kept at a relative distance of 0.33 nm. The distribution of the polar oxidised beads, representing the OOH side group, is naturally wider than their hydrophobic counterpart which belongs to the lipid tail backbone. A bimodal distribution is seen in both cases. Roughly half of the polar oxidised beads overlap with the glycerol group in the case of HP-POPC, with the other half remaining “buried” at the same place as the corresponding beads of the opposite saturated lipid tails (Fig. 3 above). By comparison, only a quarter of the polar oxidised beads in DHP-DOPC occupy a region close to the glycerol part, the other three quarters staying deep into the hydrophobic region (Fig. 3 below). As DHP-DOPC has twice as many oxidised groups as HP-POPC, it seems that all the extra oxidised beads go into the hydrophobic core of the bilayer, and that the interfacial glycerol region cannot take more oxidised groups than it has in the HP-POPC case. This is consistent with the data in Table 3 suggesting that the structural increase in area per lipid is similar for both species.
Fig. 4 depicts the orientational distribution of the packing angles: the angle between the oxidised tail and the z-axis α and the angle between two tails of the lipid β. Both DHP-DOPC and HP-POPC have a similar distribution of α, though, judging from the wider distribution, HP-POPC has a larger averaged angle than DHP-DOPC. Peroxidised lipids are therefore significantly tilted with respect to the bilayer normal.
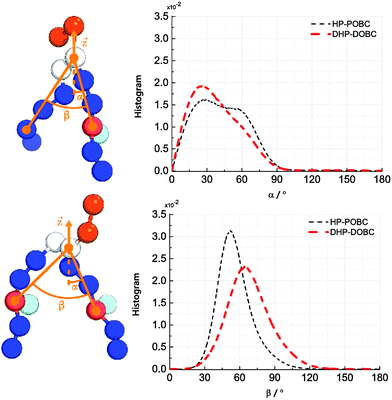 | ||
| Fig. 4 (left) Definition of the tilting and opening angles α and β. (right) Distribution of orientations of α and β for HP-POPC and DHP-DOPC. | ||
The angle β is defined as the angle between the oxidised bead, the glycerol bead and the mirror alkyl bead in the opposite tail. We find a wide distribution of β for DHP-DOPC with a peak value of around 68°. In turn, the angle distribution of β for HP-POPC is narrower with its peak value being around 51°. The packing angle β is closely related to the effective shape of a lipid molecule and thus it determines the ability of lipids to form a stable bilayer. Wide angles correspond to larger deviations from the cylindrical shape, possibly resulting in less stable bilayers.
3.3 Elasticity of hydroperoxidised bilayers
The membrane compressibility (or stretching modulus) KA gives the relative area (A) variation consecutive to applied tension (σ), according to the definition:25 | (2) |
| K A (mN m−1) | ||||
|---|---|---|---|---|
| 512 CG model | 8192 CG model | Undulation free | Experimental | |
| POPC | 379 ± 21 | 245 ± 42 | 393 ± 25 | 230 ± 10 |
| HP-POPC | 211 ± 11 | 104 ± 25 | 227 ± 16 | ∼50 |
| DOPC | 357 ± 19 | 230 ± 27 | 371 ± 22 | 265 ± 18 |
| DHP-DOPC | 103 ± 12 | 73 ± 7 | 106 ± 14 | ∼50 |
The elastic coefficients KA associated with our coarse-grained numerical models come from an area fluctuation analysis, according to the equilibrium statistical relation
 | (3) |
Numerical estimates of KA notoriously depend on the sample size.20 According to den Otter, larger samples appear softer due to long wavelength undulation modes, whose contributions can be accounted for analytically in the relevant limit.21 Using this analytical relation (cf. Section 4) a better, undulation-free estimate of the membrane compressibility can be inferred, based on the apparent KA corresponding to two different sample sizes.
We report in Table 4 our values obtained for 512 (small) and 8192 (large) lipid samples, along with the undulation free extrapolation. For DOPC and POPC bilayers, the MARTINI CG model overestimates the accepted experimental values, while large samples (e.g. 8192 lipids in our case) show a (coincidental) better agreement with them. We assume that the same trend holds for the hydroperoxidised bilayers. Our investigations suggest that hydroperoxidation leads to a significant decrease of KA in both POPC and DOPC cases, whether the simulated system is small or large. This decrease of KA upon peroxidation appears therefore like a robust and significant trend.
The membrane bending modulus coefficient κb controls the out-of-plane bending deformation of a membrane in the Canham–Helfrich elastic model.29 It can be determined experimentally by a number of techniques, including micropipette vesicle aspiration, vesicle flicker motion and nanotube pulling, but unfortunately we are not aware of any published values of κb to date. We therefore take our values as predictions.
The numerical determination of the bending modulus requires to deal with simulated systems of sufficient size corresponding to a small ratio Lb/Lx between the membrane thickness and the lateral extension. Only under these conditions does the continuous Helfrich elastic model bring a reasonable description of the out-of-plane membrane fluctuations. Our determination of κb is based on the equilibrium fluctuation analysis of samples comprising 8192 lipids. Larger systems would approach better the Helfrich continuous limit, but equilibration times tend to increase sharply due to a combination of weak restoring forces and hydrodynamic effects, in spite of the parallel computation capabilities of the simulation tools.
In the continuum model, the bending modulus appears in the quadratic out-of-plane fluctuation spectrum 〈u(q)u(−q)〉, where q is the wavevector parallel to the membrane plane, and u(x,y) the out-of-plane displacement in the Monge representation (elevation of the continuous surface):
 | (4) |
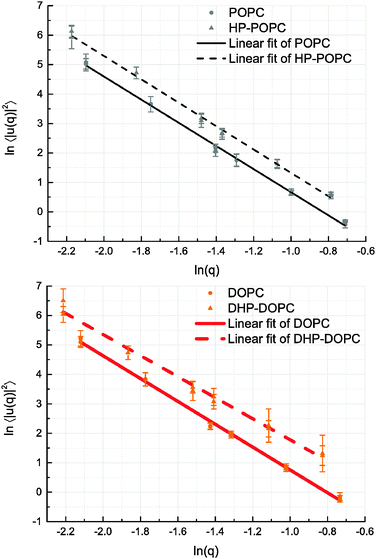
We derive our numerical estimate of the bending moduli by fitting 〈U(q)U(−q)〉 to a q−4 behaviour, where U(q) is a discrete bead estimate of the elevation field u(q)31 (see Fig. 6 and Section 4 for details). Our predictions for κb are summarised in Table 5. As for the area compressibility (or stretching) coefficient, hydroperoxidation causes a sharp decrease in the bending modulus value. As a result, the elastic bending forces are weaker, and the bilayer undulation dynamics is slower.
| κ b (kBT) | κ b (10−20 J) | ||
|---|---|---|---|
| CG model | CG model | Experimental | |
| POPC | 30.0 ± 1.5 | 12.4 ± 0.7 | 9.0 ± 0.6 |
| HP-POPC | 15.1 ± 0.9 | 6.3 ± 0.4 | — |
| DOPC | 28.3 ± 1.5 | 11.7 ± 0.7 | 8.5 ± 1.0 |
| DHP-DOPC | 12.8 ± 1.2 | 5.3 ± 0.5 | — |
The POPC, HP-POPC and DOPC undulation spectra all follow the Helfrich q−4 behaviour, while DHP-DOPC undulations do not comply with it so well, showing a weaker appearent exponent. This might be due to DHP-DOPC molecules not fitting perfectly into the bilayer structure.
3.4 Relative changes in diffusion coefficients
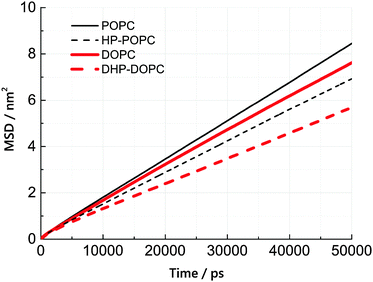
We have estimated the diffusion coefficient of each lipid, at 300 K, using the MARTINI coarse-grained dynamics. It is known that coarse-graining predicts faster diffusion than experimentally observed. The extent of the acceleration factor, depending on temperature, may lie between 4 and 10. We observe that the hydroperoxidised lipids diffuse slower than the non-oxidised molecules by roughly 25%. This suggests an increased cohesion between peroxidised molecules, but only by a modest amount.The lateral diffusion coefficient was calculated from the mean-square displacement (MSD) of lipid centres of masses with time. The resulting MSD curves are linear, to a good approximation, over a time interval between 20 and 50 ns (simulation time). Lateral diffusion coefficients were obtained from linear fits of these MSD curves between 20 and 50 ns.
According to Table 6 and Fig. 5, the lateral diffusion coefficient decreases due to lipid oxidation, and we observe that the diffusion coefficient ratio between the oxidised and the non-oxidised species is similar in both cases: 0.77 for HP-POPC/POPC and 0.76 for DHP-DOPC/DOPC. The decrease in diffusion coefficient could arise from a larger friction at the water–bilayer interface, or from stronger lipid–lipid interaction, due to attractive patches in the tails at the position of the peroxide groups. The former interpretation is more consistent with the common 25% drop in value.
| D (μm2 s−1) | ||
|---|---|---|
| CG model | Experimental | |
| POPC | 40.2 ± 2.6 | 4.2 ± 0.4 |
| HP-POPC | 32.2 ± 2.2 | — |
| DOPC | 34.5 ± 1.5 | 6.3 ± 0.2 |
| DHP-DOPC | 24.4 ± 2.2 | — |
Two experimental values, based on fluorescent probe diffusion, are provided to show the expected order of magnitude of the ratio between CG simulated and experimental time scales.27 This choice is somewhat arbitrary, as a large number of experimental diffusion coefficient values are available, which differ greatly depending on the technique and system preparation. Coarse-grained models do not perform very well as far as reproducing dynamics and transport properties.32 We see a reduction of lipid mobility upon peroxidation that seems to be due to increased friction between peroxidized groups and interfacial water. It might be that important dynamical changes, which are not be accounted for in our approach, alter the overall picture.
4 Simulation and analysis details
4.1 Parameterisation of the CG hydroperoxidised lipids
A first attempt was made by substituting one hydrophobic bead with an hydrophilic bead. Based on log![[thin space (1/6-em)]](https://www.rsc.org/images/entities/char_2009.gif) Pow, we find that a moderately hydrophilic bead does not account for the observed area change. Conversely, a significant area increase can only be obtained for strongly hydrophilic beads which violate the log
Pow, we find that a moderately hydrophilic bead does not account for the observed area change. Conversely, a significant area increase can only be obtained for strongly hydrophilic beads which violate the log![[thin space (1/6-em)]](https://www.rsc.org/images/entities/char_2009.gif) Pow requirement. The partition coefficient and the increase in area per lipid can be reconciled by modelling the hydroperoxide group as two partially overlapping beads. A systematic screening was performed with pairs of beads with different polarities (C1 till C3, and P1 till P4) and separations (0.3 till 0.4 nm) and compared to the experimental area per lipids of both HP-POPC and DHP-DOPC. Two dimers (C2–P2) and (C3–P2) emerged as the best contenders based on both partitioning and area per lipid criteria. Both could be used with little changes in the results and we picked-up C3–P2 as a reference dimer. To give an idea on how much bead separation affects the area per lipid, we note that a distance of 0.32 nm would give area changes of +15.8% (HP-POPC) and +17.7% (DHP-DOPC), as compared with values in Table 3, obtained for 0.33 nm.
Pow requirement. The partition coefficient and the increase in area per lipid can be reconciled by modelling the hydroperoxide group as two partially overlapping beads. A systematic screening was performed with pairs of beads with different polarities (C1 till C3, and P1 till P4) and separations (0.3 till 0.4 nm) and compared to the experimental area per lipids of both HP-POPC and DHP-DOPC. Two dimers (C2–P2) and (C3–P2) emerged as the best contenders based on both partitioning and area per lipid criteria. Both could be used with little changes in the results and we picked-up C3–P2 as a reference dimer. To give an idea on how much bead separation affects the area per lipid, we note that a distance of 0.32 nm would give area changes of +15.8% (HP-POPC) and +17.7% (DHP-DOPC), as compared with values in Table 3, obtained for 0.33 nm.
Most MARTINI CG beads have a Van der Waals radius σ = 0.47 nm, so that a dimer made up of two beads at distance r = 0.33 nm gives an excluded volume 50% larger than a single bead. More precisely, if the beads were hard spheres, the combination of two hard spheres of radius 0.47 separated by 0.33 gives a total excluded volume equal to 1.505 times the excluded volume of a single sphere. A direct consequence is that the volume per lipid increases by, respectively, 5.5% and 10% for POPC and DOPC. No bending potential was added between the C3–P2 bond and the remaining of the lipid chain. Steric interactions ensure that the polar moiety P2 remains at a distance from the chain, and additional structural information is lacking to improve over the current parameterisation. One must remember also that our CG model stands for a chemical mixture of at least two chemical compounds, for which the cis or trans nature of the unsaturated double bond is not established even though a majority of trans bonds is expected.
Partitioning of the corresponding C3–P2 dimers was carried out by studying a slab of 1920 octanol molecules (MARTINI “OCO” dimers) surrounded by 2000 “water molecules” (one CG water representing 4 real water molecules), in which 40 dimers were inserted. The concentration ratio was found to be Pow = [C3P2]oct/[C3P2]w = 26, or equivalently log![[thin space (1/6-em)]](https://www.rsc.org/images/entities/char_2009.gif) Pow = 1.4. This can, for instance, be compared with the estimated log
Pow = 1.4. This can, for instance, be compared with the estimated log![[thin space (1/6-em)]](https://www.rsc.org/images/entities/char_2009.gif) Pow = 0.9 of tert-butyl hydroperoxide ((CH3)3COOH, CAS-75-91-2), obtained using a log
Pow = 0.9 of tert-butyl hydroperoxide ((CH3)3COOH, CAS-75-91-2), obtained using a log![[thin space (1/6-em)]](https://www.rsc.org/images/entities/char_2009.gif) Pow predicting software (VCCLab33). This indicates that our residue C3–P2 has a realistic hydrophilic–hydrophobic balance.
Pow predicting software (VCCLab33). This indicates that our residue C3–P2 has a realistic hydrophilic–hydrophobic balance.
4.2 Stability of peroxidised bilayers
Bilayers composed of single components HP-POPC and DHP-DOPC are stable, to the extent that systems composed of pure HP-POPC and DHP-POPC exhibit stationary properties and show no significant evolution over the simulated times. In practice, initial configurations are obtained by starting from thermalized POPC and DOPC bilayers, inserting the extra beads and reequilibrating the systems again.4.3 Simulation details
This CG model of peroxidised lipids is built on version 2.0 of MARTINI lipid molecule topologies and version 2.1 of the bead interaction parameters. Trajectories were produced using Gromacs v-4.6.Simulations were carried out at constant temperature (300 K) using the Gromacs v-rescale weak coupling scheme, which is an alternative to the Nose–Hoover thermostat (time constant 1 ps).34 An anisotropic Parrinello–Rahman barostat was used to model a tensionless bilayer (time constant 12 ps, compressibility 3 × 10⁻⁴ bar−1). Simulation box size fluctuations are assumed to be consistent with a constant temperature–pressure ensemble, and were used as such for the determination of the membrane area compressibility coefficient.
Short range electrostatics is assumed, with truncation at a radius of 1.2 nm, while the Verlet neighbour list radius was set to 1.4 nm. Time steps of 30 fs and 40 fs were used throughout, in the absence of rigid constraints, without noticeable differences in the output. Simulation times are summarized in Table 7.
| Lipids | MD steps, ×106 | CG time (ns) |
|---|---|---|
| 512 POPC | 10 | 400 |
| 512 DOPC | 10 | 400 |
| 512 HP-POPC | 20 | 800 |
| 512 DHP-DOPC | 20 | 800 |
| 8192 POPC | 20 | 600 |
| 8192 DOPC | 20 | 600 |
| 8192 HP-POPC | 40 | 1200 |
| 8192 DHP-DOPC | 30 | 900 |
4.4 Size dependence of the elastic compressibility coefficient
Eqn (14) in ref. 21 relates the apparent compressibility KA∥ to the undulation free compressibility KA, given the system projected area A∥ and the membrane bending modulus κ. It reads | (5) |
 , with λ being the characteristic length of the size of the membrane thickness. If KA∥,1 and KA∥,2 are known for two different projected areas A∥,1 and A∥,2, one can extract an effective bending modulus κ and derive KA from eqn (5)
 | (6) |
4.5 Fitting and estimation of errors
Averages of the area, simulation box volume and thickness come from the thermodynamic data recorded during the simulations, and Gaussian confidence intervals on the sampled means were obtained by using a bunching/boxing algorithm for time-correlated time sequences.35 The statistical precision of these quantities is very satisfactory.The bunching algorithm was also used to estimate the accuracy of the sample variance of the statistical Lx time sequence. This leads to larger uncertainties for the compressibility coefficients KA. In the case of the undulation free KA, uncertainties in KA∥ dominate the final error.
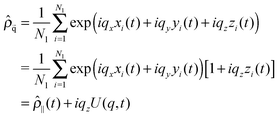
Modes U(q,t) reflect the Fourier transform of the centre of masses density field. Let us denote (xi,yi,zi) as the space coordinates of the centre of mass of each lipid molecule in one of the bilayer leaflet, and Nl as the number of lipids in this leaflet. The density field in reciprocal space is given by
 | (7) |
 . The undulation mode spectra ln(〈U(qx,qy)U(−qx,−qy)〉) were fitted to straight lines C − 4
![[thin space (1/6-em)]](https://www.rsc.org/images/entities/char_2009.gif) ln(q);
ln(q);  , with uncertainties resulting from a standard χ2 least-squares procedure.36
A similar estimate of the values and confidence intervals for the diffusion coefficients was used, based on the average and variance of the quadratic displacement time signal S(t,τ) of the lipid centers of masses, with respect to t, for fixed τ.
 | (8) |
5 Conclusions
We presented a coarse-grained model for two hydroperoxidised phospholipids based on the MARTINI force field for POPC and DOPC. The parameters of our coarse-grained molecules were set by combining thermodynamic data (the TBHP partitioning coefficient), molecular packing arguments (the addition of OOH group) and area per lipid changes.The resulting molecules, HP-POPC and DHP-DOPC, form stable bilayers in accessible simulation times. Our results suggest that the excess area per lipid caused by peroxidation is common to both species, about 13% in relative value. The hydroperoxidised bilayers are thinner and softer than their non-oxidised counterparts. A significant drop in the compressibility (stretching) coefficient KA is observed, qualitatively similar to experimental values. A similar drop of the bending coefficient κb is predicted. The diffusion coefficient of the coarse-grained hydroperoxidised lipids shows a 25% decrease as compared with the non-oxidised ones.
Using our model, we derive the lateral distribution of peroxide groups in the bilayers, and gain access to various structural data, such as the variation of area per lipid, density profile, compressibility, bending moduli, and diffusion coefficient of lipids. We hope that new experimental results will appear in the close future that can be compared to the picture presented above.
A question of interest concerns mixtures of regular and peroxidised lipid species, and in particular the possible non-ideal features of such systems. The presence of heterogeneities, if established, would be an element to be considered in the understanding of the physiological consequences of lipid peroxidation. We are currently working in this direction, with the help of these newly introduced lipid models.
Acknowledgements
The authors acknowledge funding from Marie Curie Actions under EU FP7 Initial Training Network SNAL 608184. F.T. and Y.G. thank the Strasbourg High Performance Cluster Equip@Meso for providing computing resources. Y.G would like to express his special thanks to Dr Olivier Benzerara in Institut Charles Sadron, Strasbourg, France for all the discussion and help. F.T. acknowledges discussions with V. Knecht, M. Batista, A.P. Schroder and C.M. Marques.References
- R. Kohen and A. Nyska, Toxicol. Pathol., 2002, 30, 620–650 CrossRef CAS PubMed.
- B. Alberts, A. Johnson, J. Lewis, M. Raff, K. Roberts and P. Walter, Molecular Biology of the Cell, Garland Science, 4th edn, 2002 Search PubMed.
- M. Repetto, J. Semprine and A. Boveris, Lipid Peroxidation, InTech, 2012 Search PubMed.
- B. Frei, FASEB J., 1999, 13, 963–964 CAS.
- D. J. Betteridge, Metabolism, 2000, 49, 3–8 CrossRef CAS PubMed.
- S. I. Liochev, Free Radical Biol. Med., 2013, 60, 1–4 CrossRef CAS PubMed.
- K. A. Riske, T. P. Sudbrack, N. L. Archilha, A. F. Uchoa, A. P. Schroder, C. M. Marques, M. S. Baptista and R. Itri, Biophys. J., 2009, 97, 1362–1370 CrossRef CAS PubMed.
- O. Mertins, I. O. Bacellar, F. Thalmann, C. M. Marques, M. S. Baptista and R. Itri, Biophys. J., 2014, 106, 162–171 CrossRef CAS PubMed.
- G. Weber, T. Charitat, M. S. Baptista, A. F. Uchoa, C. Pavani, H. C. Junqueira, Y. Guo, V. A. Baulin, R. Itri, C. M. Marques and A. P. Schroder, Soft Matter, 2014, 10, 4241–4247 RSC.
- S. Sankhagowit, S.-H. Wu, R. Biswas, C. T. Riche, M. L. Povinelli and N. Malmstadt, Biochim. Biophys. Acta, 2014, 1838, 2615–2624 CrossRef CAS.
- P. H. B. Aoki, A. P. Schroder, C. J. L. Constantino and C. M. Marques, Soft Matter, 2015, 11, 5995–5998 RSC.
- H. Khandelia and O. G. Mouritsen, Biophys. J., 2009, 96, 2734–2743 CrossRef CAS PubMed.
- V. Jarerattanachat, M. Karttunen and J. Wong-ekkabut, J. Phys. Chem. B, 2013, 117, 8490–8501 CrossRef CAS PubMed.
- J. Wong-Ekkabut, Z. Xu, W. Triampo, I. M. Tang, D. P. Tieleman and L. Monticelli, Biophys. J., 2007, 93, 4225–4236 CrossRef CAS PubMed.
- J. Garrec, A. Monari, X. Assfeld, L. M. Mir and M. Tarek, J. Phys. Chem. Lett., 2014, 5, 1653–1658 CrossRef CAS PubMed.
- H. Khandelia, B. Loubet, A. Olżyńska, P. Jurkiewicz and M. Hof, Soft Matter, 2013, 10, 639–647 RSC.
- S. Pogodin and V. A. Baulin, Soft Matter, 2010, 6, 2216–2226 RSC.
- M. Muller, K. Katsov and M. Schick, J. Polym. Sci., Part B: Polym. Phys., 2003, 41, 1441–1450 CrossRef.
- S. J. Marrink, H. J. Risselada, S. Yefimov, D. P. Tieleman and A. H. de Vries, J. Phys. Chem. B, 2007, 111, 7812–7824 CrossRef CAS PubMed.
- S. J. Marrink, A. H. de Vries and A. E. Mark, J. Phys. Chem. B, 2004, 108, 750–760 CrossRef CAS.
- W. K. den Otter, J. Chem. Phys., 2005, 123, 214906 CrossRef CAS PubMed.
- H. Sies, Angew. Chem., Int. Ed., 1986, 25, 1058–1071 CrossRef.
- S. P. Stratton and D. C. Liebler, Biochemistry, 1997, 36, 12911–12920 CrossRef CAS PubMed.
- J. Sanchez and T. N. Myers, Kirk-Othmer Encyclopedia of Chemical Technology, John Wiley & Sons, Inc., 2000 Search PubMed.
- G. Cevc and D. Marsh, Phospholipid Bilayers: Physical Principles and Models, Wiley-Interscience, New York, 1st edn, 1987 Search PubMed.
- W. Rawicz, K. C. Olbrich, T. McIntosh, D. Needham and E. Evans, Biophys. J., 2000, 79, 328–339 CrossRef CAS PubMed.
- D. Marsh, Handbook of Lipid Bilayers, CRC Press, Boca Raton, 2nd edn, 2013 Search PubMed.
- M. Parrinello and A. Rahman, J. Appl. Phys., 1981, 52, 7182–7190 CrossRef CAS.
- W. Helfrich, Z. Naturforsch., C: Biochem., Biophys., Biol., Virol., 1973, 28, 693–703 CAS.
- G. Brannigan and F. L. H. Brown, Biophys. J., 2006, 90, 1501–1520 CrossRef CAS PubMed.
- E. G. Brandt, A. R. Braun, J. N. Sachs, J. F. Nagle and O. Edholm, Biophys. J., 2011, 100, 2104–2111 CrossRef CAS PubMed.
- W. K. den Otter and S. A. Shkulipa, Biophys. J., 2007, 93, 423–433 CrossRef CAS PubMed.
- I. V. Tetko, J. Gasteiger, R. Todeschini, A. Mauri, D. Livingstone, P. Ertl, V. A. Palyulin, E. V. Radchenko, N. S. Zefirov, A. S. Makarenko, V. Y. Tanchuk and V. V. Prokopenko, J. Comput.-Aided Mol. Des., 2005, 19, 453–463 CrossRef CAS PubMed.
- G. Bussi, D. Donadio and M. Parrinello, J. Chem. Phys., 2007, 126, 014101 CrossRef PubMed.
- M. P. Allen and D. J. Tildesley, Computer simulation of liquids, Clarendon Press, 1987 Search PubMed.
- W. H. Press, S. A. Teukolsky, W. T. Vetterling and B. P. Flannery, Numerical Recipes in C (2Nd Ed.): The Art of Scientific Computing, Cambridge University Press, New York, NY, USA, 1992 Search PubMed.
| This journal is © The Royal Society of Chemistry 2016 |

