Rheology of cellulose nanofibrils in the presence of surfactants†
Nawal
Quennouz
a,
Sara M.
Hashmi
a,
Hong Sung
Choi
b,
Jin Woong
Kim
cd and
Chinedum O.
Osuji
*a
aDepartment of Chemical and Environmental Engineering, Yale University, New Haven CT 06511, USA. E-mail: chinedum.osuji@yale.edu
bShinsegae International Co. Ltd, Seoul, 135-954, Republic of Korea
cDepartment of Applied Chemistry, Hanyang University, Ansan, 426-791, Republic of Korea
dDepartment of Biono Technology, Hanyang University, Ansan, 426-791, Republic of Korea
First published on 9th October 2015
Abstract
Cellulose nanofibrils (CNFs) present unique opportunities for rheology modification in complex fluids. Here we systematically consider the effect of ionic and non-ionic surfactants on the rheology of dilute CNF suspensions. Neat suspensions are transparent yield-stress fluids which display strong shear thinning and power-law dependence of modulus on concentration, G′ ∼ c2.1. Surfactant addition below a critical mass concentration cc produces an increase in the gel modulus with retention of optical clarity. Larger than critical concentrations induce significant fibril aggregation leading to the loss of suspension stability and optical clarity, and to aggregate sedimentation. The critical concentration was the lowest for a cationic surfactant (DTAB), cc ≈ 0.08%, while suspension stability was retained for non-ionic surfactants (Pluronic F68, TX100) at concentrations up to 8%. The anionic surfactant SDS led to a loss of stability at cc ≈ 1.6% whereas suspension stability was not compromised by anionic SLES up to 8%. Dynamic light scattering data are consistent with a scenario in which gel formation is driven by micelle–nanofibril bridging mediated by associative interactions of ethoxylated surfactant headgroups with the cellulose fibrils. This may explain the strong difference between the properties of SDS and SLES-modified suspensions. These results have implications for the use of CNFs as a rheology modifier in surfactant-containing systems.
Introduction
Interest in cellulose nanofibrils (CNFs) has increased significantly over the last decade due to their utility in a wide variety of applications. Their utility is derived from their attractive properties which include biodegradability, low mass density, high tensile modulus,1 broad chemical modification possibilities2,3 and sustainability of production. They have been suggested as high strength filler materials for nanocomposites4,5 and low-density rheology modifiers in complex fluids.6CNFs consist of long semi-flexible fibrils (or fibers) as small as 4 nm in diameter, with aspect ratios which can exceed 100. Fibrils are obtained from the disintegration of cellulose, often derived from wood pulp, using chemical and mechanical treatments.7 The fibrils are typically prepared with negatively charged surfaces due to the introduction of carboxylate groups on the cellulose during production of the material. Whereas native cellulose contains a broad distribution of crystalline and amorphous materials,8 CNFs are strongly enriched in crystalline content which gives rise to their impressive mechanical properties along the long axis of the fibrils.
Due to their large aspect ratios as 1-dimensional nanomaterials, cellulose nanofibrils form 3-dimensional percolated networks at very low mass concentrations, leading to large viscosity enhancement in aqueous media, as shown by Iwamoto et al.9 They are therefore of interest for rheology modification in complex fluids. Other materials which show thickening properties include clay nanoparticles,10–13 worm-like micelles14 and microgels.15–17 The mechanisms leading to rheology modification with these materials are documented well. For instance, the gelation of nanoclay suspensions at low ionic strength is attributed to the electrostatic repulsion between the edges of the clay platelets at distances larger than their physical dimensions, eventually leading to the formation of a soft jammed material. For microgels viscosification results from the large swelling ratio of the gel particles which therefore allows access to a soft jammed state at low mass concentrations. Finally, for worm-like micelles viscosity enhancement, and eventually elasticity, originates in the formation of a network due to entanglement of long, thread-like micelles. It is clear that no single approach to rheology modification can fulfill the wide range of performance constraints for complex fluids regarding the combination of properties ranging from well-quantified parameters, such as optical clarity, recoverability, shear thinning, yield stress and stability, to the more subjective sensory attributes that are relevant for consumer products such as cosmetics. In this context it is useful to explore the properties of CNFs as a rheology modifier, and in particular it is important to assess the suspension stability in the presence of surface active agents which are often present in complex fluids. The sustainability aspect of CNFs makes such an exploration additionally compelling. Furthermore, the anticipated resilience of CNF networks at high ionic strength18 and across large pH ranges,19 for sodium carboxylate forms, suggests that CNFs may be an attractive alternative to conventional microgels which rapidly lose their thickening properties under such conditions.
At present there are few detailed reports regarding the rheology of CNF suspensions. Contributions in recent years have highlighted the shear thinning behavior20 and elastic properties of CNF suspensions,21 as well as the effects of salt and pH on sol–gel transitions of CNF dispersions,18 among others.22–25 Here we have conducted a systematic study of rheology of CNF suspension in the presence of different surfactants to elucidate the mechanisms leading to viscosity enhancement and gel formation. The non-ionic surfactants studied increased the storage modulus of the CNF suspensions, forming transparent jammed materials. At low concentrations, ionic surfactants studied, apart from sodium lauryl ether sulfate (SLES), similarly increased the storage modulus of the CNF suspensions, but larger concentrations destabilized the suspensions.
Materials and methods
Preparation of CNF suspensions
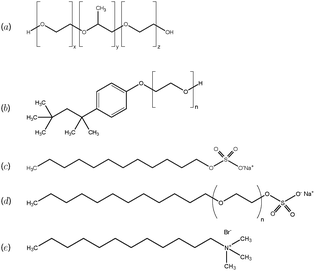
All concentrations reported are in weight percent, unless otherwise noted. The CNFs were obtained in a sodium carboxylate functionalized form at 0.96% in water from USDA Forest Products Laboratory (Madison, WI). They were prepared using TEMPO-mediated oxidation in a manner similar to that previously reported.7 The fibrils have a diameter of ≈5 nm and an aspect ratio of ≈100, with a sodium carboxylate density of ≈0.65 mmol g−1. Dialysis was used to concentrate the suspensions to 2%. 100 g of stock 0.96% CNFs was placed in a 34 mm diameter dialysis bag with a molecular weight cut-off of 3500 (Spectra/Por). The bag was then immersed in a continuously stirred 200 g l−1 solution of 10 kg mol−1 polyethylene oxide for approximately 6 hours.We use 5 different surfactants, namely the non-ionic surfactants Pluronic F68 (PF68) and Triton-X 100 (TX100), the cationic surfactant dodecyl trimethyl ammonium bromide (DTAB), and anionic surfactants sodium dodecyl sulfate (SDS) and sodium lauryl ether sulfate (SLES). Their chemical formulas are presented in Fig. 1. All surfactants were obtained from Sigma Aldrich, with the exception of SLES (Nature's Oil). Molecular weights and critical micelle concentrations (CMC) of all 5 surfactants are documented in the ESI.† Samples were prepared by adding the appropriate amount of surfactant from a stock solution of 20% concentration to CNF suspensions. The samples were magnetically stirred for 2 hours, then centrifuged at 1000 rpm for 1 minute and sonicated for 90 s to remove bubbles. Samples were then stored quiescently for at least 2 hours before testing.
Rheological characterization
Rheological properties were characterized using a MCR301 rheometer (Anton Paar) in strain-controlled mode with a cone-plate geometry (diameter 50 mm, angle 1°). All measurements were conducted at 20 °C. Tool surfaces were appropriately roughened (sandpaper) to ensure no sample slippage. A thin film of mineral oil applied at the sample periphery was used successfully to suppress water evaporation during the experiments. Rheological measurements were performed after pre-shearing samples at![[small gamma, Greek, dot above]](https://www.rsc.org/images/entities/i_char_e0a2.gif) = 10 s−1 and a resting time of 10 minutes. Strain sweep measurements of the elastic and loss moduli G′ and G′′ were conducted at ω = 10 rad s−1 and used to establish a strain amplitude of 5%, within the linear viscoelastic regime, for subsequent frequency sweep measurements. Two successive dynamic oscillatory frequency sweeps with ascending and descending ramps (60 to 0.1 rad s−1 and 0.1 to 60 rad s−1) were conducted to confirm the reproducibility of results. Steady flow measurements were performed after the dynamic tests at a shear rate
= 10 s−1 and a resting time of 10 minutes. Strain sweep measurements of the elastic and loss moduli G′ and G′′ were conducted at ω = 10 rad s−1 and used to establish a strain amplitude of 5%, within the linear viscoelastic regime, for subsequent frequency sweep measurements. Two successive dynamic oscillatory frequency sweeps with ascending and descending ramps (60 to 0.1 rad s−1 and 0.1 to 60 rad s−1) were conducted to confirm the reproducibility of results. Steady flow measurements were performed after the dynamic tests at a shear rate ![[small gamma, Greek, dot above]](https://www.rsc.org/images/entities/i_char_e0a2.gif) ranging from 100 to 0.01 s−1.
ranging from 100 to 0.01 s−1.
Dynamic light scattering
Dynamic light scattering (DLS) was performed at a fixed angle θ = 65°, using a CGS-5000F goniometer (ALV GmbH) with an incident light of wavelength λ = 532 nm (Coherent). The scattering vector q = (4πn0/λ)sin(θ/2) = 0.017 nm−1, where n0 is the index of refraction of the continuous phase of suspension (water) and θ is the scattering angle between the incident and scattered beams. Data were collected in intervals of 60 s, with a total of 30 runs per sample. The autocorrelated intensities were analyzed using the CONTIN algorithm26 to obtain relaxation time distributions.Zeta potential measurements were obtained by electrophoretic light scattering using a Brookhaven NanoBrook Omni, operating at a wavelength of 658 nm. At least ten measurements were obtained for suspensions of 0.01% CNFs and 0.01% CNFs with surfactants Triton X-100, Pluronic F68, SDS, SLES, and DTAB at concentrations 0.5, 1, 2, and 5%. The zeta potential was also obtained for 5% solutions of the ionic surfactants SDS, SLES, and DTAB. Several CNF suspensions were measured multiple times to confirm the sample-to-sample reproducibility of the results (ESI†).
Results and discussion
Neat CNF suspensions
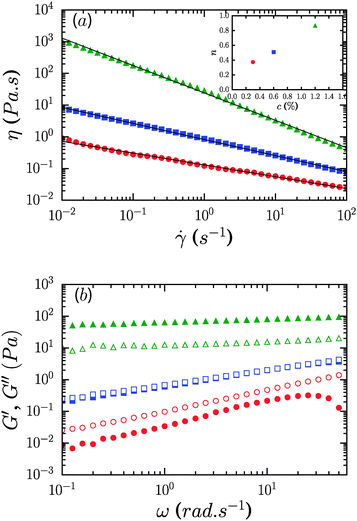
Fig. 2a shows the viscosity as a function of the shear rate of CNF suspensions for three different mass concentrations, 0.3, 0.6 and 1.2%. There is a strong dependence of viscosity on concentration with an increase by 3 orders of magnitude between the 0.3 and 1.2% samples at the lowest shear rate considered,![[small gamma, Greek, dot above]](https://www.rsc.org/images/entities/i_char_e0a2.gif) = 10−2 s−1. The suspensions display persistent shear-thinning across 4 decades of shear rate, from 10−2 to 102 s−1. Over this range of shear rates the viscosity is well-represented by a power-law relationship, η = K
= 10−2 s−1. The suspensions display persistent shear-thinning across 4 decades of shear rate, from 10−2 to 102 s−1. Over this range of shear rates the viscosity is well-represented by a power-law relationship, η = K![[small gamma, Greek, dot above]](https://www.rsc.org/images/entities/i_char_e0a2.gif) −n with |n| ≤ 1, where n is the shear thinning exponent and K is the consistency (corresponding to the viscosity at a shear rate of 1 s−1). The fits are shown with solid lines and the inset shows the concentration dependence of the shear thinning exponent, which increases from n = 0.37 at 0.3% to n = 0.86 at 1.2%. From the data we note the absence of both high and low shear rate viscosity plateaus.
−n with |n| ≤ 1, where n is the shear thinning exponent and K is the consistency (corresponding to the viscosity at a shear rate of 1 s−1). The fits are shown with solid lines and the inset shows the concentration dependence of the shear thinning exponent, which increases from n = 0.37 at 0.3% to n = 0.86 at 1.2%. From the data we note the absence of both high and low shear rate viscosity plateaus.
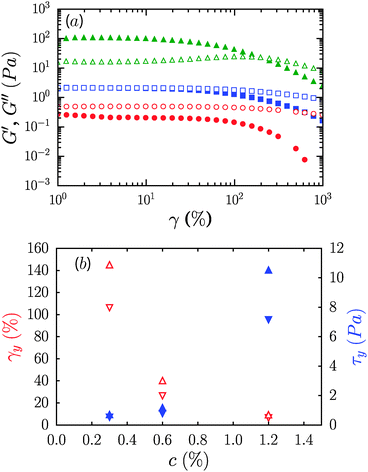
The frequency dependence of the elastic or storage modulus, G′, and the viscous or loss modulus, G′′, is shown in Fig. 2b. All three samples show a weak power law dependence of the dynamic moduli on frequency and loss tangents, tan δ = G′′/G′, that are effectively frequency independent. The frequency dependence weakens on increasing the concentration with G′′ ∼ ω0.1 for the 1.2% sample and G′ ∼ ω0.35 for 0.3%. Correspondingly, samples undergo transition from fluid like (G′′ > G′) at 0.3% to solid like (G′ > G′′) at 1.2%, while for 0.6%, G′ and G′′ are equivalent over the range of frequencies considered, reminiscent of critical gels in systems with attractive interactions.27,28 While the range of shear rates in steady flow experiments did not permit identification of a dynamic yield stress, oscillatory measurements however reveal that the suspensions are in fact yield stress fluids, with well-defined static yield stresses. Strain sweep data along with yield stresses, τy, and yield strains, γy, are shown in Fig. 3. G′ increases from roughly 0.3 Pa to 100 Pa across the range of concentrations considered. τy and γy were determined as the point at which the system exhibited a fractional deviation ε from linearity in the stress value of the measured stress–strain data, for ε = 0.05 and ε = 0.10. Yielding in the most concentrated suspensions occurs with a modest increase of viscous dissipation as evident from the increase in G′′ upon increasing the strain beyond γy.
CNFs are known to form a fibrillar network due to physical entanglement.29 There is recent evidence for the formation of such networks also in methylcellulose solutions where the polymer chains assemble into fibrils as a function of temperature.30 However, here there is no evidence of the strain stiffening that is commonly observed in network gels formed in filament-, or fibril-forming biological materials such as actin,31 fibrin,32 collagen,33 and others.34–37σy increases with concentration from a low value of ≈0.5 Pa to ≈10 Pa, while γy decreases from ≈100% to less than 10% on changing the concentration from 0.3% to 1.2%. The inverse relationship between τy and γy is often observed in fibrillar gels, and represents an expected increase in mechanical fragility of the system on increasing the modulus.33,38 The yield strains are of similar or slightly larger magnitude than those observed in biological gels discussed above.
The concentration dependence of the elastic modulus measured at ω = 10 rad s−1 is shown in Fig. 4, for mass concentrations ranging from 0.2 to 2%. The storage modulus follows a power law, G′ = cα with α = 2.1, if we consider only samples where the modulus is strictly independent of frequency. By including samples where there is a slight frequency dependence, the exponent increases, α = 4.1.
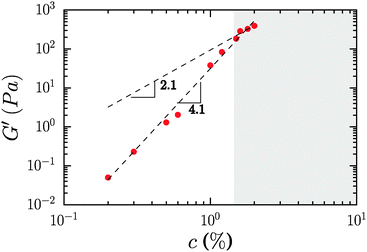 | ||
| Fig. 4 Concentration dependence of the elastic modulus of neat CNF suspensions. The shaded area covers concentrations for which the elastic modulus was strictly frequency independent. | ||
Prior studies in fibrillar gels have yielded different exponents for the power law relationship between the elastic modulus and the concentration of fibrils, nominally the volume fraction, in the system. Early work by Tatsumi, Matsumoto et al. on microcrystalline cellulose, bacterial cellulose and fibrillated cellulose fibers from a variety of sources yielded α = 2.25.39 Studies by Naderi, Pettersson et al. found α = 5.2 for carboxymethylated nanofibrillated cellulose,40 while measurements by Pääkkö, Lindström et al. recorded α = 3.22 Standard theories for entangled polymers provided by de Gennes41 and Doi–Edwards42 suggest that α takes a value of 2.25. Theoretical consideration of networks in which gel elasticity is derived from the bending rigidity of the associated biopolymer-derived filaments yields an exponent of 2.2 for dilute entangled solutions and that of 2.5 for densely crosslinked gels.43 A recent theoretical contribution by Hill provides a new scaling theory which suggests an exponent of 11/3 at low concentrations, and a limiting exponent of 7 at high concentrations.44 Data from Jowkarderis and van de Ven on TEMPO-derived fibrils were analyzed using the theory of Hill, but suggest α = 4.52 based on a simple power law fit.21
There is a significant spread in literature reported data to date. This spread may arise from unavoidable variations in the structure and chemical composition of differently sourced and prepared CNFs, as well as utilization of gel moduli that are not frequency independent, and therefore not plateau moduli in a strict sense. In the present case it is clear that the scaling exponent cannot be determined with great certainty given the limited range of concentrations which are both experimentally accessible and in which the modulus is not a function of frequency. We therefore do not attribute any particular significance to the value of the exponent observed in our measurements. We note the absence of the commonly observed high-frequency regime in filamentous networks where G′ ∼ ω3/4 due to contributions from the bending modes of the filaments in the network. It is possible that our experimental window is not sufficiently broad to capture the high frequency behavior of the CNF. It is also useful to consider that the analogy between CNFs and filamentous networks as observed in other systems may be inexact due to the repulsive rather than associative interaction between the fibrils, which gives rise to different bond dynamics.
CNF suspensions with added surfactant
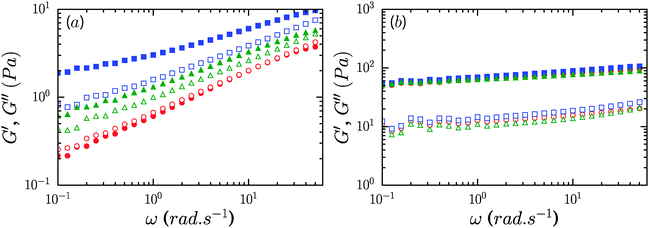
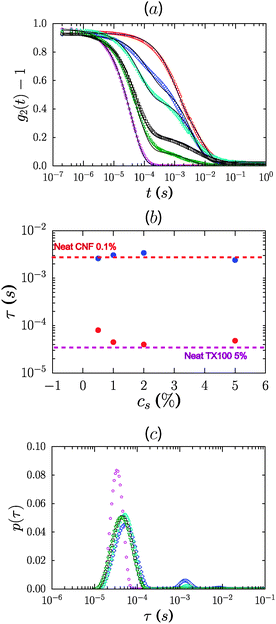
Addition of a non-ionic surfactant, Pluronic F68 or TX100, to 0.6% CNF suspensions led to a modest increase of the gel modulus at the largest concentration considered, 8%. As shown in Fig. 5a, the storage modulus increased roughly by factors of 2 and 4 for TX100 and Pluronic F68. For these samples, the storage modulus exceeds the loss modulus over the range of frequencies measured. However, the presence of these surfactants at concentrations lower than 4% did not lead to an increase of the elastic modulus of the CNF suspensions (ESI,† Fig. S1 and S2). For 1.2% CNF suspensions, the addition of non-ionic surfactants at 8% concentration did not appreciably modify the rheology of the system, as shown by the data in Fig. 5b.We used dynamic light scattering (DLS) to elucidate the microscopic dynamics of the system and gain insight into the mechanism by which the non-ionic surfactants modify the suspension rheology. Suspensions were studied at 0.1% concentration wherein the lower viscosity of the system ensures that diffusive modes can be reasonably captured in the experimental window of the instrument. Fig. 6a shows the electric field autocorrelation function g(t) = g2(t) − 1 of diluted suspensions of CNFs at 0.1% concentration in the presence of 5 different concentrations of TX100, and that of a neat TX100 solution at 5% concentration for comparison. In Fig. 6b we plot values of the relaxation times obtained by fitting the autocorrelation function by the sum of two stretched exponentials, g(t) = A![[thin space (1/6-em)]](https://www.rsc.org/images/entities/char_2009.gif) exp[−(t/τ1)β1] + B
exp[−(t/τ1)β1] + B![[thin space (1/6-em)]](https://www.rsc.org/images/entities/char_2009.gif) exp[−(t/τ2)β2] + C. In Fig. 6c we plot the corresponding distributions p of the relaxation times (τ), where g(t) is described by a distribution of exponential decay of the form
exp[−(t/τ2)β2] + C. In Fig. 6c we plot the corresponding distributions p of the relaxation times (τ), where g(t) is described by a distribution of exponential decay of the form  . The autocorrelation functions of both the neat suspension of CNFs and the neat solution of TX100 show a single decay.
We attribute the relaxation times to the diffusive mode for the TX100 micelles and a mixture of diffusive and internal bending modes of the CNFs, based on the scattering vector dependence of the relaxation time. The timescales are well separated, which is consistent with the significant difference expected in the hydrodynamic radii of the TX100 micelles relative to the CNFs. We estimate a hydrodynamic size Dh ≈ 8.8 nm for the micelles. Considering the concentration of surfactants used for this study, we expect only the presence of spherical micelles in the suspensions. The formation of other morphologies, such as worm-like micelles or lamellar bilayers, requires either very high concentrations of the surfactant or the presence of second-phase components. However, we cannot rule out the possible formation of lamellar morphologies at the CNF surface, particularly given the favorable association of the surfactant headgroups with CNFs.
Samples containing both the CNFs and the surfactant show two relaxations and therefore two peaks in the relaxation time distribution. Notably, the short timescale mode is significantly retarded in the presence of CNFs. The fibril mode also shifts, albeit marginally, to longer times (Fig. 6b). The fast mode is modified in a concentration dependent manner with progressive slowing of the short timescale relaxation as the TX100 concentration is decreased to 0.5%. Taken together, the data are strongly indicative of associative interactions between the micelles and the CNF.
We suggest that the micelles associate weakly and therefore reversibly with the fibrils. Such an association would occur via the ethoxylated hydrophilic headgroups of the surfactants and has been observed previously for ethoxylated surfactants on cellulose.45,46 Ideally the system would manifest well-resolved peaks corresponding to free micelles, free fibrils and micelle-coupled fibrils. However the data are by definition convoluted with the timescale for micelle–fibril association/dissociation, and these features are therefore expected to be smeared out and not readily resolvable, except as shifting and broadening of the original modes. In this scenario the effective diffusivity of the micelles is coupled to that of the fibrils in a concentration dependent manner which reflects the on/off time of the micelle–fibril association, that is, the adsorption of micelles onto fibrils. Correspondingly, the diffusion of the micelles is effectively the slowest at low concentrations of the surfactant. The timescale for the fibrils likewise increases as the concentration of surfactant increases. This is consistent with an increase in the effective size of the fibrils as larger surfactant concentrations lead to increasing micelle adsorption. Alternatively, the slowing of the diffusive timescale for the micelles could be indicative of a pronounced growth in the size of the micelles on decreasing TX100 concentration. This explanation however is at odds with the behavior of surfactants in solution where the aggregation number and thus the micelle size is not a function of concentration beyond the CMC, even in the presence of nanomaterials.
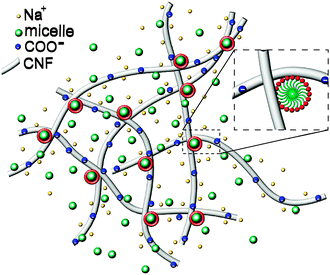
Based on the above observations, gelation appears to arise from micelle bridging of fibrils, as schematically depicted in Fig. 7. The modest increase of elasticity in the presence of non-ionic surfactants suggests that the association is not particularly energetic. It is interesting to consider the DLS data on more concentrated gel-like CNFs (neat, 0.6%). The autocorrelation function displays a significant broadening. Fits of the autocorrelation functions for dilute and gel-like samples to stretched exponentials, g(t) = exp[−(t/τ)β], reflect the pronounced slowing and broadening of the relaxation timescales, with τ = 1.45 and 50, and β = 0.6 and 0.27, respectively, for 0.01 and 0.6% samples (ESI,† Fig. S3). It should be noted that the changes in the fast relaxation mode seen in Fig. 5b are not attributable to viscosity differences in the suspensions. While the viscosity of 5% TX100 is ≈1 mPa s and that of 0.1% CNFs is ≈0.2 Pa s, a difference of 2 orders of magnitude of the relaxation time of the TX100 micelles in CNFs changes only by a factor of ≈2. This is consistent with the idea that the majority of micelles simply diffuse freely within the mesh space defined by fibril intersections where the local viscosity is that of water. Furthermore, the viscosities of the 0.1% CNF suspensions containing TX100 are experimentally indistinguishable as a function of TX100 content. Finally, the same progressive slowing of the free micelle mode can be observed in more dilute systems (0.01% CNFs) but these are confounded by the experimental difficulty associated with the small scattering signal from the CNFs relative to the TX100 micelles, necessitating the use of a log-scale for visualization (ESI,† Fig. S4).
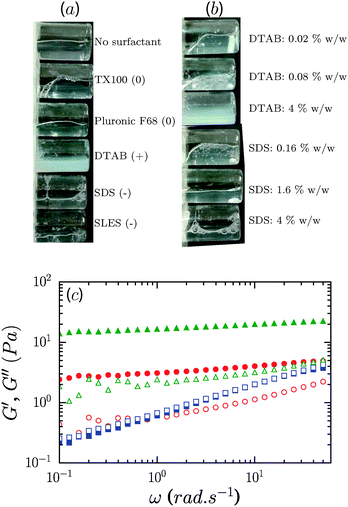
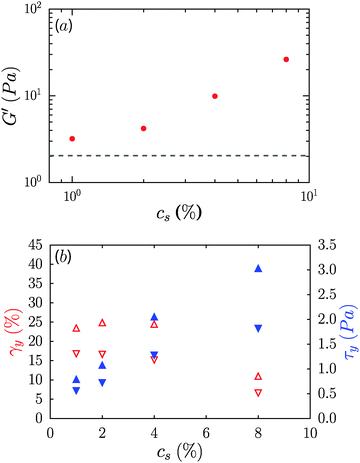
Contrary to the case of non-ionic surfactants, the presence of cationic (DTAB) or anionic (SDS) surfactants at 4% concentration in 0.6% CNF suspensions led to a loss of suspension stability as inferred from the appearance of turbidity, indicative of the formation of fibril aggregates. The sample in the presence of DTAB has a milky appearance, as seen in Fig. 8a. However, low concentrations of surfactants, 0.02 and 0.16%, respectively, for DTAB and SDS, led to the formation of a homogeneous and optically clear gel with 0.6% CNFs, Fig. 8b. For DTAB, at 0.02% concentration in the CNF suspension, the storage modulus is 2.2 Pa and grows to 15.2 Pa at 0.08% DTAB. The critical concentration at which suspension stability is lost is ∼0.08% and ∼1.6% for DTAB and SDS respectively. Surprisingly, however, the addition of SLES, an anionic surfactant widely used in detergent products, did not produce destabilization of the CNF suspensions at comparable concentrations. Even at 8%, SLES formed a transparent homogeneous gel (ESI,† Fig. S5), which exhibited syneresis. As indicated in Fig. 8c, addition of SLES leads to an increase of G′ and G′′ with a near frequency-independent storage modulus and G′ > G′′ over the entire frequency range, corresponding to a well-formed gel with solid-like behavior. The SLES concentration dependence of the gel elastic modulus is shown in Fig. 9a. Only when SLES was added at higher concentrations (16%) did the CNF suspension destabilize. Yield stresses, τy, and yield strains, γy, are shown in Fig. 9b. τy and γy were determined as the point at which the system exhibited a fractional deviation ε from linearity in the stress value of the measured stress–strain data, for ε = 0.05 and ε = 0.10. Increased yield stresses on addition of SLES occur with corresponding decreases in the yield strain, as also observed in the neat suspensions on increasing the CNF concentration.
The differences in the stability of CNF suspensions in the presence of the 5 surfactants investigated here can be rationalized by considering the nature of the interaction between the surfactant headgroups and the cellulose nanofibrils. It is likely, as well as reasonable, to expect that the cationic surfactants interact strongly with the negatively charged fibrils, and therefore induce the strongest micelle-bridged association between the fibrils. While the CNFs are negatively charged, with a zeta potential near −45 mV, the addition of even 0.5% DTAB to a suspension of 0.01% CNFs causes them to become positively charged, with a zeta potential comparable to that of the DTAB micelles, nearly 40 mV (ESI,† Fig. S6).
Despite carrying the same negative charge, anionic surfactants are also expected to interact with the cellulose surface. This has been characterized in a pH-dependent manner for sodium dodecylbenzenesulfonate (NaDDBS) on cellulose where an increase of pH, and therefore an increase of the negative charge on the cellulose surface, reduced but did not eliminate the favorable interactions of NaDDBS with cellulose.47 Similar results have also been noted for SDS on cellulose.48 The partial hydrophobic character of cellulose appears to play a role in explaining the counter-intuitive association of negatively charged species with what is nominally a negatively charged surface. Zeta potential measurements reveal an initial decrease with the addition of an anionic surfactant, followed by an increase toward the zeta potential of the neat surfactant solutions at 5%, namely −60 and −70 mV for the SDS and SLES, respectively, (ESI,† Fig. S6). Relative to SDS, a higher concentration of SLES is required to saturate the zeta potential of the CNFs, consistent with the trend in their critical concentrations (ESI,† Fig. S6).
Our results suggest that the attraction induced by SDS is stronger than that induced by TX100 or Pluronic F68, despite the fact that both SDS and CNFs are negatively charged. We therefore conclude that the ethoxylated headgroups have favorable but quite weak interactions with CNFs. Finally, the striking disparity in behavior between SDS and SLES is in line with the above finding, with the presence of ethylene oxide units in the hydrophilic headgroup leading to a dramatic increase in the SLES concentration required to induce fibril aggregation, relative to SDS. Here we note that the critical destabilization concentrations bear no correlation to the nominal CMCs of the surfactants (ESI,† Table S1).
Conclusions
We have reported the rheological behavior of neat CNF suspensions, and CNF suspensions in the presence of different surfactants. The properties of the system are highlighted by an increase of the elastic modulus on addition of surfactants and the eventual loss of suspension stability in the case of non-ionic surfactants. Light scattering measurements point to the association of micelles with fibrils which suggests that gelation at low CNF concentration, and the enhancement of the gel modulus for higher CNF concentrations, occurs due to micelle-bridging of fibrils. Charged surfactants had a strong destabilizing effect on the gel network, with the exception of SLES. The significant disparity between the critical SLES and SDS concentrations for loss of suspension stability, and the high stability in the presence of ethoxylated non-ionic surfactants strongly suggest that the ethoxylated headgroup plays a significant role in moderating the attraction strength between fibrils in surfactant containing suspensions.Acknowledgements
The authors acknowledge financial support from Shinsegae Corporation and fruitful discussions with Gilad Kaufman during the execution of this work. We thank Dr Alan Rudie and the Forest Products Laboratory for CNF samples.References
- Y. Nishiyama, J. Wood Sci., 2009, 55, 241–249 CrossRef CAS.
- K. Missoum, M. N. Belgacem and J. Bras, Materials, 2013, 6, 1745–1766 CrossRef CAS.
- S. Kalia, S. Boufi, A. Celli and S. Kango, Colloid Polym. Sci., 2014, 292, 5–31 CAS.
- S. J. Eichhorn, A. Dufresne, M. Aranguren, N. E. Marcovich, J. R. Capadona, S. J. Rowan, C. Weder, W. Thielemans, M. Roman, S. Renneckar, W. Gindl, S. Veigel, J. Keckes, H. Yano, K. Abe, M. Nogi, A. N. Nakagaito, A. Mangalam, J. Simonsen, A. S. Benight, A. Bismarck, L. A. Berglund and T. Peijs, J. Mater. Sci., 2010, 45, 1–33 CrossRef CAS.
- I. Siro, D. Plackett, M. Hedenqvist, M. Ankerfors and T. Lindstrom, J. Appl. Polym. Sci., 2011, 119, 2652–2660 CrossRef CAS.
- F. Turbak, A. Snyder and K. Sandberg, J. Appl. Polym. Sci.: Appl. Polym. Symp., 1983, 37, 815–827 Search PubMed.
- T. Saito, S. Kimura, Y. Nishiyama and A. Isogai, Biomacromolecules, 2007, 8, 2485–2491 CrossRef CAS PubMed.
- R. J. Moon, A. Martini, J. Nairn, J. Simonsen and J. Youngblood, Chem. Soc. Rev., 2011, 40, 3941–3994 RSC.
- S. Iwamoto, S.-H. Lee and T. Endo, Polym. J., 2014, 46, 73–76 CrossRef CAS.
- Y. M. Joshi, G. R. K. Reddy, A. L. Kulkarni, N. Kumar and R. P. Chhabra, Proc. R. Soc. A, 2008, 464, 469–489 CrossRef CAS.
- H. A. Baghdadi, H. Sardinha and S. R. Bhatia, J. Polym. Sci., Part B: Polym. Phys., 2005, 43, 233–240 CrossRef CAS.
- A. Negi and C. Osuji, Europhys. Lett., 2010, 90, 28003 CrossRef.
- A. S. Negi and C. O. Osuji, Phys. Rev. E: Stat., Nonlinear, Soft Matter Phys., 2010, 82, 031404 CrossRef PubMed.
- J. Yang, Curr. Opin. Colloid Interface Sci., 2002, 7, 276–281 CrossRef CAS.
- A. Fernandez-Nieves, H. Wyss, J. Mattsson and D. A. Weitz, Microgel suspensions: fundamentals and applications, John Wiley & Sons, 2011 Search PubMed.
- L. A. Lyon and A. Fernandez-Nieves, Annu. Rev. Phys. Chem., 2012, 63, 25–43 CrossRef CAS PubMed.
- K. Chari, R. Hsu, P. Bhargava, B. Figura, W. Yang, J. H. Park, T. Clifford and M. Kadir, Langmuir, 2013, 29, 15521–15528 CrossRef CAS PubMed.
- A. B. Fall, S. B. Lindström, O. Sundman, L. Ödberg and L. Wågberg, Langmuir, 2011, 27, 11332–11338 CrossRef CAS PubMed.
- M. Bhattacharya, M. M. Malinen, P. Lauren, Y.-R. Lou, S. W. Kuisma, L. Kanninen, M. Lille, A. Corlu, C. GuGuen-Guillouzo, O. Ikkala, A. Laukkanen, A. Urtti and M. Yliperttula, J. Controlled Release, 2012, 164, 291–298 CrossRef CAS PubMed.
- E. Lasseuguette, D. Roux and Y. Nishiyama, Cellulose, 2008, 15, 425–433 CrossRef CAS.
- L. Jowkarderis and T. G. van de Ven, Carbohydr. Polym., 2015, 123, 416–423 CrossRef CAS PubMed.
- M. Pääkkö, M. Ankerfors, H. Kosonen, A. Nykänen, S. Ahola, M. Österberg, J. Ruokolainen, J. Laine, P. T. Larsson and O. Ikkala, et al. , Biomacromolecules, 2007, 8, 1934–1941 CrossRef PubMed.
- R. J. Crawford, K. J. Edler, S. Lindhoud, J. L. Scott and G. Unali, Green Chem., 2012, 14, 300–303 RSC.
- A. Naderi and T. Lindström, Cellulose, 2014, 21, 3507–3514 CrossRef CAS.
- L. Jowkarderis and T. G. van de Ven, Cellulose, 2014, 21, 2511–2517 CrossRef CAS.
- S. Provencher, Comput. Phys. Commun., 1982, 27, 229–242 CrossRef.
- H. H. Winter and M. Mours, Adv. Polym. Sci., 1997, 134, 165–234 CrossRef CAS.
- A. S. Negi, C. G. Redmon, S. Ramakrishnan and C. O. Osuji, J. Rheol., 2014, 58, 1557–1579 CrossRef CAS.
- A. B. Fall, S. B. Lindström, J. Sprakel and L. Wågberg, Soft Matter, 2013, 9, 1852–1863 RSC.
- J. R. Lott, J. W. McAllister, M. Wasbrough, R. L. Sammler, F. S. Bates and T. P. Lodge, Macromolecules, 2013, 46, 9760–9771 CrossRef CAS.
- M. Gardel, J. Shin, F. MacKintosh, L. Mahadevan, P. Matsudaira and D. Weitz, Phys. Rev. Lett., 2004, 93, 188102 CrossRef CAS PubMed.
- J. V. Shah and P. A. Janmey, Rheol. Acta, 1997, 36, 262–268 CrossRef CAS.
- S. Motte and L. J. Kaufman, Biopolymers, 2013, 99, 35–46 CrossRef CAS PubMed.
- M. Pouzot, T. Nicolai, L. Benyahia and D. Durand, J. Colloid Interface Sci., 2006, 293, 376–383 CrossRef CAS PubMed.
- T. Z. Grove, C. O. Osuji, J. D. Forster, E. R. Dufresne and L. Regan, J. Am. Chem. Soc., 2010, 132, 14024–14026 CrossRef CAS PubMed.
- P. A. Rühs, C. Affolter, E. J. Windhab and P. Fischer, J. Rheol., 2013, 57, 1003–1022 CrossRef.
- J. W. McAllister, J. R. Lott, P. W. Schmidt, R. L. Sammler, F. S. Bates and T. P. Lodge, ACS Macro Lett., 2015, 4, 538–542 CrossRef CAS.
- R. C. Arevalo, J. S. Urbach and D. L. Blair, Biophys. J., 2010, 99, L65–L67 CrossRef CAS PubMed.
- D. Tatsumi, S. Ishioka and T. Matsumoto, Nihon Reoroji Gakkaishi, 2002, 30, 27–32 CrossRef CAS.
- A. Naderi, T. Lindström and T. Pettersson, Cellulose, 2014, 21, 2357–2368 CrossRef CAS.
- P.-G. De Gennes, Scaling concepts in polymer physics, Cornell University Press, 1979 Search PubMed.
- M. Doi and S. F. Edwards, J. Chem. Soc., Faraday Trans. 2, 1978, 74, 1818–1832 RSC.
- F. C. MacKintosh, J. Käs and P. A. Janmey, Phys. Rev. Lett., 1995, 75, 4425–4428 CrossRef CAS PubMed.
- R. J. Hill, Biomacromolecules, 2008, 9, 2963–2966 CrossRef CAS PubMed.
- I. Tucker, J. Petkov, J. Penfold and R. K. Thomas, Langmuir, 2010, 26, 8036–8048 CrossRef CAS PubMed.
- L. Torn, L. Koopal, A. de Keizer and J. Lyklema, Langmuir, 2005, 21, 7768–7775 CrossRef CAS PubMed.
- S. Paria, C. Manohar and K. C. Khilar, Colloids Surf., A, 2005, 252, 221–229 CrossRef CAS.
- I. M. Tucker, J. T. Petkov, J. Penfold and R. K. Thomas, Langmuir, 2012, 28, 10223–10229 CrossRef CAS PubMed.
Footnote |
| † Electronic supplementary information (ESI) available: Table of CMCs of surfactants, DLS of neat CNF gels, rheology and photograph of SLES gel, and zeta potential measurements. See DOI: 10.1039/c5sm01803j |
| This journal is © The Royal Society of Chemistry 2016 |

