
 Open Access Article
 This Open Access Article is licensed under a
 Creative Commons Attribution 3.0 Unported Licence
A single cation or anion dendrimer-based liquid electrolyte†
Sudeshna
Sen
a,
Rudresha B.
Jayappa
a,
Haijin
Zhu
b,
Maria
Forsyth
b and
Aninda J.
Bhattacharyya
*a
aSolid State and Structural Chemistry Unit, Indian Institute of Science, Bangalore, 560012, India. E-mail: aninda_jb@sscu.iisc.ernet.in
bInstitute for Frontier Materials, Deakin University, Burwood, Waurn Ponds, VIC3216, Australia
First published on 29th January 2016
Abstract
We propose here a novel liquid dendrimer-based single ion conductor as a potential alternative to conventional molecular liquid solvent–salt solutions in rechargeable batteries, sensors and actuators. A specific change from ester (–COOR) to cyano (–CN) terminated peripheral groups in generation-one poly(propyl ether imine) (G1-PETIM)–lithium salt complexes results in a remarkable switchover from a high cation (tLi+ = 0.9 for –COOR) to a high anion (tPF6− = 0.8 for –CN) transference number. This observed switchover draws an interesting analogy with the concept of heterogeneous doping, applied successfully to account for similar changes in ionic conductivity arising out of dispersion of insulator particle inclusions in weak inorganic solid electrolytes. The change in peripheral group simultaneously affects the effective ionic conductivity, with the room temperature ionic conductivity of PETIM–CN (1.9 × 10⁻⁵ Ω−1 cm−1) being an order of magnitude higher than PETIM–COOR (1.9 × 10⁻⁶ Ω−1 cm−1). Notably, no significant changes are observed in the lithium mobility even following changes in viscosity due to the change in the peripheral group. Changes in the peripheral chemical functionality directly influence the anion mobility, being lower in PETIM–COOR than in PETIM–CN, which ultimately becomes the sole parameter controlling the effective transport and electrochemical properties of the dendrimer electrolytes.
Introduction
One of the important strategies towards building stable and safe rechargeable batteries has been to develop newer forms of electrolytes as potential alternatives to conventional liquid molecular solvent–salt solutions.1,2 In this line of thought, various electrolyte systems ranging from solid crystalline electrolytes to “solid-like” soft organic electrolytes have been explored as alternatives to conventional liquid electrolytes focused mainly for applications in lithium-based battery chemistries.3–7 Polymer electrolytes, which exhibit interesting compliable mechanical properties in addition to high ionic conductivity, have shown greater potential than solid crystalline electrolytes in diverse electrochemical devices, viz. batteries,8a fuel cells,8b actuators,8c sensors.9 Design of novel polymer architectures (e.g. network, branched polymers) has been one of the important strategies for the development of high ion conducting polymer electrolytes.10 The major drawback with various polymer-based electrolytes is that the cations and anions contribute to the specific conductivity and thus the specific ion, i.e. cation or anion, transference number is not high. In particular the cation ion transference number, which is of practical interest for various rechargeable battery chemistries, is typically low in the range t+ = 0.2–0.5.10,11 There have been several strategies to design polymer electrolytes with high transference number without significantly compromising the effective ionic conductivity. The majority of these approaches have been applied on polymers in the solid form, viz. via chemical manipulations of the constituting units of the polymer or from single ion conductors where an ion of one type (say anion) is immobilized on the polymer backbone as in block or copolymer units. The other major concern with solid-like electrolytes is related to poor charge transport kinetics at the electrode|electrolyte interface which leads to poor device efficiency. Apart from a few glowing examples, the overwhelming majority of polymer electrolytes and in general solid electrolytes have not been able to successfully transcend the precincts of laboratory-scale demonstrations. This has led to the persistence of conventional liquid electrolytes in the majority of modern-day electrochemical devices, including rechargeable batteries.Dendrimers are a special class of mono-dispersed branched polymers, containing a large number of branched flexible chain-ends emanating from a core or linker molecules. This unique architecture has attracted considerable attention in biomedicine, catalysis, sensing and energy storage.12 The mechanical consistency of dendrimers is intermediate between low viscosity molecular solvents (η ≈ 10−3 Pa s) and high viscosity polymer gel or polymer–salt complex (very high η; η → ∞) electrolytes. Due to the higher viscosities of dendrimers compared to typical molecular solvents, the ionic mobility and hence the effective ionic conductivity of dendrimer electrolytes are expected to be lower compared to molecular solvent–salt liquid solutions. In the context of the vast volume of work accomplished with regard to solid polymers with high ionic conductivity,13 viscosity cannot be the sole criteria for the determination of ionic mobility and effective ionic conductivity. Similarly, the high viscosity of dendrimers should not be a deterrent for exploring their application in electrochemical devices. The high degree of branching in the dendrimer network leads to multiple advantages, viz. larger free volume, higher amorphicity and low glass transition temperatures (implying higher chain flexibility).14 These, coupled with the flexibility to freely tune the chemical composition and conformation as a function of generation number, also significantly affect the ion-solvating ability and host–guest interactions with various metal salts including alkali-metal salts which are of direct relevance to rechargeable batteries. These advantageous features should make dendrimers an attractive alternative liquid matrix to conventional liquids, ionic liquids or solid polymers for the synthesis of ion conductors tailored to perform specific tasks in various electrochemical devices. Of specific interest is whether a dendrimer can be employed to produce electrolytes with high ion transference number of a single ion type. To the best of our knowledge there have been no efforts undertaken in this direction. Additionally, there have been no detailed and conclusive studies undertaken on the correlation of various chemical functional parameters with the ion transport mechanism in dendrimers, in spite of their anticipated potential in various electrochemical applications. Studies in these directions will be expected to throw more light on the ion transport mechanism in dendrimers and identify key parameters for the development of dendrimer-based ion conductors for various applications such as rechargeable batteries, sensors, and actuators.14,15 We present here for the first time a detailed study of the influence of the chemical nature of peripheral functional groups on ionic conductivity, diffusion and transference number in generation-1 poly(propyl ether imine) (G1-PETIM)–lithium salt mixtures. We demonstrate here that the peripheral chemical functionality is a very important parameter to optimize the effective transport as well as the electrochemical properties of the dendrimer electrolyte.
Results and discussion
Ion transport in polymer electrolytes largely depends on the chemical characteristics of the polymer, such as branching, network, and functionality of the side chains.8a,16,17 Different functional groups exhibit different binding abilities due to varying polarity of the groups and this influences the ion solvation via dissociation of the salt. On the other hand, their spatial distributions and the sizes of end chains affect both cation and anion mobility, resulting in large differences in the corresponding ion transference numbers.17 The above stated issues on ionic conductivity and transference number are systematically probed here in the context of G1-PETIM dendrimers. The G1-dendrimers are synthesized with different end functional groups (–COOH, –COOR, –OH, –CN) maintaining the same linker (ether) and branching points (tertiary amine; cf. schematic Fig. 1). The study here focuses only on the first generation dendrimers primarily due to the following reasons. Firstly, the viscosity (0.1–6 Pa s) of the G1-PETIM dendrimer, though higher than the viscosity of a typical liquid molecular solvent (0.5–10 mPa s),18 is much lower than the higher generation Gn-PETIM dendrimers (n = 2–4). So, the influence of viscosity on ionic conductivity will be much less in G1-PETIM compared to Gn-PETIM dendrimer liquid electrolytes. The magnitude of ionic conductivity of some of the G1 dendrimers will not be significantly lower compared to a typical molecular liquid solvent–salt solution17 of relevance to rechargeable batteries (typically: >10−3 to 10−2 Ω−1 cm−1). Secondly, in G1 dendrimers the number density of the linker and branching moieties is lower compared to higher generation dendrimers. Hence, the non-trivial influence due to the linker and branching moieties on solvation and ion mobility anticipated in the higher generations will be minimal and assumed constant in the G1 dendrimers. The ion transport in the G1 dendrimer electrolytes can then be directly correlated to the nature of the peripheral chemical functionality. | ||
| Fig. 1 Schematic representation of ion transport mechanism in G1–PETIM dendrimers with different peripheral functional groups: (a) G1–CN, (b) G1–COOR, (c) G1–COOH, (d) G1–OH. | ||
The temperature dependent ionic conductivity and viscosity of first-generation dendrimers (with different functional groups) with 0.1 M LiPF6 in the temperature range 0–60 °C are shown in Fig. 2a and b respectively. The first-generation nitrile-terminated PETIM dendrimer electrolyte (G1–CN–0.1 M LiPF6) exhibits the highest room temperature ionic conductivity of 1.9 × 10⁻⁵ Ω−1 cm−1, whereas G1–OH–0.1 M LiPF6 shows the lowest conductivity of 9 × 10⁻⁷ Ω−1 cm−1. The conductivities of G1–COOR–0.1 M LiPF6 and G1–COOH–0.1 M LiPF6 at 25 °C are intermediate to those of G1–CN–0.1 M LiPF6 and G1–OH–LiPF6, being 1.9 × 10⁻⁶ Ω−1 cm−1 and 9.8 × 10⁻⁷ Ω−1 cm−1 respectively. The measured ionic conductivity values of the various dendrimer electrolytes, which are on a par with many single ion conductors,10a,19 have the following trend: σG1–CN > σG1–COOR > σG1–COOH ∼ σG1–OH. This variation in conductivity between the various dendrimer electrolytes by more than one order of magnitude indicates a strong correlation between the chemical nature of peripheral functionalization and ion transport. The activation energies of conductivity are obtained by a linear fit of the conductivity data using the Arrhenius equation: σ = Ae−Ea/kT, where A, Ea, k, T are the pre-exponential factor, activation energy, Boltzmann constant and temperature respectively (cf. fitting parameters in Table ST2†). In spite of notable differences in ionic conductivities between G1–CN, G1–COOR and G1–COOH, interestingly no significant differences exist in the estimated activation energies between G1–CN (EσG1–CN = 0.54 eV), G1–COOR (EσG1–COOR = 0.58 eV) and G1–COOH (EσG1–COOH = 0.58 eV). The VTF fitting20 parameters of the conductivity plot (Fig. 2a) are tabulated in Table ST3.† However, it is strongly felt that VTF fitting of the conductivity results is inappropriate for the present study. This is mainly attributed to the simpler chemical structure of the first-generation dendrimers compared to higher generation dendrimers and polymers.
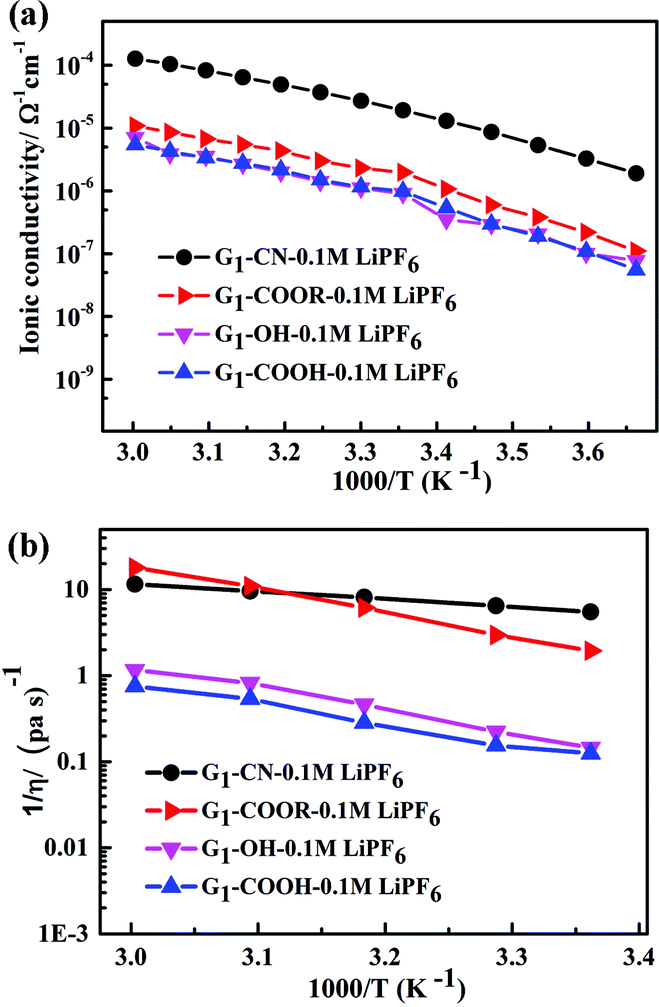 | ||
| Fig. 2 (a) Temperature dependent ionic conductivity and (b) fluidity (η−1) of G1 dendrimers with different peripheral functional groups. | ||
The conductivity behaviour is correlated to the temperature dependent fluidity (1/η, where η is the viscosity) shown in Fig. 2b. The viscosities of PETIM dendrimers, calculated from the static viscosity versus shear rate measurements, are shown in Table ST2.† The viscosity increases by nearly two times from 0.15 Pa s for G1–CN to 0.30 Pa s for G1–COOR. The viscosities at 30 °C for G1–OH–0.10 M LiPF6 and G1–COOH–0.10 M LiPF6 are even higher, being 4.5 Pa s and 6.5 Pa s respectively. The viscosity values showed the following trend: ηG1–CN < ηG1–COOR < ηG1–OH < ηG1–COOH. The higher viscosity of the ester dendrimer (G1–COOR) compared to G1–CN is attributed to the more polar nature of the –COOR group compared to the –CN group and the steric hindrance exerted by the bulkier –COOR (R = t-butyl) group implying a higher dragging force compared to the linear –CN in G1–CN. Differences in viscosity between G1–carboxyl/hydroxyl groups (i.e. COOR, COOH and OH) and G1–CN can also be accounted for on the basis of the intra- or inter-molecular hydrogen bonding. The strength of hydrogen bonds is significantly higher in G1–COOH and G1–OH resulting in significantly higher viscosity compared to G1–CN and G1–COOR. An increase in viscosity for carboxyl groups (G1–COOR and G1–COOH) and hydroxyl (G1–OH) terminated dendrimers results in a decrease in ionic conductivity compared to the G1–CN dendrimer. Activation energies of viscosity, obtained by fitting the temperature dependent fluidity (1/η) (Fig. 2b) using the Arrhenius equation, are tabulated in Table ST2.† Similar trends in activation energies for both temperature dependent conductivity and viscosity indicate that the underlying mechanism for conductivity and viscosity is thermally activated. However, the observed trends in viscosity cannot be correlated one-to-one with the conductivity trends. This is especially true for the –COOH terminated dendrimer. A logical interpretation of the observed trends in conductivity and viscosity can only be achieved by simultaneously studying the diffusion behavior of the various participating entities, viz. Li+, PF6− and H (dendrimer). G1–COOH and G1–OH have been excluded from additional studies as both have lower ionic conductivities and higher viscosities compared to G1–CN and G1–COOR in the measured temperature range. G1–COOR is selected as the representative among the two carboxyl groups as an understanding of the mechanism in –COOR will also aid in accounting for the experimental observations in –COOH.
Ion solvation in G1–CN–LiPF6 and G1–COOR–LiPF6 electrolytes was studied by FTIR spectroscopy at various salt concentrations (ranging from 0 to 0.1 M) and temperatures (from room temperature to 70 °C). The FTIR spectra for both the electrolytes in the wavenumber region 800–920 cm−1 (normalized with respect to the highest intensity peak at 1118 cm−1 for G1–CN and 1154 cm−1 for G1–COOR) are shown in Fig. 3. The area under the peak is calculated by fitting the spectra with Gaussian function. Fig. 3a and b depicts the FTIR spectra of G1–CN–x M LiPF6 and G1–COOR–x M LiPF6 respectively with varying salt concentration (x) ranging from 0 to 0.10 M. Both pristine G1–COOR and G1–CN exhibit the characteristic symmetric stretching vibration of C–O–C groups of the aliphatic ether present in the dendrimer core at 848 cm−1 (splitting in the C–O–C symmetric stretch in G1–CN leads to an additional band at 830 cm−1, possibly due to the presence of two types of ether groups in the core and at the periphery).21
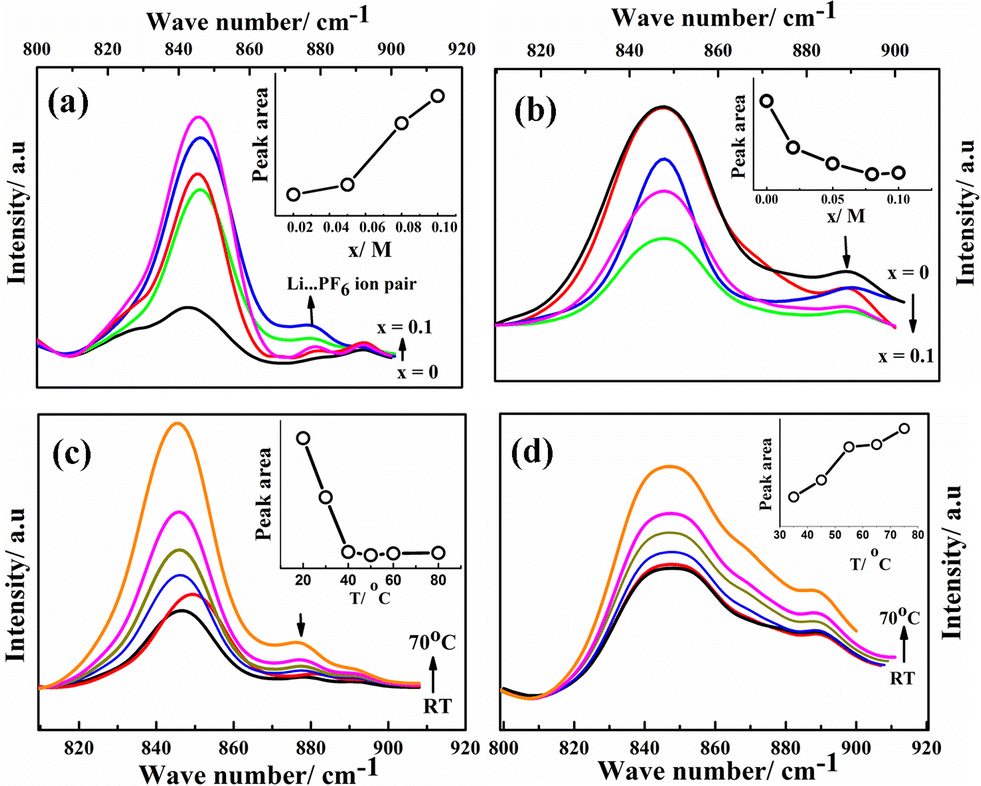 | ||
| Fig. 3 FTIR spectra of G1–CN–LiPF6 (a) and G1–COOR–LiPF6 (b) at different salt concentrations [x = 0 (black), 0.01 (red), 0.02 (magenta), 0.05 (green), 0.1 (blue)]. FTIR spectra of G1–CN–LiPF6 (c) and G1–COOR–LiPF6 (d) at different temperatures (T = RT to 70 °C, with x = 0.1) [T = RT (black), 30 °C (red), 40 °C (blue), 50 °C (green), 60 °C (magenta), 70 °C (orange)]. | ||
This band is observed to merge with the strong band also appearing at 848 cm−1 corresponding to the P–F vibration of the free PF6− ion of the salt22 in G1–CN–x M LiPF6. A weak band appearing at 875 cm−1 for G1–CN–x M LiPF6 is assigned to the associated tri-dentate ion pair of the LiPF6 salt and this is in good agreement with previous reports.22 With increasing salt concentration, the band area of the weaker band at 875 cm−1 is observed to intensify (inset of Fig. 3a) with respect to the stronger band (at 848 cm−1) for G1–CN–x M LiPF6. This suggests the presence of ion pairs in G1–CN–x M LiPF6. The intensity of this shoulder band at 875 cm−1 decreases with increasing temperature from RT to 70 °C (Fig. 3c), signifying the dissociation of ion pairs with increasing temperature. In the case of pure G1–COOR, the observed IR band at 898 cm−1 (Fig. 3b) is attributed to the C–C stretching frequencies of ester (O–C–C) or ether groups,21 which is affected by addition of the salt as well as temperature. No additional bands corresponding to ion pairs are observed in G1–COOR–x M LiPF6 (Fig. 3b) at various salt concentrations, signifying facile salt dissociation in ester functionalized dendrimers. Stronger interaction of the oxygen atom of the ester group with the Li+ ion, compared to the –CN group, leads to higher dissociation of ion pairs in G1–COOR. To support the FTIR observations, the Stokes equations (cf. ESI†) for both dendrimers have been investigated (Fig. S3†). Fig. S3† shows the product of dc conductivity (related to the number of free charges from the Stokes equation) and viscosity at various temperatures for both dendrimers. The constancy of this product (i.e. Nq2/6πrs in eqn (SE1) in ESI†) at various temperatures for G1–COOR signifies no change in free charges with an increase of temperature, which is true for electrolytes with a fully dissociated salt. In the case of G1–CN, an increase in free charges is observed with an increase in temperature (in Fig. S3 in ESI†), which is attributed to an increase in salt dissociation with increasing temperature.
The self-diffusion coefficients, characterizing long-range macroscopic transport of 7Li, 19F and 1H nuclei, are obtained from multinuclear PFG-NMR experiments using ln![[thin space (1/6-em)]](https://www.rsc.org/images/entities/char_2009.gif) I/I0 = −DNMRγ2(Δ − δ/3)δ2g2,23 where I and I0 are the signals in the presence and absence of the gradient respectively, γ is the gyromagnetic ratio of the nucleus studied, Δ is the interval between the gradient pulses, δ is the length of the gradient pulse, and g is the magnitude of the gradient pulse. Self-ionic diffusion coefficients in the temperature range 0–60 °C are shown in Fig. 4a.
I/I0 = −DNMRγ2(Δ − δ/3)δ2g2,23 where I and I0 are the signals in the presence and absence of the gradient respectively, γ is the gyromagnetic ratio of the nucleus studied, Δ is the interval between the gradient pulses, δ is the length of the gradient pulse, and g is the magnitude of the gradient pulse. Self-ionic diffusion coefficients in the temperature range 0–60 °C are shown in Fig. 4a.
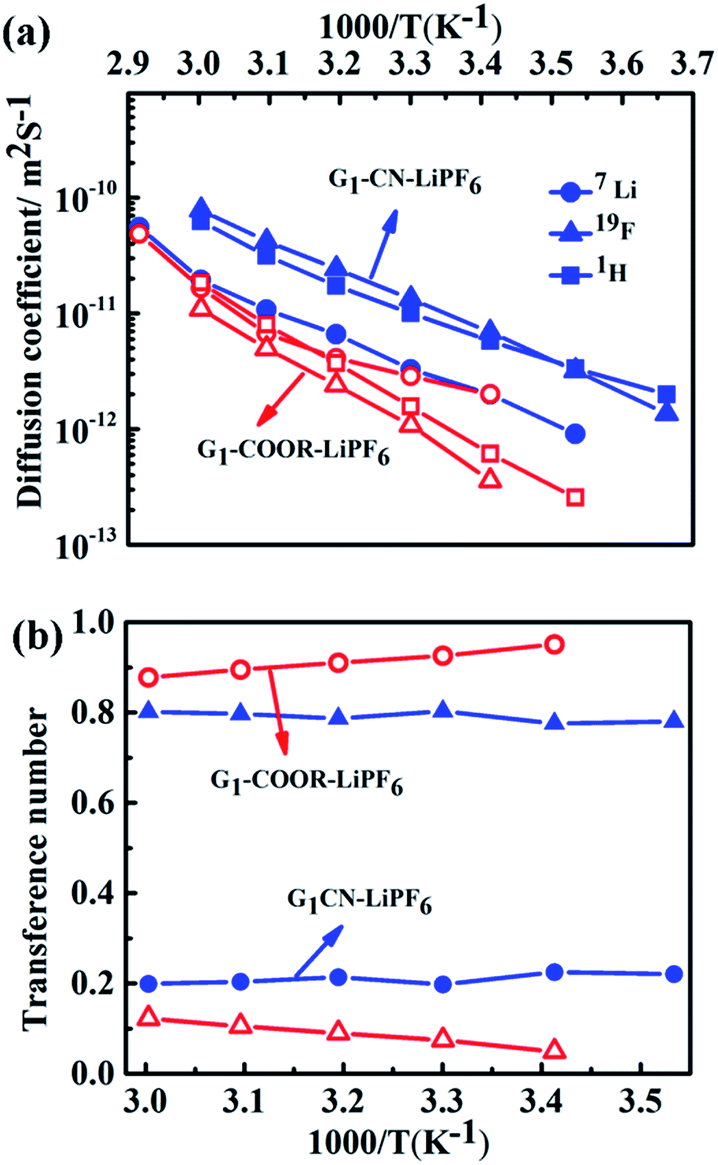 | ||
| Fig. 4 (a) Self-diffusion coefficients of 1H (squares), 19F (triangles), 7Li (circles) at various temperatures for G1–CN–0.1 M LiPF6 (blue, with closed symbols) and G1–COOR–0.1 M LiPF6 (red, with open symbols). (b) 7Li and 19F transference numbers of G1–CN–0.1 M LiPF6 (blue) and G1–COOR–0.1 M LiPF6 (red) at various temperatures. | ||
G1–CN–0.1 M LiPF6 exhibits much higher 1H diffusion coefficients (varying from 1.9 × 10⁻¹² to 6.3 × 10⁻¹¹ m2 s−1 between 0 and 60 °C), nearly one order in magnitude higher compared to G1–COOR–0.1 M LiPF6 (2.5 × 10⁻¹³ to 1.8 × 10⁻¹¹ m2 s−1 between 10 and 60 °C). Following the Stokes–Einstein equation (D = kT(6πηrs)−1, where η, D and rs are viscosity, self-diffusion coefficient and effective hydrodynamic (Stokes) radius respectively), the higher viscosity (0.3 Pa s) of G1–COOR–0.1 M LiPF6 compared to G1–CN–0.1 M LiPF6 (0.15 Pa s) results in lower 1H diffusion coefficients for the ester dendrimer. 19F self-diffusion coefficients for both G1–CN–0.1 M LiPF6 (1.36 × 10⁻¹² to 7.8 × 10⁻¹¹ m2 s−1 between 0 and 60 °C) and G1–COOR–0.1 M LiPF6 (3.5 × 10⁻¹³ to 1.1 × 10⁻¹¹ m2 s−1 between 20 and 60 °C) are found to be in close proximity to their respective 1H diffusion coefficient values. The similarities in diffusion coefficient values between 19F and 1H nuclei for both G1–COOR and G1–CN signify correlated PF6− anion motion with the dendrimer molecules. The lower viscosity of G1–CN–0.1 M LiPF6 results in nearly one order of magnitude higher 19F diffusion coefficient for G1–CN–0.1 M LiPF6 (1.3 × 10⁻¹¹ m2 s−1 at 30 °C) compared to that of G1–COOR–0.1 M LiPF6 (1.1 × 10⁻¹² m2 s−1 at 30 °C). The estimated RPF6− (= DH/DF) for 19F in G1–CN (0.6) and G1–COOR (0.8) supports a stronger solvent-correlated PF6− motion in G1–COOR compared to G1–CN. The reason behind this correlation is possibly due to stronger steric hindrance posed by the bulkier t-butyl groups to PF6− mobility24 in G1–COOR compared to linear –CN in G1–CN. In contrast, lithium-ion diffusion is not at all influenced by the viscosity. Similar values of 7Li self-diffusion coefficients are observed in both cases (2.0 × 10⁻¹² to 5 × 10⁻¹¹ m2 s−1 between 30 and 60 °C). The contributions of Li+ and PF6− towards the total effective conductivity for G1–CN, calculated following the Nernst–Einstein equation23,25a (σi = Nq2(kT)−1Di, where σi and Di are the dc ionic conductivity and diffusion coefficient of the ith ion type), are 1.2 × 10⁻⁵ Ω−1 cm−1 and 4.9 × 10⁻⁵ Ω−1 cm−1 respectively. The higher value of anion conductivity strongly suggests that G1–CN is predominantly an anion conductor. On the other hand, the lower contribution of 19F (σ = 3.9 × 10⁻⁶ Ω−1 cm−1 from NMR data) to the total conductivity in G1–COOR compared to its 7Li diffusion (1.1 × 10⁻⁵ Ω−1 cm−1) strongly suggests cation transport in the ester dendrimer. Thus, trapping of anions by the peripheral bulkier ester group in G1–COOR makes it a single cationic conductor. Thus, the difference in effective ionic conductivity values between G1–CN and G1–COOR is mainly due to the difference in the anionic conductivity between them. Manipulation of the chemical constitution of dendrimers via variations in the peripheral group, which exert varying degrees of steric hindrance to the mobility of anions, results in a transformation from an anionic to a cationic conductor. This approach is interesting as it becomes the organic analog to the concept of heterogeneous doping introduced by Maier.26 Heterogeneous doping has been in the past successfully implemented to account for changes in effective ionic conductivity of solid–solid composites comprised of dispersions of nanometer- to micrometer-sized oxide additives (e.g. Al2O3, SiO2) in a weak solid electrolyte, e.g. LiI, TlCl2.27 In this concept, the changes in conductivity have been attributed to the space-charge layer formed at the interface of the weak electrolyte–oxide insulator which directly influences the transition from an anion to a cation conductor as demonstrated in TlCl2–Al2O3. The concept with limited success was later extended to liquids where dispersions of fine oxide particles in liquid electrolytes lead to modest enhancements in the effective conductivity of the liquid.28,29 To the best of our knowledge the heterogeneous doping concept has not yet been utilized to transform the nature of ion transport in liquids. It is envisaged that the approach presented here is the first of its kind to be adopted in the realm of liquids. This adopted approach is simpler and is expected to be highly efficient and reproducible compared to the addition of oxides, which display considerable non-uniformities in size and chemical functionality of the oxide additive.
In the case of G1–CN–0.1 M LiPF6, the observed 7Li diffusion coefficient is almost an order of magnitude lower compared to its corresponding 19F or 1H diffusion coefficients, signifying uncorrelated motion of lithium ions with the dendrimer molecules, as expected in the case of weak interactions between –CN and Li+. On the other hand, stronger binding between –COOR and Li+ in G1–COOR–LiPF6 leads to close proximity of 7Li to the 1H diffusion coefficients at all temperatures, signifying a higher correlated motion of lithium ions with the ester molecules. The correlated motion of Li+ in G1–COOR is further supported by the estimate of the Stokes radius for lithium (RLi = DH/DLi),25b which is equal to 1.4, signifying an almost 1:1 co-ordination between G1–COOR and Li+.
The temperature dependent ionic diffusivity (Fig. 4a) is fitted using the Arrhenius equation and the activation energies for 7Li, 1H and 19F diffusion are tabulated in Table ST4 (ESI†). The observed trend in activation energies for Li+ and F− diffusion is as follows: ED(Li) (G1–CN) (= 0.53 eV) ∼ ED(Li) (G1–COOR) (= 0.53 eV) and ED(F) (G1–CN) (= 0.50 eV) < ED(F) (G1–COOR) (= 0.70 eV). This trend further suggests that the viscosity mainly influences the activation energy of 19F diffusion and not 7Li diffusion. Similarly, the Li+ diffusion activation energy (ED(Li)) between G1–CN and G1–COOR leads to similar activation energy of conductivity, as obtained from ac impedance spectroscopy (Fig. 2a). Hence, the underlying mechanism of lithium conduction is similar to the lithium diffusion mechanism, and the difference in the effective conductivity is mainly determined by the differences in anion mobility. The temperature dependent viscosity (Fig. 2b) and diffusion (Fig. 4a) do not show a clear VTF-like behaviour (i.e. curvature-like profile). So, employing the VTF analysis will not be appropriate for analyzing and correlating the diffusion, viscosity and conductivity data together. Additionally, first-generation dendrimers are considered as viscous liquids with considerably simpler molecular architectures than the higher generation dendrimers (Gn, n > 2) or polymers. So, based on these aspects we considered thermally activated diffusion, viscosity and conductivity (i.e. Arrhenius), rather than segmental motion-driven ion transport where VTF fitting would be more appropriate.
The transference numbers of 7Li(t+) and 19F(t−) are calculated from ionic diffusion coefficients following the equation: t+ = (1 − t−) = D+(D+ + D−)−1 where D+ and D− are the cationic and anionic diffusion coefficients respectively. Fig. 4b shows the temperature dependent cationic (Li+) and anionic (PF6−) transference numbers for both G1–COOR–0.1 M LiPF6 and G1–CN–0.1 M LiPF6. G1–COOR–0.1 M LiPF6 exhibits an extremely high lithium transference number (t+) of 0.9 at all experimental temperatures, whereas the Li+ transference number of G1–CN–0.1 M LiPF6 is observed to be as low as 0.2, almost comparable to conventional PEO-based polymer electrolytes. Lower values of 19F diffusion coefficient compared to Li+ diffusion coefficient in the G1–COOR electrolyte lead to an extremely high Li+ transference number, suggesting predominantly a cationic conductor. In comparison, G1–CN presents the opposite scenario, where a very high anionic transference number (t− = 0.8) is observed compared to lithium, implying favorable anion transport. As discussed earlier, the viscosity and steric hindrance of bulky peripheral –COOR groups affect the mobility of larger anions, and this trapping effect results in the extremely high Li+ transference number in G1–COOR, in spite of the lower conductivity compared to the G1–CN electrolyte. A significant difference in cationic transference number between G1–CN (t+ = 0.2) and G1–COOR (t+ = 0.9) further suggests that the present approach is highly effective in manipulating the nature of ion transport in dendrimer electrolytes. We attempted the estimation of the Li+ ion transference number using the electrochemical method proposed by Evans, Vincent and Bruce.20a,30 This method has been predominantly employed to estimate the cation transference numbers of liquid and polymer electrolytes. Molecular solvent-based liquid and polymer electrolytes exhibit both cation and anion conductivity in one system. The transference number of one ion type is usually greater than the other; however, both are appreciably high and contributions to conductivity from the minority carrier cannot be neglected. So, the G1 dendrimer electrolytes do not exactly match the criteria for applicability of this method. The t+ for G1–CN–0.1 M LiPF6 is estimated to be ≈0.4, which was higher than our estimates from NMR (t+ = 0.2). Thus, both electrochemical and NMR measurements conclude that the G1–CN is an anion conductor. On the other hand, the estimated t+ of G1–COOR–LiPF6 was 0.3, instead of 0.9 as predicted from the diffusion NMR measurements. The reason for the large discrepancy between the values in G1–COOR is due to a combination of various factors. Higher viscosity leads to slower anion kinetics during polarization. An extremely slow anion diffusion coefficient also leads to uncertainties in maintaining the necessary condition of zero anion flux in the steady state. At this juncture, the possibility of an imminent application of the novel G1 dendrimer electrolyte in an electrochemical device is remote and non-trivial. However, it is strongly envisaged that the present dendrimer and similar systems will have strong implications in various applications such as rechargeable batteries, sensors and actuators. The present dendrimers exhibit very high anion and cation transference numbers, with the conductivities being on a par with those of many polymer-based single ion conductors.10a,19 The remarkably high cation transference number (t+ = 0.9) of G1–COOR–LiPF6 prompted us to perform electrochemical characterizations for potential application as an electrolyte or as a co-solvent in rechargeable batteries. We discuss here some of the studies which may trigger electrolyte designs based on dendrimers, in general polymeric systems for rechargeable batteries based on lithium. The cell configurations and electrode assemblies employed for the studies are exactly similar to those used for molecular based solvent electrolytes.
The electrochemical potential windows of G1–CN–LiPF6 and G1–COOR–LiPF6 electrolytes were studied via cyclic voltammetry with Li|G1-dendrimer–LiPF6|SS (stainless steel) cell configuration at a scan rate of 1 mV s−1, and the results are represented in Fig. 5a and b respectively. The cyclic voltammograms clearly shows that the G1–CN system does not support stable reversible cycling of Li, whereas G1–COOR shows a lithium stripping peak (at ∼2 V) followed by reductive deposition too. The higher cathodic (deposition) currents observed for G1–CN as compared to G1–COOR are consistent with the higher conductivity of G1–CN compared to G1–COOR. Improved reversibility in lithium cycling for G1–COOR compared to G1–CN is a consequence of the higher lithium transference number and faster ionic diffusion at the lithium electrode. Both of these dendrimers show a stable electrochemical window of 4 V as observed from cyclic voltammetry.
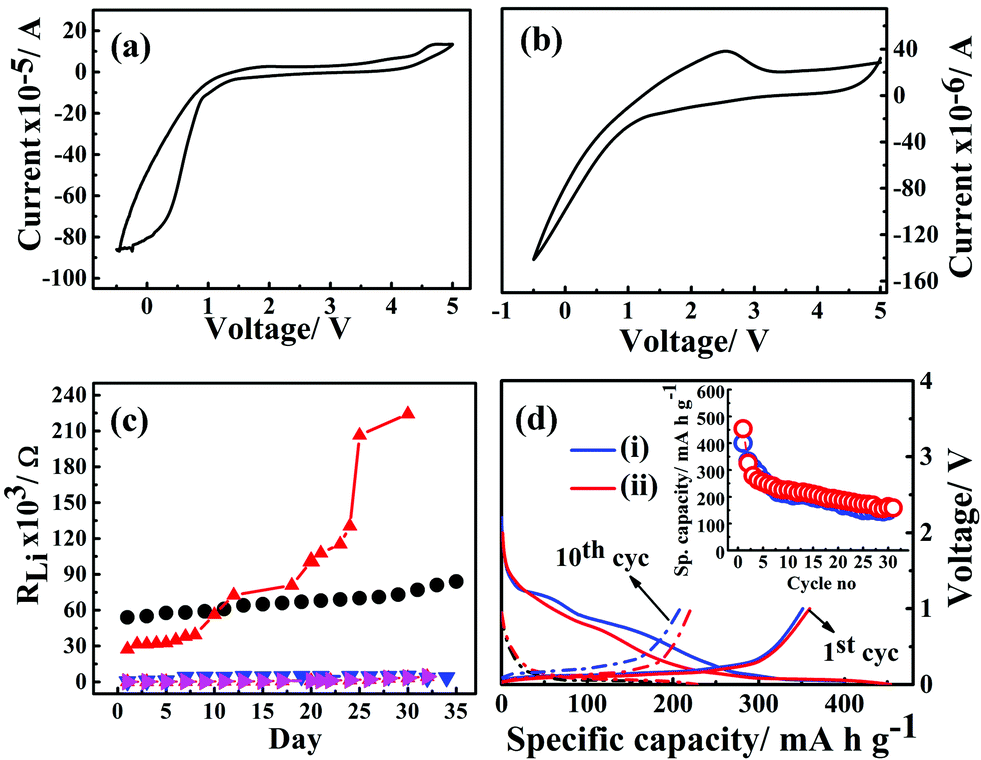 | ||
| Fig. 5 Cyclic voltammograms of G1–CN–0.1 M LiPF6 (a) and G1–COOR–0.1 M LiPF6 (b) with stainless steel as working and lithium as reference and counter electrodes. (c) Lithium interface stability of G1–CN (black circles), G1–COOR (red triangles), 50% G1–CN–(EC–DMC) (pink triangles), 50% G1–COOR–(EC–DMC) (blue triangles) dendrimer electrolytes. (d) Battery cycling performance of ternary 50% G1–CN–(EC–DMC–LiPF6) (i) (blue) and 50% G1–COOR–(EC–DMC–LiPF6) (ii) (red) electrolytes with Li/electrolyte/graphite cell configuration at C/10 constant current rate. Inset shows specific capacity (mA h g−1) vs. cycle number for both ternary electrolytes. | ||
The electrochemical stability of G1–COOR–LiPF6 and G1–CN–LiPF6 electrolytes at lithium metal interfaces were investigated over a period of 35 days by ac impedance spectroscopy in a symmetrical Li|G1-dendrimer|Li cell configuration, as shown in Fig. 5c. The lithium interface resistance (RLi) was evaluated from the Nyquist plots as shown in Fig. S4.† The lithium interfacial resistance (RLi) of G1–COOR–0.1 M LiPF6 on the first day (5.4 × 10⁴ Ω) is higher than that of G1–CN–0.1 M LiPF6 (2.7 × 10⁴ Ω). However, a sudden increase in interfacial resistance is observed in the case of G1–CN–LiPF6 after the 15th day. At the 30th day, RLi of G1–CN–0.1 M LiPF6 increased to 2.2 × 10⁵ Ω (10 times increase in magnitude compared to day 1). On the other hand, the G1–COOR electrolyte displayed a marginal increase over the same period reaching the value of 7.7 × 10⁴ Ω on the 30th day (1.3 times increase in magnitude). This result indicates a slower rate of growth of the passivation layer at the lithium interface for G1–COOR–0.1 M LiPF6 compared to G1–CN–0.1 M LiPF6. The improved stability can be directly attributed to the high tLi+ in G1–COOR–0.1 M LiPF6 which improves the charge transfer kinetics at the electrode|electrolyte interface. Following this, galvanostatic charge/discharge cycling measurements were performed (rate = C/10). The pristine dendrimer–salt system i.e. G1–COOR–LiPF6 (and G1–CN–LiPF6) exhibited poor galvanostatic cycling. The capacity faded to very low values within a few cycles. We attribute the failure to the high viscosity of the pristine dendrimer–salt system which resulted in poor charge kinetics at the electrode|electrolyte interface.
Following the unsatisfactory battery cycling of the pristine dendrimer electrolytes, the cells were assembled with a mixture (by volume) containing 50% ethylene carbonate (EC)–dimethyl carbonate (DMC) (EC:DMC = 1:1 by v/v) and 50% of G1–COOR (G1–CN) and LiPF6. G1–COOR–EC–DMC–LiPF6 (as well as G1–COOR–EC–DMC–LiPF6) exhibited a voltage stability of 3 V with stainless steel (as working electrode) and lithium foil (Aldrich) as the counter and reference electrodes (Fig. S5†). The lithium metal is passivated even better in the case of G1–COOR–EC–DMC (or G1–CN–EC–DMC) compared to the pristine dendrimers. No significant change in the interface resistance is observed in the case of the ternary mixture G1–COOR–EC–DMC (and G1–CN–EC–DMC) (Fig. 5c). This strongly suggests that the G1 dendrimers with further chemical design modifications (leading to lower viscosity) can be employed as both alternative electrolytes and electrolyte additives in conventional liquid electrolytes. With regard to the latter issue, there have been a few interesting reports on boron-based additives31 aimed at stabilizing both the cathode/anode|electrolyte interfaces. While the boron-based additives aid in electron transport, the present dendrimers aid in ion conductivity. Hence, to the best of our knowledge the PETIM dendrimers are the first of their kind where the additive stabilizes the electrode|electrolyte interface via promotion of ion transport.
Fig. 5d represents the galvanostatic cycling performance of G1–CN–EC–DMC–LiPF6 and 50% G1–COOR–EC–DMC–LiPF6 with graphite as working electrode and lithium metal as reference and counter electrodes, respectively. The charge and discharge cycling were done at a constant current rate of C/10 over a 0–2.5 V voltage range for the dendrimers. In Fig. 5b, the first discharge curve shows two distinct reductive plateaux in the ranges 0.5–0.8 V and 0.9–1.5 V corresponding to reductive degradation of EC solvent (SEI formation) via single and double reduction processes,32 which vanish on further cycling in the lithium insertion process. The broad plateau at 0.5–0.8 V signifies decomposition of the G1–CN molecule at the graphite surface. The charge plateau appears at 0.18 V corresponding to lithium de-insertion processes. The appearance of reductive and oxidative peaks agrees with the cyclic voltammetry results (ESI Fig. S6†). G1–CN–EC–DMC–LiPF6 shows a 1st discharge capacity of 400 mA h g−1 which decreases to 330 mA h g−1 in the 2nd cycle. In the 30th cycle, the capacity stabilized at 150 mA h g−1. The 1st charge capacity is equal to 354 mA h g−1 and this stabilized to 148 mA h g−1 in the 30th cycle. Coulombic efficiency increases from 88% (1st cycle) to 89% (5th cycle) and stabilized at 99% in the 30th cycle. The low coulombic efficiency in the 1st cycle is a consequence of irreversible capacity loss during the formation of the SEI film, which stabilizes over successive cycling leading to higher coulombic efficiency over successive cycles. Similar cycling behavior for ternary G1–COOR–EC–DMC–LiPF6 is observed except that the additional plateau at 0.9–1.5 V is absent in this case. The disappearance of this reductive plateau at 0.9–1.5 V indicates lesser decomposition of EC (suppression of the two-electron transfer process of EC)32 and better stability of the G1–COOR dendrimer at the graphite electrode surface (clear from cyclic voltammetry in Fig. S5†). The G1–COOR–EC–DMC–LiPF6 specific capacity in the 1st discharge cycle is 453 mA h g−1 which decreases to 325 mA h g−1 in the 2nd cycle. In the 30th cycle, the capacity stabilized at 160 mA h g−1. The 1st charge capacity is 359 mA h g−1 and stabilized at 153 mA h g−1 in the 30th cycle. Coulombic efficiency increases from 79% (1st cycle) to 85% (5th cycle) and eventually stabilized at 96% in the 30th cycle. Thus, the ternary dendrimer electrolyte can be successfully cycled with a graphite electrode and may hold promise in lithium battery applications.
Conclusion
In conclusion, we have demonstrated here a novel dendrimer–salt based ion conductor with high ion transference for prospective applications as an electrolyte in diverse devices such as rechargeable batteries, sensors and actuators. The transference number achieved here is the highest reported so far in dendrimers and polymer electrolytes. We have comprehensively demonstrated for the first time that ion conductivity and transference number can be manipulated by varying the chemical nature of the dendrimer peripheral group. The chemical nature of the peripheral group completely determines the solvation, i.e. quantum of free charge carriers, the mobility of the free charge carriers and the electrochemical properties. It is interesting to note that changes in peripheral chemical functional groups which affect the viscosity of the solution do not at all influence the cation diffusivity. We anticipate similar observations for other alkali ions provided the anion remains the same or bulkier than the PF6− anion. In the case of other monovalent cations (K+, Rb+, Cs+), factors specific to the metal ions need to be considered to achieve similar trends in ion transport in dendrimer electrolytes. Given the advancements in polymer processing, it is strongly proposed that similar strategies as discussed here can also be adopted in designing novel solid polymers with a variety of metal salt single-ion conducting polymer electrolytes.Acknowledgements
SS and RBJ acknowledge the University Grants Commission (UGC) for a Senior Research Fellowship and Council for Scientific and Industrial Research (CSIR), New Delhi for a Research Associate position. AJB also acknowledges the DST Nano Mission, New Delhi for research funding. SS, RBJ and AJB acknowledge Prof. N. Jayaraman, Organic Chemistry, Indian Institute of Science for useful discussions. We wish to acknowledge Prof. S. Bose, Materials Engineering, Indian Institute of Science, Bangalore, for providing Rheometer (TA instrument) facility.References
- J. B. Goodenough and K. S. Park, J. Am. Chem. Soc., 2013, 135, 1167–1176 CrossRef CAS PubMed.
- J. M. Tarascon and M. Armand, Nature, 2001, 414, 359–367 CrossRef CAS PubMed.
- J. Kalhoff, G. G. Eshetu, D. Bresser and S. Passerini, ChemSusChem, 2015, 8, 2154–2175 CrossRef CAS PubMed.
- C. Berthier, W. Gorecki, M. Minier, M. Armand, J. M. Chabagno and P. Rigaud, Solid State Ionics, 1983, 11, 91–95 CrossRef CAS.
- D. R. Macfarlane, J. Huang and M. Forsyth, Adv. Mater., 2001, 139, 57–96 Search PubMed.
- P. G. Bruce, B. Scrosati and J. M. Tarascon, Angew. Chem., Int. Ed., 2008, 47, 2930–2946 CrossRef CAS PubMed.
- M. A. Ratner and D. F. Shriver, Chem. Rev., 1988, 88, 109–124 CrossRef CAS.
- (a) R. Bouchet, S. Maria, R. Meziane, A. Aboulaich, L. Lienafa, J. P. Bonnet, T. N. T. Phan, D. Bertin, D. Gigmes, D. Devaux, R. Denoyel and M. Armand, Nat. Mater., 2013, 12, 452–457 CrossRef CAS PubMed; (b) P. P. Mukherjee, C. Y. Wanga and Q. Kang, Electrochim. Acta, 2009, 54, 6861–6875 CrossRef CAS; (c) S. Imaizumi, Y. Kato, H. Kokubo and M. Watanabe, J. Phys. Chem. B, 2012, 116, 5080–5089 CrossRef CAS PubMed.
- M. J. Madou and S. R. Morrison, Chemical Sensing with Solid State Devices, United Kingdom, 1989 Search PubMed.
- (a) J. L. Schaefer, D. A. Yanga and L. A. Archer, Chem. Mater., 2013, 25, 834–839 CrossRef CAS; (b) N. Boaretto, A. Bittner, C. Brinkmann, B. E. Olsowski, J. Schulz, M. Seyfried, K. Vezzu, M. Popall and V. D. Noto, Chem. Mater., 2014, 26, 6339–6350 CrossRef CAS; (c) A. Ghosh, C. Wang and P. Kofinasb, J. Electrochem. Soc., 2010, 157, A846–A849 CrossRef CAS.
- (a) K. Hayamizu, Y. Aihara and W. S. Price, J. Chem. Phys., 2000, 113, 4785–4793 CrossRef CAS; (b) M. Doyle, T. F. Fuller and J. Newman, Electrochim. Acta, 1994, 39, 2073–2081 CrossRef CAS; (c) K. E. Thomas, S. E. Sloop, J. B. Kerr and J. Newman, J. Power Sources, 2000, 89, 132–138 CrossRef CAS.
- (a) K. Inoue, Prog. Polym. Sci., 2000, 25, 453–571 CrossRef CAS; (b) U. P. Thankappan, S. N. Madhusudana, A. Desai, G. Jayamurugan, Y. B. R. D. Rajesh and N. Jayaraman, Bioconjugate Chem., 2011, 22, 115–119 CrossRef CAS PubMed; (c) Z. Wang, M. Ikeda, N. Hirata, M. Kubo, T. Itoh and O. Yamamoto, J. Electrochem. Soc., 1999, 146, 2209–2215 CrossRef CAS; (d) C. S. Harris, M. A. Ratner and D. F. Shriver, Macromolecules, 1987, 20, 1778–1781 CrossRef CAS; (e) A. Gong, C. Liu, Y. Chen, C. Chen and F. Xi, Polymer, 2000, 41, 6103–6111 CrossRef CAS.
- (a) V. D. Noto, M. Piga, G. A. Giffin, K. Vezzu and T. A. Zawodzinski, J. Am. Chem. Soc., 2012, 134, 19099–19107 CrossRef PubMed; (b) V. D. Noto, N. Boaretto, E. Negro, P. E. Stallworth, S. Lavina, G. A. Giffin and S. G. Greenbaum, Int. J. Hydrogen Energy, 2012, 37, 6215–6227 CrossRef.
- (a) U. Boas and P. M. H. Heegard, Chem. Soc. Rev., 2004, 33, 43–63 RSC; (b) K. E. Broaders, S. Grandhe and J. M. J. Fréchet, J. Am. Chem. Soc., 2011, 133, 756–759 CrossRef CAS PubMed; (c) J. S. Moore, Acc. Chem. Res., 1997, 30, 402–413 CrossRef CAS; (d) M. Garzoni, N. Cheval, A. Fahmi, A. Danani and G. M. Pavan, J. Am. Chem. Soc., 2012, 134, 3349–3357 CrossRef CAS PubMed; (e) D. A. Tomalia, Soft Matter, 2010, 6, 456–474 RSC; (f) J. Hu, T. Xu and Y. Cheng, Chem. Rev., 2012, 112, 3856–3891 CrossRef CAS PubMed.
- (a) E. A. Dillon and D. F. Shriver, Chem. Mater., 2001, 13, 1369–1373 CrossRef; (b) H. Aydn, M. Şenel and A. Bozkurt, Solid State Ionics, 2012, 226, 1–6 CrossRef; (c) M. Li, X. Yang, X. Liu and X. Wang, J. Appl. Polym. Sci., 2006, 101, 317–322 CrossRef CAS; (d) S. Das, B. R. Suresh, N. Jayaraman and A. J. Bhattacharyya, J. Polym. Res., 2012, 19, 9924 CrossRef.
- (a) E. Staunton, Y. G. Andreev and P. G. Bruce, Faraday Discuss., 2007, 134, 143–156 RSC; (b) J. Maier, Nat. Mater., 2005, 4, 805–815 CrossRef CAS PubMed; (c) S. C. Mullin, G. M. Stone, A. Panday and N. P. Balsara, J. Electrochem. Soc., 2011, 158, A619–A627 CrossRef CAS.
- (a) G. Jo, H. Ahn and M. J. Park, ACS Macro Lett., 2013, 2, 990–995 CrossRef CAS; (b) A. Chiappone, S. Jeremias, R. Bongiovanni and M. Schönhoff, Polym. Phys., 2013, 51, 1571–1580 CAS; (c) B. H. Susan, A. Kaneko, A. Noda and M. Watanabe, J. Am. Chem. Soc., 2005, 127, 4976–4983 CrossRef PubMed; (d) D. F. Miranda, C. Versek, M. T. Tuominen, T. P. Russell and J. J. Watkins, Macromolecules, 2013, 46, 9313–9323 CrossRef CAS; (e) M. Kunze, Y. Karatas, H. D. Wiemhofer, H. Eckerta and M. Schonhoff, Phys. Chem. Chem. Phys., 2010, 12, 6844–6851 RSC; (f) Y. Saito, M. Okano, T. Sakai and T. Kamada, J. Phys. Chem. C, 2014, 118, 6064–6068 CrossRef CAS.
- (a) J. Read, J. Electrochem. Soc., 2006, 153, A96–100 CrossRef CAS; (b) M. Galiόnski, L. Andrzej and I. Stepniak, Electrochim. Acta, 2006, 51, 5567–5580 CrossRef; (c) C. O. Laoire, S. Mukerjee, E. J. Plichta, M. A. Hendrickson and K. M. Abraham, J. Electrochem. Soc., 2011, 158, A302–308 CrossRef CAS; (d) K. Xua and C. A. Angell, J. Electrochem. Soc., 2002, 149, A920–926 CrossRef.
- (a) E. Tsuchida, N. Kobayashi and H. Ohno, Macromolecules, 1988, 21, 96–100 CrossRef CAS; (b) D. R. Sadoway, B. Huang, P. E. Trapa, P. P. Soo, P. Banerjee and A. M. Mayes, J. Power Sources, 2001, 97–98, 621–623 CrossRef CAS.
- (a) F. Bertasi, E. Negro, K. Vezzù, G. Nawna, G. Pagot and V. D. Noto, Electrochim. Acta, 2015, 175, 113–123 CrossRef CAS; (b) F. Bertasi, E. Negro, K. Vezzù and V. D. Noto, Int. J. Hydrogen Energy, 2014, 39, 2896–2903 CrossRef CAS.
- B. C. Smith, Infrared Spectral Interpretation: A Systematic Approach, United States of America, 1998 Search PubMed.
- (a) C. M. Burba and R. Frech, J. Phys. Chem. B, 2005, 109, 15161–15164 CrossRef CAS PubMed; (b) R. A. Nazri, G. A. Nazri, A. J. Camargo and M. Trisc, J. Solution Chem., 2000, 29, 1047–1060 CrossRef; (c) I. S. Perelygin, M. A. Klimchuk, L. V. Rabchuk and L. V. Chaukina, Russ. J. Phys. Chem., 1994, 68, 44 Search PubMed.
- H. Zhu, U. Rana, V. Ranganathan, J. Jin, L. A. O'Dell, D. R. MacFarlane and M. Forsyth, J. Mater. Chem. A, 2014, 2, 681–691 Search PubMed.
- (a) K. Hayamizu, Y. Aihara and W. S. Price, Electrochim. Acta, 2001, 46, 1475–1485 CrossRef CAS; (b) C. Capiglia, Y. Saito, H. Yamamoto, H. Kageyama and P. Mustarelli, Electrochim. Acta, 2000, 45, 1341–1345 CrossRef CAS.
- (a) M. B. Armand, P. G. Bruce, M. Forsyth, B. Scrosati and W. Wieczorek, Polymer Electrolytes, in Energy Materials, ed. D. W. Bruce, D. O'Hare and R. I. Walton, John Wiley & Sons, Ltd, Chichester, UK, 2011 Search PubMed; (b) K. Hayamizu, Y. Aihara, S. Arai and C. G. Martinez, J. Phys. Chem. B, 1999, 103, 519–524 CrossRef PubMed; (c) B. Fritzinger and U. S. Macromol, Chem. Phys., 2005, 206, 1288–1291 CAS.
- (a) J. Maier, J. Phys. Chem. Solids, 1985, 46, 309–320 CrossRef CAS; (b) J. Maier, Solid State Ionics, 1987, 23, 59–67 CrossRef CAS; (c) J. Maier, Mater. Res. Bull., 1985, 20, 383–392 CrossRef CAS.
- (a) C. C. Liang, J. Electrochem. Soc., 1973, 120, 1289–1292 CrossRef CAS; (b) J. Maier, Prog. Solid State Chem., 1995, 23, 171–263 CrossRef CAS; (c) H. Yamada, A. J. Bhattacharyya and J. Maier, Adv. Funct. Mater., 2006, 16, 525–530 CrossRef CAS; (d) J. Maier and B. Reichert, Ber. Bunsen-Ges. Phys. Chem., 1986, 90, 666–670 CrossRef CAS.
- (a) A. J. Bhattacharyya and J. Maier, Adv. Mater., 2004, 16, 811–814 CrossRef CAS; (b) A. J. Bhattacharyya, J. Fleig, G. Y. Guo and J. Maier, Adv. Mater., 2005, 17, 2630–2634 CrossRef CAS.
- (a) S. K. Das and A. J. Bhattacharyya, J. Phys. Chem. C, 2009, 113, 6699–6705 CrossRef CAS; (b) N. Kaskhedikar, Y. Karatas, G. Cui, J. Maiera and H. D. Wiemhofer, J. Mater. Chem., 2011, 21, 11838–11843 RSC.
- J. Evans, C. Vincent and P. G. Bruce, Polymer, 1987, 28, 2324–2328 CrossRef CAS.
- Y. Qin, Z. Chen, H. S. Lee, X. Q. Yang and K. Amine, J. Phys. Chem. C, 2010, 114, 15202–15206 CAS.
- (a) S. D. Xu, O. C. Zhuang, J. Wang, Y. Q. Xu and Y. B. Zhu, Int. J. Electrochem. Sci., 2013, 8, 8058–8076 CAS; (b) C. Liu, X. Maa, F. Xu, L. Zheng, H. Zhang, W. Feng, X. Huang, M. Armand, I. Nie, H. Chen and Z. Zhou, Electrochim. Acta, 2014, 149, 370–385 CrossRef CAS.
Footnote |
| † Electronic supplementary information (ESI) available. See DOI: 10.1039/c5sc04584c |
| This journal is © The Royal Society of Chemistry 2016 |