
Beyond academic tracking: using cluster analysis and self-organizing maps to investigate secondary students' chemistry self-concept†
Sara E.
Nielsen
and
Ellen J.
Yezierski
*
Department of Chemistry & Biochemistry, Miami University, Ohio, USA. E-mail: yeziere@miamioh.edu
First published on 9th May 2016
Abstract
Academic tracking, placing students in different classes based on past performance, is a common feature of the American secondary school system. A longitudinal study of secondary students' chemistry self-concept scores was conducted, and one feature of the study was the presence of academic tracking. Though academic tracking is one way to group data for analysis, since students are naturally grouped in their classes, we aimed to uncover other groupings characterized by their self-concept scores. A cluster analysis was performed using scores from the chemistry and mathematics subscales of the chemistry self-concept inventory. The analysis yielded five clusters, four of which demonstrate a positive relationship between chemistry and mathematics self-concept scores. One cluster, however, was composed of students with low chemistry self-concept scores and high mathematics self-concept scores. Self-Organizing Maps (SOMs), new to chemistry education research (CER), were used to identify smaller groupings of students within the clusters to better understand students' self-concept. This technique was also used to explore longitudinal trends in students' chemistry self-concept data. This work has important implications for tracking in chemistry, the value of considering the affective characteristics of chemistry students, and the prospect of SOMs as a new CER tool.
Introduction
Researchers who work in education settings have long understood the importance of students' attitudes and beliefs, often referred to as the affective domain. Literature by Novak (1993), Marsh et al. (1981), Shavelson et al. (1976), Rosenberg (1965), Byrne (1986), Bandura (1977), and Bong and Skaalvik (2003) describe how the affective domain relates to students' academic performance. Though much of the research on the affective domain has focused on general academic studies, there is a growing body of work that examines the affective domain in chemistry contexts. Chemistry education researchers have studied a variety of self-related affective constructs including students' expectations (e.g.Grove and Bretz, 2007; Galloway and Bretz, 2015), attitudes (e.g.Dalgety et al., 2003; Barbera et al., 2008; Bauer, 2008;), self-efficacy (e.g.Villafane et al., 2014; Ferrell and Barbera, 2015), and self-concept (e.g.Bauer, 2005; Nieswandt, 2007; Lewis et al., 2009; Shaw et al., 2010).The differences between the various self-related affective constructs are important to consider in light of accurate measurement (i.e., how subtle differences in the wording of items on instruments can influence the construct being measured). Attitudes are an evaluative judgement about an object (Fazio, 2007). Objects can be broadly defined, and the subject of chemistry can be considered an object about which students have attitudes. Self-efficacy is a psychological construct that describes a person's belief about his/her ability to complete a certain task or achieve a goal (Bandura, 1977; Bong and Skaalvik, 2003). It is inherently future-focused, as self-efficacy judgements require people to judge what they believe they will be able to do. Chemistry self-efficacy studies often refer to students' evaluations of their ability to do such things as solve chemistry problems and understand chemical concepts (Barbera et al., 2008). Self-concept is a construct that describes a person's perceptions of his/her self (Marsh et al., 1981; Shavelson and Bolus, 1982; Bong and Skaalvik, 2003). This perception is domain-specific and can be more specifically defined as a person's belief about his/her abilities in a given domain, such as chemistry. Chemistry self-concept studies have found that chemistry self-concept is a construct that is correlated with, and even helps predict, student achievement in chemistry (Bauer, 2005; Nieswandt, 2007; Lewis et al., 2009). Other studies on academic environments and other STEM disciplines have shown a relationship between students' self-concept and students' motivation (e.g.Bong and Clark, 1999; Preckel et al., 2008).
Research linking self-concept to achievement and self-concept to motivation underscore the importance of understanding students' beliefs about their abilities in chemistry. Research on self-concept in adolescents demonstrates that self-concept is a predictor of future course selection (Marsh and Yeung, 1997). Much of the chemistry education research that investigates chemistry self-concept is focused on college students. However, if secondary students have low chemistry self-concept, research suggests that they may not take chemistry classes in college. Thus, it is important to understand the characteristics of secondary chemistry students, especially the affective domain, to begin to understand why some students decide to study chemistry and some do not. Though secondary students' science and mathematics achievement are often studied, very little research on their chemistry self-concept has been conducted. The intent of this study is to characterize secondary students' chemistry self-concept to generate implications that may improve retention and achievement in secondary chemistry and beyond.
We evaluated the validity and reliability of the data produced by the Chemistry Self-Concept Inventory (CSCI; Bauer, 2005) when used with secondary chemistry students (Nielsen and Yezierski, 2015). The results from Nielsen and Yezierski (2015) suggested a six factor structure for the data. The six resulting subscales are (1) Chemistry; (2) Mathematics; (3) Academic Capability; (4) Academic Enjoyment; (5) Positive Problem Solving; and (6) Negative Problem Solving. Each subscale produced satisfactory internal consistency values and all subscales were positively correlated with one another. Though self-concept has been shown to be stable in the college population (Bauer, 2005), we aimed to characterize the progression of self-concept in secondary students as they gain experience with chemistry throughout the academic year.
Studying students' chemistry self-concept at one point in time can be easily accomplished. More difficult, however, is to track trends in self-concept data through time, especially on a student-by-student basis. A repeated-measures analysis of variance may tell you that there is very little change, but that may be caused by some scores decreasing while others increase. Cluster analysis was used to group students by their CSCI responses and understand their beliefs about their abilities. To more precisely track how self-concept scores progress over time, a technique known as Self-Organizing Maps (SOMs; Kohonen, 1982) was used. These maps aggregate and display data in a way that allows small groups of students with similar response patterns to be tracked across multiple time points revealing trends that may not have been apparent from other coarser analyses. Another use of SOMs is visualizing characteristics of groups such as clusters. This allows analysis of large groups in more detail.
Research questions
The essential questions guiding this study were(1) How can we use cluster analysis and Self-Organizing Maps to characterize secondary students' chemistry self-concept scores at one point in time?
(2) What longitudinal trends do we observe in secondary chemistry students' chemistry self-concept scores?
Methods
Design and sample
Approval for the study was granted by the Institutional Review Board prior to participant recruitment and data collection. Parental/guardian consent and student assent were obtained for all participating students, and the teachers and principals involved also consented to participate in the study.The data pre sented herein come from a longitudinal, repeated-measures study conducted in secondary chemistry classrooms. The study was designed to span an academic year, and two data collection cycles occurred over consecutive academic years. The study incorporated eight full-time teachers, four student teachers, and 515 students. More teacher characteristics and school demographics may be found in Appendix 1 (ESI†). Each data collection cycle was comprised of six rounds of self-concept data collected at six time points throughout the academic year, with approximately six weeks between administrations. While the stability of academic self-concept has been noted in prior studies (e.g.Shavelson et al., 1976), the prior work in the chemistry education literature provides limited information on the stability of students' chemistry self-concept. Previous studies on students' chemistry self-concept only assess it after the midpoint of the first semester. We chose to measure chemistry self-concept multiple times to study its development throughout the academic year. One possible concern with the frequency of data collection is taxing the students and diminishing data quality. However, the dataset was frequently checked to ensure that obviously unreliable data (e.g., students not attending to negatively worded items) were not included in any analyses. Another possible concern is the amount of time required to administer the inventory, however the teachers reported that it only took around 10 minutes for the students to complete. One of the limitations of longitudinal studies in the secondary environment is intermittent student absences, which limits participation and decreases sample size. As such, the analyses reported here were conducted with a reduced sample size of 431 for the cluster analysis and 203 for the longitudinal analysis. The student data used in these analyses are the same data that was used for the analyses reported in Nielsen and Yezierski (2015).
An important observation regarding the structure of the American secondary school system is the presence of academic tracking. The secondary schools participating in our study all had multiple chemistry tracks or levels. Students are placed in different chemistry classes based on factors including their grades in previous science classes, interest in chemistry, and selection by their teacher. The four chemistry tracks included in this study are: (1) Advanced Placement Chemistry (N = 24; AP; College Board, 1995), (2) Honors Chemistry (N = 135; Hon), (3) College Prep Chemistry (N = 222; CP), and (4) Chemistry in the Community (N = 50; Com; Powers, 2011). The students in Advanced Placement Chemistry are taking a second full-year chemistry course, while the students in the other courses are taking their first full-year chemistry course. Chemistry in the Community is a curriculum designed for students who are less interested in pursuing a career in the sciences. Both the Honors and the College Prep classes are based on a more traditional chemistry curriculum, with the main difference between the two being the faster pace of the Honors class. A description of each teacher and the track(s) they taught is in Appendix 1 (ESI†). While tracking may be a useful way for schools and teachers to group students, the class assignments do not specifically account for factors such as student beliefs. As researchers we wanted to investigate alternative student groupings, which was the basis for using self-concept data in our cluster analysis.
Instrument
The instrument that is the focus of the current analyses is the Chemistry Self-Concept Inventory (CSCI). The CSCI can be obtained from the 2005 work by Bauer that detailed the construction of the instrument. A recent paper by Nielsen and Yezierski (2015) details the evidence for the validity and reliability of the data produced by the instrument in a secondary setting. The findings from the exploratory factor analysis provided information to guide which scales and items were appropriate to answer the questions posed in the present study. The CSCI contains 40 item statements, both positively and negatively worded, that students rate on a 1 to 7 Likert scale. Previous work has demonstrated that the instrument has 6 subscales, which are shown in Table 1.| Subscale (abbreviation) | Number of items |
|---|---|
| Chemistry (Ch) | 10 |
| Mathematics (M) | 10 |
| Academic Capability (AC) | 5 |
| Academic Enjoyment (AE) | 5 |
| Positive Problem Solving (PPS) | 5 |
| Negative Problem Solving (NPS) | 5 |
The items on the AC subscale prompt students to consider their aptitude at academic subjects and the items on the AE subscale prompt students to consider their enjoyment of academic subjects. The items on the problem solving subscales ask students to consider their creativity and originality when addressing problems. The items on the PPS subscale are all positively worded and the items on the NPS subscale are all negatively worded. Before any data analysis is undertaken all of the negatively worded items are reverse coded so that scores above 4 indicate higher self-concept and scores below 4 indicate lower self-concept.
When choosing data for our cluster analysis, we considered several things, including internal consistency, instrument context, and item order. The PPS and NPS subscales had lower internal consistency values as measured by Cronbach's α than the other four subscales (Nielsen and Yezierski, 2015). While Cronbach's α is affected by the number of items on the subscale (Tavakol and Dennick, 2011), other subscales with the same number of items had much higher α values, which suggests that the items within the subscales are leading to the lower values.
While the internal consistency data suggested the PPS and NPS subscales were not suitable for further analyses, these data did not facilitate the exclusion of the AC and AE subscales, as both demonstrated high internal consistency. Rather, considerations about how these scales may or may not represent academics in general informed our decision. Schwarz (1999) details the effect of context on the students' scores for self-report data. The CSCI was administered in a chemistry class, the students were briefed on the purpose of the study by a chemistry education researcher, and the instructions on the CSCI explicitly tell students to, “…report ways in which you related to academic issues pertinent to the study of chemistry.” This suggested that the overwhelming context for the students was chemistry, which may have influenced their responses to the ostensibly general statements about academics and problem solving. Our concern about the possible lack of independence of the scores on the AC, AE, PPS, and NPS subscales led us to exclude them from future analyses.
Once we had narrowed the list of variables to the Ch and M subscales we investigated the functioning of individual items. We found three items, items 8 and 12 on the Ch subscale and item 1 on the M subscale, that were not performing well. Items 1 and 12 both contain the wording “interesting and challenging.” As described in Clark and Watson (1995), items that assess multiple ideas may be difficult for subjects to interpret and answer. It is plausible to think that some students will not have identical beliefs about the concepts of “interesting” and “challenging” and how they relate to mathematics and chemistry. Some evidence that students may have had difficulties with these items is presented in Fig. 1 and 2. Students more often responded on the midpoint of the scale on items 1 and 12 than on other items on the Ch and M subscales. Fig. 1 and 2 compare the items assessing two ideas (1 and 12) with items only assessing one idea (25 and 40).
 | ||
| Fig. 1 Students' responses to mathematics self-concept items. | ||
 | ||
| Fig. 2 Students' responses to chemistry self-concept items. | ||
Item 8 was also investigated based on anecdotal evidence from a student who claimed that students do not engage in discussions with friends about chemical topics. The item profile, shown in Fig. 3, is similar to those of items 1 and 12, with more students responding on the midpoint of the scale, possibly indicating that students have difficulty responding to this item. Another source of evidence that supported the removal of items 1, 8, and 12 is the lower factor loadings these items had in comparison to the rest of the items on that subscale (Nielsen and Yezierski, 2015). Typical factor loading values for the items on the mathematics subscale ranged from 0.60–0.95. In contrast, the factor loading value for item 1 is 0.46. Item 1 also has a factor loading value of 0.37 on the AC subscale. Typical factor loading values for the chemistry subscale items ranged from 0.70–0.80. Item 8 had a value of 0.57 and item 12 had a value of 0.53. Furthermore, item 8 had a loading value of 0.31 on the PPS subscale and item 12 had a loading value of 0.31 on the AC subscale. A table of factor loadings for the items on the CSCI can be found in Nielsen and Yezierski (2015). Due to the problematic item wording, the midpoint-heavy item profiles, and the lower factor loading values we eliminated items 1, 8, and 12 from our analyses.
 | ||
| Fig. 3 Students' responses to Item 8 about discussions with friends about chemical topics. | ||
We subsequently recalculated the M and Ch subscales on a 1 to 7 scale by summing the scores of the remaining items and dividing by 9 and 8, respectively. This was done to ensure that both subscales could be compared to one another and so that neither scale was weighted more heavily in the cluster analysis. We chose to forego standardization of our variables in part because the standard deviations of the variables are similar.
One feature of the chemistry self-concept data that suggested that track was not the ideal grouping variable was the similarity in chemistry self-concept scores among some of the academic tracks, especially CP and Com. As described in Nielsen and Yezierski (2015), there was not a statistically significant difference in chemistry self-concept scores between the CP and Com students. Based on the factors that place the Com students in that track, an educator might predict that they would have lower chemistry self-concept scores than CP students. The data showed, however, that Com and CP students had similar scores, which suggested that a different method of grouping students would be more useful.
Cluster analysis
Previous work by Nielsen and Yezierski (2015) showed that some academic tracks have similar chemistry self-concept scores (e.g. CP and Com). Since the data suggest that the institutional tracking assignments do not strictly align with self-concept, our aim was to uncover groupings of students based on their beliefs. To do this we chose to use hierarchical cluster analysis (HCA), with students' chemistry and mathematics self-concept scores as the clustering variables. The methodological considerations about the how to conduct the cluster analysis were informed by general cluster analysis resources (e.g.Everitt et al., 2011) as well as previous cluster analyses conducted by chemistry education researchers (Chan and Bauer, 2014; Raker and Holme, 2014; Galloway and Bretz, 2015).The first decision to be made was the type of cluster analysis to be performed. We chose HCA over k-means analysis as we had no a priori hypotheses about the number of clusters in our sample. Hierarchical agglomerative clustering was used to group the data, with Ward's method as the linkage method. Agglomerative clustering procedures begin with as many clusters as data points and combine them into larger clusters from there. Once two clusters have been combined the grouping is irrevocable. As such, the linkage method should be chosen carefully. Ward's method links groups by minimizing the sum of squares within each group. This lessens variation within each cluster and increases variation between clusters. Squared Euclidean distance represents the physical distance between data points in Euclidean space and is often used with data that can be considered continuous.
The number of clusters was determined by analyzing the agglomeration schedule, the dendrogram, and the differences among the clusters. The agglomeration schedule shows the differences in the sum of squares distances at the point of combination between each clustering step, and can be found in Appendix 1 (ESI†). A change in the magnitude of the distances suggests the number of clusters that may best describe the data. The dendrogram is a visual representation of each step of the clustering, and can also be found in Appendix 1 (ESI†). To determine the best number of clusters one “cuts” the dendrogram such that the change in distance between clusters when combining them is minimal below the cut and large above the cut (Everitt et al., 2011). Statistical measures indicating the differences among the clusters are described below. The cluster analysis was conducted in SPSS version 22. Differences in Ch and M self-concept scores among the clusters were evaluated with a Mann–Whitney U test, and student groupings identified by the cluster analysis were compared to groupings by academic track with a chi-square analysis.
Self-organizing maps
To characterize the data more thoroughly, we needed to examine trends within smaller groups of students than clusters. As such we used Self-Organizing Maps (SOMs). Developed by Teuvo Kohonen (1982), SOMs were based on research in neural networks. The output from this technique is a map, a topographical representation of the data. SOMs are created through a “learning” algorithm, an iterative process that forms small groups of data based on the similarity of the data on multiple variables, and arranges the groups on a surface such that groups with similar characteristics are near one another on the map and groups with different characteristics are far from one another on the map. The map is constructed as an empty grid of nodes, each with a random vector in n-dimensional space, where n is the number of input variables. The dataset is converted into n-dimensional vectors, and a vector created from a data point is placed in the node it best matches. The vector in that node, and those in the surrounding nodes, are adjusted in accordance with the new data. As more data points (in the form of vectors) are added, the vectors are assigned to the nodes with which they are most similar. If no data vector is most similar to a node on the map, that node will be left empty. In their final form the nodes represent small groups of data.SOMs have been used in a variety of fields including finance (Kiviluoto and Bergius, 1998), computer learning (Kohonen, 2001), ecology (Lek and Guegan, 1999), biology (Tamayo et al., 1999), and chemistry (Marco et al., 1998) to organize, reduce, and analyze data. To our knowledge, this technique has yet to be used in chemistry education research. The purpose of using SOMs with our dataset is to examine our cluster solution in greater detail as well as uncover trends in longitudinal self-concept data. All SOM analyses were conducted in R (R Core Team, 2015), using the Kohonen package (Wehrens and Buydens, 2007).
One factor that is important to note when examining SOMs is that they are, in fact, maps. This means that, unlike graphs, the vertical and horizontal arrangement has no set meaning. Furthermore, as many SOMs have more than two variables, using a two-dimensional system to describe the location of nodes does not work. There are two main types of SOMs – unsupervised and supervised maps (Kohonen, 2001). Supervised maps use a categorical variable to restrict the continuous input data to certain areas of the map. This allows the researcher to better visualize features of categorical classifications. In our study we used cluster as a supervising variable for a set of SOMs. The continuous data were students' chemistry and mathematics self-concept scores. The arrangement of the continuous data in an unsupervised map is determined solely by the similarities in the data. SOMs were also used for the longitudinal analysis of the data to address research question 2. In this case, the data used were students' chemistry self-concept scores at all six time points. The SOM algorithm performed the following steps. First the data were transformed into six dimensional vectors, with each dimension representing students' chemistry self-concept at one round of the data collection. The grid of nodes was constructed, with the number of nodes chosen largely based on sample size. Each node contained a randomly oriented vector in six-dimensional space. Student data, converted into vectors, were then introduced to the map. Each data point was matched with the most similar vector, and the map was updated each time a new data point was added. This allows similar nodes to be located near each other on the map. Since there was no logical supervisor for the longitudinal SOM, we chose to create an unsupervised map.
One of the most useful characteristics of SOMs is their versatility. The use of SOMs in varied fields demonstrates their flexibility for a variety of analyses. In this manuscript we outline how we employed and interpreted the SOMs that we created for our analyses. More description of best practices in creating SOMs can be found in Kohonen (2001) and Deboeck (1998).
Results and discussion
The results of the cluster analysis suggested a five cluster solution. Fig. 4 shows the distribution of students based on their chemistry and mathematics self-concept subscale scores. Table 2 displays the means and standard deviations for the Ch and M subscale scores for each cluster. A Mann–Whitney U test, with a Holm Sequential Bonferroni correction to control the familywise error rate among groups, was performed to analyze the differences among the clusters. Three statistically significantly different classifications for chemistry self-concept scores and four statistically significantly different classifications for mathematics self-concept scores were found. We describe the three Ch classifications as low, medium (Med), and high scores, and the four M classifications as low, med, high, and very high scores. Table 3 contains the N for each cluster, as well as its Ch and M classification. | ||
| Fig. 4 Cluster membership based on chemistry and mathematics self-concept scores. | ||
| Cluster | |||||
|---|---|---|---|---|---|
| C1 | C2 | C3 | C4 | C5 | |
| Ch mean ± SD | 4.3 ± 0.3 | 5.7 ± 0.6 | 4.5 ± 0.7 | 2.7 ± 0.8 | 2.7 ± 0.7 |
| M mean ± SD | 5.5 ± 0.7 | 6.1 ± 0.6 | 3.9 ± 0.6 | 2.7 ± 1.0 | 5.5 ± 0.8 |
In previous work by Nielsen and Yezierski (2015), we found that chemistry and mathematics self-concept scores are positively correlated. However, the distribution of students' mathematics self-concept scores is positively skewed, meaning that the distribution tends to have greater numbers of high scores. This helps explain the four classifications for mathematics self-concept scores, as well as the profile of cluster 1. What we see in the profiles for clusters 1 through 4 is a positive correlation between chemistry and mathematics self-concept scores. If we use cluster 4 as an example, we see that students with low chemistry self-concept scores also have low mathematics self-concept scores. Cluster 5, however, does not follow the same chemistry and mathematics self-concept relationship. Students in cluster 5 have high mathematics self-concept scores but low chemistry self-concept scores. As can be seen in Table 3, this cluster comprises 16.5% of our sample or 71 students. The presence of this group of students in our sample led us to more closely examine the composition of the clusters.
| Cluster | N | Chemistry classification | Math classification |
|---|---|---|---|
| C1 | 109 | Medium | High |
| C2 | 110 | High | Very high |
| C3 | 80 | Medium | Medium |
| C4 | 61 | Low | Low |
| C5 | 71 | Low | High |
One way of characterizing the students in each cluster is by their academic track. To determine if the distribution of students by academic track in each cluster was significantly different than the distribution by academic track in the overall sample we performed a χ2 analysis. The expected proportions seen in Table 4 are based on the proportion of students in each academic track in the overall sample applied to each cluster. The observed proportions seen in Table 4 are the actual proportion of students within each academic track for each cluster. Table 5 shows the χ2 values for each cluster. One feature to note is the small expected counts of AP students in clusters 4 and 5. While the suggested minimum expected count in each cell of a χ2 test is 5, recent literature by Campbell (2007) describes the minimum as arbitrary and demonstrates that values greater than or equal to 1 are sufficient.
| C1 | C2 | C3 | C4 | C5 | ||
|---|---|---|---|---|---|---|
| N = 109 | N = 110 | N = 80 | N = 61 | N = 71 | ||
| AP | Expected | 0.055 | 0.055 | 0.055 | 0.055 | 0.055 |
| Observed | 0.028 | 0.145 | 0.013 | 0.016 | 0.042 | |
| Honors | Expected | 0.312 | 0.312 | 0.312 | 0.312 | 0.312 |
| Observed | 0.330 | 0.464 | 0.213 | 0.180 | 0.282 | |
| CP | Expected | 0.514 | 0.514 | 0.514 | 0.514 | 0.514 |
| Observed | 0.532 | 0.364 | 0.525 | 0.656 | 0.592 | |
| Com | Expected | 0.119 | 0.119 | 0.119 | 0.119 | 0.119 |
| Observed | 0.110 | 0.027 | 0.250 | 0.148 | 0.085 | |
The significant χ2 test for clusters 2 and 3 indicates that the distribution of students by academic track in those clusters differs from the distribution by academic track in the overall sample. While it is not possible to conduct post-hoc tests to determine which academic tracks differ significantly between the overall sample and the cluster, cluster 2 has higher numbers of AP and Hon students and lower numbers of CP and Com students than expected. Cluster 3 has fewer AP and Hon students and more Com students than expected based on the distribution of students by track in the sample. As previously shown in Nielsen and Yezierski (2015), AP and Hon students have higher chemistry and mathematics self-concept scores as compared to CP and Com students. The overrepresentation of some tracks and underrepresentation of others in clusters 2 and 3 aligns with those findings. However, the nonsignificant χ2 results for clusters 1, 4, and 5 indicate that the membership of those clusters is not based on the academic track of the students. This is especially interesting when we consider the Low Ch/High M group, cluster 5. We observe that there are sizeable numbers of AP and Hon students (groups that in other analyses have high chemistry self-concept) in a cluster partly characterized by low chemistry self-concept scores. These results indicate that, while academic tracking can be a useful grouping feature for analyzing data, a measure of the affective domain yields different student groupings. This is consistent with the results shown in Nielsen and Yezierski (2015) that suggest frame of reference effects, among other factors, may play a role in students' self-concept scores.
When considering the presence of cluster 5, the students with low chemistry self-concept but high mathematics self-concept, it is interesting that there is no cluster that has the opposite profile, students with high chemistry self-concept but low mathematics self-concept.
Students with high chemistry self-concept but low mathematics self-concept. We can see from Fig. 4 that there are some students in cluster 3 that might fit that profile, but it seems the cluster analysis was not sensitive enough to group those students separately from the others. This is a limitation of searching for a few large groups of students in the data. However, it is not feasible to examine each student individually, nor does that allow trends in the data to be seen. As we considered the profiles of groups of students identified by the cluster analysis and found clusters with dissimilar self-concept scores, we opted for a more fine-grained grouping strategy – SOMs.
We used a supervised SOM for the finer-grained analysis of our cluster solution, with cluster as the supervising variable and chemistry and mathematics self-concept scores as the continuous input variables. We used an unsupervised SOM for the longitudinal analysis of students' chemistry self-concept scores as there was no logical supervising variable.
Visually, SOMs are a grid of nodes (often represented as circles or hexagons; see Fig. 5). The nodes are small groups of data, representing one or more data points. In our analysis, each data point is a student, so each node in our SOMs represents a small group of students. While it is possible to represent the nodes as hexagons in some maps, we chose to only represent nodes as circles so that the shape is consistent across the analyses. For each SOM analysis there are several different maps required to interpret the data. All maps that are created for a single analysis have the same students in each node (small group of students). This allows comparison across maps, as the students in the upper left node of one map (for example) are the same students in the upper left node of another map.
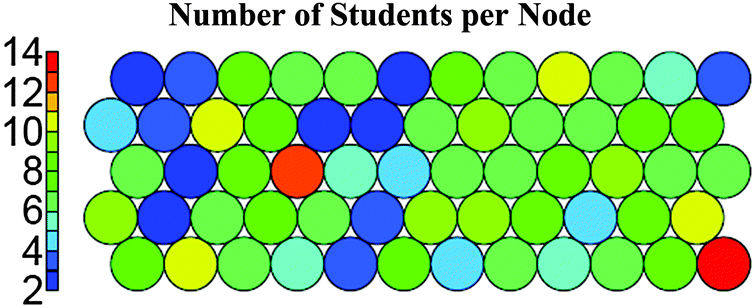 | ||
| Fig. 5 Self-organizing “heat” map showing number of students in each node. Cluster number was supervising variable and measures used to create map were chemistry and mathematics self-concept scores. | ||
To determine the number of nodes in the map, the researcher should consider the intent of the analysis (Deboeck, 1998). Maps with fewer nodes lead to larger numbers of data points per node, while maps with more nodes lead to fewer numbers of data points per node. Nodes with fewer data points allow for finer-grained analyses, which was our purpose for creating the SOMs. While there are no strict guidelines as to the best number of data points per node, nodes with no data points should be avoided (Oh et al., 2001). Different numbers of nodes were tested for the cluster-based maps, and we found that 60 nodes gave sufficient detail to uncover smaller groups in the data while still avoiding empty nodes.
Fig. 5 is an example of a “heat” map, where the color of the node conveys magnitude, in this case frequency or number of students. This map was made with cluster number as a supervising variable and chemistry and mathematics self-concept scores as the variables of interest. As we can see from the legend on the left side of the map, blue maps represent small groups of students (range 2–5) and red maps represent larger groups of students (range 12–15). The lack of gray nodes in Fig. 5 indicates that there are no empty nodes. It is important to note that the closer that nodes are to one another, the more similar the student groups are on the measures of interest. However, this map only shows the number of students in each node and not the magnitude of the chemistry and mathematics self-concept scores. We will look to related SOMs that convey cluster membership and the average self-concept score for chemistry and mathematics in each of the nodes.
Fig. 6 and 7 are a different type of map, a weight vector plot. In this type of map, color distinguishes different variables, and the size of the wedge represents the magnitude of each variable. The wedges in each node in Fig. 6 represent the cluster membership for the students in that node. This figure aids the interpretation of other maps in this analysis by displaying the location of each cluster. By using cluster membership as a supervising variable, we expect that most nodes will only contain students from one of the five clusters. The only exception to this is the third node from the right in the fourth row from the top of the map. The students that make up this node come from clusters 3, 4, and 5. Though this is not ideal, we can see in Fig. 4 that clusters 3, 4, and 5 have points near one another, which means that some of the students, though members of different clusters, have similar chemistry and mathematics self-concept scores to one another. As such, the presence of one node containing students from multiple clusters is not overly concerning, especially since there are only seven students in that node, as indicated by the color of that node in Fig. 5. The presence of only one node containing students from multiple clusters indicates that the assignment of cluster membership is a robust categorization for all but seven students of a sample of 431.
 | ||
| Fig. 6 Self-organizing map (weight vector plot) displaying the distribution of clusters. The color and position of wedge indicates the cluster number of the students in each node. | ||
 | ||
| Fig. 7 Self-organizing map (weight vector plot) of students' chemistry and mathematics self-concept scores. The diameter of each semicircle shows average score for chemistry self-concept (red) and average score for mathematics self-concept (blue) for the students in each node. Recall that similar scoring nodes are near neighbors. | ||
When interpreting the shapes in Fig. 6, we can see from the legend that the students in the first node from the left in the bottom row are all members of cluster 2. Based on their cluster membership we expect these students to have high chemistry self-concept scores and high mathematics self-concept scores. We can use Fig. 7 to demonstrate the veracity of that claim. Fig. 7 displays the self-concept scores of these students as semi-circles. The red semi-circle represents students' chemistry self-concept score and the blue semi-circle represents students' mathematics self-concept score. Larger semi-circles represent higher average self-concept scores for the students in that node. As expected from their membership in cluster 2, students in the first node from the left in the bottom row of the map have high chemistry and mathematics self-concept scores.
While Fig. 6 is useful in directly comparing chemistry and mathematics self-concept scores, another way to use SOMs to display that information is with “heat” maps. “Heat” maps, as with Fig. 5, use color to indicate the magnitude of a variable in each node. Fig. 8 shows students' chemistry and mathematics self-concept scores. The color red indicates high average scores for the students a node, while the color blue indicates low average scores for the students a node. If we again examine the first node from the left in the bottom row of Fig. 8 we can see that the students in that node have high chemistry and mathematics self-concept scores. This is consistent with the other maps, as well as their membership in cluster 2.
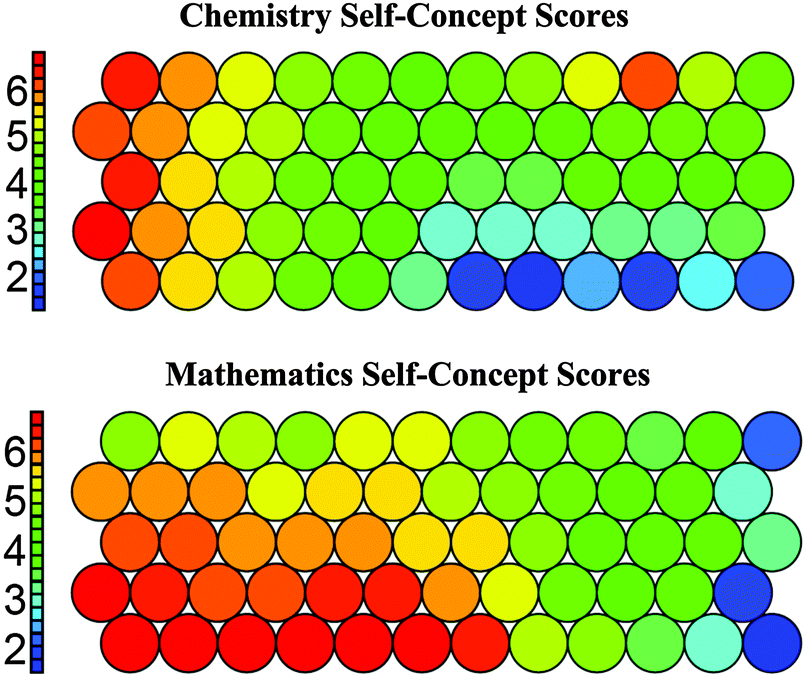 | ||
| Fig. 8 Self-organizing “heat” maps of students' chemistry and mathematics self-concept scores. Node color signifies the average score for each variable (chemistry or math self-concept) for the students in that node. Recall that nodes with similar scores are near neighbors on maps. | ||
While the first node from the left in the bottom row of the map is useful for describing the features of the maps, it offers little new information. If we examine some of the nodes on the opposite corner of the map, the right side of the top row, we can see smaller groups that were not well represented by the cluster analysis. These students, who are members of cluster 3, have higher chemistry self-concept scores but lower mathematics self-concept scores. There are not large numbers of students with this profile, which is likely why they were not represented with their own cluster, but they are an interesting group. This group of students is being examined more closely in a different study to determine the specific environmental factors at work (i.e. classroom culture and instructional practices) and how such factors might play a role in the students' chemistry self-concept scores. One preliminary finding is that many of the students with the higher Ch and lower M self-concept scores profile were students in the Com track. As there was only one teacher in our study with students in the Com track, we can more easily study the specific features of that classroom environment. We found that the Com students experienced many student-centered lessons, and that their teacher was very dedicated to the idea that all students, no matter their previous science or mathematics background, could learn chemistry. Furthermore, the curriculum used in the classroom placed a lower emphasis on the mathematical parts of chemistry. These factors may help explain why many Com students had higher Ch self-concept scores and lower M self-concept scores. Using SOMs to visualize students' chemistry and mathematics self-concept scores allows us to find these smaller groups of students that otherwise might have been overlooked.
SOMs were also used for analyzing students' chemistry self-concept scores over the course of an academic year. As one goal of the study was to describe secondary chemistry students' chemistry self-concept, we did not create or implement any interventions designed to increase students' self-concept scores. We did, however, want to observe any trends in scores and probe any relationships with classroom environments. A more detailed analysis of the classroom environments is being prepared, but our initial findings are that the main activities students engage in are listening to lectures on chemistry topics and performing “cookbook” type experiments. These predominant teaching strategies are consistent with national reports based on hundreds of secondary chemistry classrooms from Smith (2013) and Deters (2006). Based on the similarities among the classroom environments, as well as the routine nature of the methods used, we predicted that there would not be wholesale changes in chemistry self-concept scores throughout the academic year. Still, as the students gained more experience with the subject of chemistry they might have changed their beliefs about their abilities to succeed in chemistry. Therefore a longitudinal analysis was warranted.
The best way to visualize students' scores at two time points is with a scatterplot. This allows students to be tracked through time, though it is limited to two measurements. Our goal is to track students over six time points. Box-and-whisker plots can display six time points on a single graph, but do not allow for the tracking of individual students. A lack of change in the distribution of a box-and-whisker plot could easily be due to some scores increasing and others decreasing, mathematically negating one another. SOMs allow us to track small groups of students with similar characteristics across all six time points. Inputting students' self-concept scores for all six time points allows the algorithm to group students based on their similarities for all of the rounds of data collection. Therefore, students grouped in a single node have similar chemistry self-concept profiles over time. We can use a weight vector plot (with the wedges in order of time points) to easily interpret trends in students' chemistry self-concept scores over time, as well as “heat” maps to examine scores at one time point. In this case the size of the wedge in each node represents the average self-concept score of the students in that node, where smaller wedges indicate lower chemistry self-concept scores and larger wedges represent higher chemistry self-concept scores.
When deciding on the appropriate number of nodes for the maps in this analysis, we used the earlier analysis as a guide. The cluster-based analysis used 60 nodes for a sample of 431 students. The longitudinal analysis has 203 students, approximately half the number of students as the cluster-based analysis, so we decided to use 32 nodes, approximately half the number of nodes used previously. As we can see in Fig. 9 there are no empty nodes, which is one indicator that the number of nodes is appropriate.
 | ||
| Fig. 9 Self-organizing “heat” map displaying the number of students per node for the longitudinal analysis. | ||
Fig. 10 shows the weight vector plot for the longitudinal analysis. The colors of the wedges represent the different time points when the chemistry self-concept data were collected. Round 0 corresponds with the beginning of the academic year in Ohio (August), Round 2 corresponds with the end of the first semester (December), and Round 5 corresponds with the end of the second semester (May). On the plots, the study begins with the red wedge (Round 0) and moves through time counterclockwise around the circle. The size of the wedge represents the magnitude of the average of students' chemistry self-concept scores at that time in the cluster, so the larger the wedge the higher the average chemistry self-concept score.
 | ||
| Fig. 10 Self-organizing map (weight vector plot) showing the students' average chemistry self-concept scores over one academic year per node, beginning with the red wedge and moving counter clockwise around the pie. | ||
We can see that for most of the nodes the magnitude of students' chemistry self-concept scores is stable. Although the classroom environments are similar to one another and representative of the typical secondary chemistry instruction across the US, it seems that as students gain expertise in chemistry over the course of an academic year of secondary school, their chemistry self-concepts do not appreciably change. A repeated measures ANOVA supports this result of stability (F(3.53, 712.29) = 1.91, p = 0.12). As the assumption of sphericity was not met, we used the Greenhouse-Geisser correction. However, SOMs reveal smaller groups of students whose scores indeed changed over time. The first four nodes from the right on the top row show growth in chemistry self-concept over time. The first node from the left on the second row from the bottom (N = 2) and the first node from the left on the bottom row (N = 4) both show large decreases over time. As we can see from Fig. 10, there are few students who exhibit these patterns, so they are not detected with other forms of analysis. Using SOMs this way allows researchers to identify the students with these interesting trends and more closely study the classroom environment they experienced. Many of the students who experienced growth are in a classroom with a teacher who clearly laid out expectations for students and gave them the tools to meet those expectations, thus demonstrating to the students that their effort was what determined their success.
These longitudinal results are consistent with self-concept literature that describes the construct as stable (Shavelson et al., 1976). Research on improving academic facets of self-concept demonstrates that specific self-concept interventions are better for increasing students' self-concept than solely focusing on the classroom content (O'Mara et al., 2006). This suggests that it is unlikely that many students would experience an increase in chemistry self-concept across an academic year unless directed self-concept interventions were implemented. Data collected on the classroom environments reveals that self-concept focused interventions were not a feature of any of the classrooms in the study. This may help explain why most students did not show an increase in chemistry self-concept scores throughout an academic year. These results underscore the importance of understanding the role of the affective domain in the secondary chemistry classroom.
Conclusions
The research questions guiding this study were (1) How can we use cluster analysis and Self-Organizing Maps to characterize secondary students' chemistry self-concept scores at one point in time? (2) What longitudinal trends do we observe in secondary chemistry students' chemistry self-concept scores? A five cluster solution revealed four groups that, taken together, demonstrate a positive correlation between chemistry and mathematics self-concept scores. An unexpected fifth group also emerged, with students in this group having low chemistry self-concept and high mathematics self-concept scores. Analyses using SOMs helped uncover smaller groups in the data, including a small number of students with high chemistry self-concept scores and low mathematics self-concept scores.Initial longitudinal analyses using an ANOVA failed to find significant changes in students' chemistry self-concept scores throughout an academic year. Using SOMs demonstrated two things: (1) most students have stable chemistry self-concept scores over time, and (2) some students show noticeable growth or decline. The students whose chemistry self-concept scores changed would not have been found without a technique that showcased small groups of data.
This study used a combination of hierarchical cluster analysis and Self-Organizing Maps to study students' chemistry and mathematics self-concept scores. Using SOMs allowed us to examine the clusters in more detail, which led to the discovery of the students with higher chemistry than mathematics self-concept scores. This suggests that, while cluster analysis is a useful tool for grouping data, there may be smaller patterns that can emerge through closer scrutiny. The results from the longitudinal analysis echo this as the overall trend is one of stability but through smaller groupings in the data we can see students who exhibit changes in chemistry self-concept scores over time.
Limitations
Some of the limitations of conducting educational research in secondary settings affect the generalizability of these findings. The majority of the student participants are minors, which requires us to collect both student assent and parental consent to use their data. This requirement may be limiting the number of students who participate in the study. Furthermore, student absences in the secondary setting are common, which leads to missing data. This affects sample sizes throughout the academic year, and is the reason for the much reduced number of students for the longitudinal analysis. A self-selection bias may occur, which could affect the distribution of students' self-concept scores. The sample is not completely random, as it was restricted by geography and voluntary participation by the teachers. As a result the findings from this study are not generalizable to all secondary chemistry students; however, they do give insight into the beliefs of a group of secondary students from classrooms that are similar to many others across the US.Implications for research and future work
Cluster analysis is a valuable tool for finding natural groupings in a data set. This cluster analysis showed how students' self-concept scores can be used to group students in a way that is not solely based on academic tracking data. Since academic tracking is not done based on affective traits, it was not useful to assume that academic tracking would align well with chemistry self-concept scores. By using cluster analysis researchers can move past initial assumptions about student groupings and find other results based on other measures such as chemistry self-concept scores, as was done in this study.A data analysis and visualization technique new to chemistry education research, SOMs, can also be a useful tool when conducting research on teaching and learning in chemistry. A finer-grained technique than cluster analysis, using SOMs allows researchers to find smaller groupings in the data and uncover trends that might otherwise go undetected. SOMs helped uncover the small number of students with high chemistry and low mathematics self-concepts, as well as the students who showed changes over time in chemistry self-concept. These visualizations offer a richer analysis of a data set.
Additional research in other secondary settings should be undertaken to form a more complete picture of chemistry self-concept in secondary students. Also, further research into the relationship between the secondary chemistry classroom and secondary students' chemistry self-concept scores, as well as the relationship between secondary students' chemistry knowledge and chemistry self-concept is needed to better understand what factors affect change in self-concept scores over time and how self-concept may influence performance.
Implications for teaching
The results of the cluster analysis suggest that academic tracking is not the only way to understand secondary chemistry students' self-concept. Students have a range of beliefs which cannot be solely explained by their academic track. As self-concept has been shown to be related to important facets of mental health constructs (Marsh et al., 2004) it is a useful construct for teachers to use to identify those students who may need additional support. College and university professors can assess chemistry self-concept at the beginning of the academic year to better understand their students.Furthermore, the longitudinal data suggest that interventions may be necessary to improve students' self-concept. Research on self-concept interventions in other domains (O'Mara et al., 2006) may be useful in informing chemistry teaching in the secondary and postsecondary environments.
Acknowledgements
We sincerely thank all of the research participants for their participation in the study. We are also grateful to the Yezierski and Bretz research groups for their feedback and advice.References
- Bandura A., (1977), Social learning theory, Englewood Cliffs, NJ: Prentice-Hall.
- Barbera J., Adams W. K., Wieman C. E. and Perkins K. K., (2008), Modifying and validating the Colorado Learning Attitudes about Science Survey for use in chemistry, J. Chem. Educ., 85(10), 1435–1439.
- Bauer C. F., (2005), Beyond “student attitudes”: chemistry self-concept inventory for assessment of the affective component of student learning, J. Chem. Educ., 82(12), 1864–1870.
- Bauer C. F., (2008), Attitude towards chemistry: a semantic differential instrument for assessing curriculum impacts, J. Chem. Educ., 85(10), 1440–1445.
- Bong M. and Clark R. E., (1999), Comparison between self-concept and self-efficacy in academic motivation research, J. Educ. Psychol., 34(3), 139–153.
- Bong M. and Skaalvik E. M., (2003), Academic self-concept and self-efficacy: how different are they really? Educ. Psychol. Rev., 15(1), 1–40.
- Byrne B. M., (1986), Self-concept/academic achievement relations: an investigation of dimensionality, stability, and causality, Can. J. Behav. Sci., 18(2), 173–186.
- Campbell I., (2007), Chi-squared and Fisher-Irwin tests of two-by-two tables with small sample recommendations, Stat. Med., 26, 3661–3675.
- Chan J. Y. K. and Bauer C. F., (2014), Identifying at-risk students in general chemistry via cluster analysis of affective characteristics, J. Chem. Educ., 91(9), 1417–1425.
- Clark L. A. and Watson D., (1995), Constructing validity: basic issues in objective scale development, Psychol. Assessment, 7(3), 309–319.
- College Board, (1995), AP Chemistry Course Overview. http://https://apstudent.collegeboard.org/apcourse/ap-chemistry (accessed Jan, 2016).
- Dalgety J., Coll R. K. and Jones A., (2003), Development of Chemistry Attitudes and Experiences Questionnaire (CAEQ), J. Res. Sci. Teach., 40(7), 649–668.
- Deboeck G., (1998), Best practices in data mining using Self-Organizing Maps, in G. Deboeck and T. Kohonen (ed.) Visual explorations in finance, New York, NY: Springer, pp. 203–229.
- Deters K. M., (2006), What are we teaching in secondary chemistry? J. Chem. Educ., 83(10), 1492–1498.
- Everitt B. S., Landau S., Leese M. and Stahl D., (2011), Cluster analysis, 5th edn, Chichester, UK: Wiley.
- Fazio R. H., (2007), Attitudes as object-evaluation associations of varying strength, Soc. Cognition, 25, 603–637.
- Ferrell B. and Barbera J., (2015), Analysis of students' self-efficacy, interest, and effort beliefs in general chemistry, Chem. Educ. Res. Pract., 16(2), 318–337.
- Galloway K. R. and Bretz S. L., (2015), Using cluster analysis to characterize meaningful learning in a first-year university chemistry laboratory course, Chem. Educ. Res. Pract., 16(4), 879–892.
- Grove N. and Bretz S. L., (2007), CHEMX: an instrument to assess students' cognitive expectations for learning chemistry, J. Chem. Educ., 84(9), 1524–1529.
- Kiviluoto K. and Bergius P., (1998), Maps for analyzing failures of small and medium-sized enterprises, in G. Deboeck and T. Kohonen (ed.), Visual explorations in finance, New York, NY: Springer, pp. 59-71.
- Kohonen T., (1982), Self-organized formation of topographically correct feature maps, Biol. Cybern., 43, 59–69.
- Kohonen T., (2001), Self-Organizing Maps, 3rd edn, New York, NY: Springer.
- Lek S. and Guegan J. F., (1999), Artificial neural networks as a tool in ecological modelling, an introduction, Ecol. Model., 120, 65–73.
- Lewis S. E., Shaw J. L., Heitz J. O. and Webster G. H., (2009), Attitude counts: self-concept and success in general chemistry, J. Chem. Educ., 86(6), 744–749.
- Marco S., Ortega A., Pardo A. and Samitier J., (1998), Gas identification with Tin Oxide sensor array and Self-Organizing Maps: Adaptive correction of sensor drifts, Instrumentation and Measurement, IEEE Transactions on, 47(1), 316–321.
- Marsh H. W., and Yeung A. S., (1997), Coursework selection: Relations to academic self-concept and achievement, Am. Educ. Res. J., 34, 691–720.
- Marsh H. W., Relich J. and Smith I. D., (1981), Self-concept: The construct validity of the Self Description Questionnaire.
- Marsh H. W., Parada R. H. and Ayotte V., (2004), A multidimensional perspective of relations between self-concept (Self Description Questionnaire II) and adolescent mental health (Youth Self-Report), Psychol. Assessment, 16(1), 27–41.
- Nielsen S. E. and Yezierski E., (2015), Exploring the structure and function of the Chemistry Self-Concept Inventory with secondary chemistry students, J. Chem. Educ., 92(11), 1782–1789.
- Nieswandt M., (2007), Student affect and conceptual understanding in learning chemistry, J. Res. Sci. Teach., 44(7), 908–937.
- Novak J. D., (1993), Human constructivism: a unification of psychological and epistemological phenomena in meaning-making, International Journal of Personal Construct Psychology, 6(2), 167–193.
- Oh K. S., Feng Y., Kaneko K., Makinouchi A. and Bae S. H., (2001), SOM-based R*-tree for similarity retrieval, in Database Systems for Advanced Applications, 2001. Proceedings. Seventh International Conference on IEEE, pp. 182–189.
- O'Mara A. J., Marsh H. W., Craven R. G. and Debus R. L., (2006), Do self-concept interventions make a difference? a synergistic blend of construct validation and meta-analysis, J. Educ. Psychol., 41(3), 181–206.
- Powers A. (ed.), (2011), Chemistry in the Community, American Chemical Society.
- Preckel F., Goetz T., Pekrun R. and Kleine M., (2008), Gender differences in gifted and average-ability students comparing girls' and boys' achievement, self-concept, interest, and motivation in mathematics, Gifted Child Quart., 52(2), 146–159.
- R Core Team, (2015), R: a language and environment for statistical computing, R Foundation for Statistical Computing, Vienna, Austria, URL http://www.R-project.org/.
- Raker J. R. and Holme T. A., (2014), Investigating faculty familiarity with assessment terminology by applying cluster analysis to survey data, J. Chem. Educ., 91(8), 1145–1151.
- Rosenberg M., (1965), Society and the adolescent self-image, Princeton, NJ: Princeton University Press.
- Schwarz N., (1999), Self-reports: how the questions shape the answers, Am. Psychol., 54, 93–105.
- Shavelson R. J. and Bolus R., (1982), Self-concept: the interplay of theory and methods, J. Educ. Psychol., 74(1), 3–17.
- Shavelson R. J., Hubner J. J. and Stanton G. C., (1976), Self-concept: validation of construct interpretations, Rev. Educ. Res., 46(3), 407–441.
- Shaw A. J., Harrison T. G., Croker S. J., Medley M., Sellou L., Shallcross K. L., Williams S. J., Grayson D. J. and Shallcross D. E., (2010), University-school partnerships: on the impact on students of summer schools (for school students aged 17–18) run by Bristol ChemLabS, Acta Didactica Napocensia, 3(4), 35–48.
- Smith P. S., (2013), 2012 National survey of science and mathematics education: status of secondary chemistry, Chapel Hill, NC: Horizon Research, Inc.
- Tamayo P., Slonim D., Mesirov J., Zhu Q., Kitareewan S., Dmitrovsky E., Lander E. S. and Golub T. R., (1999), Interpreting patterns of gene expression with self-organizing maps: methods and application to hematopoietic differentiation, Proc. Natl. Acad. Sci. U. S. A., 96(6), 2907–2912.
- Tavakol M. and Dennick R., (2011), Making sense of Cronbach's alpha, Int. J. Med. Educ., 2, 53–55.
- Villafane S. M., Garcia C. A. and Lewis J. E., (2014), Exploring diverse students' trends in chemistry self-efficacy throughout a semester of college-level preparatory chemistry, Chem. Educ. Res. Pract., 15(2), 114–127.
- Wehrens R. and Buydens L. M. C., (2007), Self- and super-organizing maps in R: the kohonen package, J. Stat. Softw., 21(5), 1–19.
Footnote |
| † Electronic supplementary information (ESI) available. See DOI: 10.1039/c6rp00058d |
| This journal is © The Royal Society of Chemistry 2016 |