Catalytic distillation for ethyl acetate synthesis using microfibrous-structured Nafion–SiO2/SS-fiber solid acid packings†
Tao
Deng
,
Yakun
Li
,
Guofeng
Zhao
,
Zhiqiang
Zhang
,
Ye
Liu
and
Yong
Lu
*
Shanghai Key Laboratory of Green Chemistry and Chemical Processes, School of Chemistry and Molecular Engineering, East China Normal University, Shanghai, 200062, China. E-mail: ylu@chem.ecnu.edu.cn; Fax: (+86) 21 62233424
First published on 18th May 2016
Abstract
Catalytic distillation (CD) offers a unique integration of distillation and catalysis to selectively separate products in situ while making a positive shift of chemical equilibrium and has therefore been well received as an inviting avenue to green chemical processing. Rendering novel structured catalytic packings is particularly desirable but remains challenging. Herein, we present a microfibrous-structured Nafion–SiO2/SS-fiber solid acid catalyst and demonstrate its separation and reaction efficiency as CD packings for esterification to produce ethyl acetate from acetic acid and ethanol. A thin-sheet microfibrous structure with 15 vol% 20 μm stainless steel fibers (SS-fiber) and 85 vol% void volume was shaped into θ-ring analogues. Nafion was then firmly locked into the SiO2 layer that was anchored onto the SS-fiber surface by a dip-coating method using self-crosslinking Nafion–SiO2 sol–gel prepared by Nafion-catalyzed hydrolysis of tetraethylorthosilicate (TEOS). Such micro-structured Nafion catalysts worked effectively and efficiently in the CD for esterification of acetic acid with ethanol as the result of a unique combination of high catalyst performance (stability, adequate acidic sites and high mass/heat transfer) and instantaneous distillation. For instance, high total (93.6%) and actual (91.6%) yields of ethyl acetate with 96.2% purity were achievable at a high space-time yield (4.3 g mmol−1 h−1) while the high CD efficiency was maintained for 40 h over 5 consecutive batch runs.
Introduction
Ethyl acetate is widely used as an environmentally friendly replacement solvent for traditional aromatic compounds such as toluene, xylenes and ketones.1 Industrially, ethyl acetate is commonly produced via direct esterification of acetic acid with ethanol in the presence of homogeneous mineral acids such as H2SO4 and HCl.2 The excellent contact between reactants and catalyst molecules makes homogeneous mineral acids highly efficient. However, this industrial process would generate chemically reactive waste streams with highly corrosive media, making both purification and waste disposal difficult and hazardous. Because of environmental concerns, there has been increasing interest in the development of green and sustainable catalysts for industrial production of ethyl acetate. At present, heterogeneous catalysts such as solid acid catalysts have been an alternative of the homogeneous acid catalysts due to their easy reactant–product separation, catalyst recovery, corrosion prevention, and thermal/chemical stability.3Nafion (perfluorinated resin sulfonic acid), a copolymer of tetrafluoroethylene and perfluoro-2-(fluorosulfonylethoxy) propyl vinyl ether, is an attractive replacement for homogeneous acid catalysts in esterification reactions because of its high acid strength (similar to sulfuric acid) and the chemical inertness of the fluorocarbon backbone.4,5 However, due to the extremely low surface area of polymer beads and thus the buried active sites, the catalytic activity of a Nafion resin is strongly limited under many reaction conditions.6 Recently, different mesoporous silica supports (MCM-41,7 SAC-13,8 and SBA-16 (ref. 9)) for a Nafion catalyst have been applied to improve the accessibility of the acid groups and thereby the catalytic activity.10,11 Liu et al.12 investigated the esterification of acetic acid by methanol. By comparing the activity of a commercial Nafion/silica nanocomposite catalyst (SAC-13) and H2SO4, they found that SAC-13 had comparable activity. López et al.13 studied the synthesis of biodiesel and discovered that compared with the Nafion®NR50 resin, Nafion/SAC-13 had higher catalytic activity because of more accessible acid sites.
The esterification of acetic acid with ethanol falls into a typical class of reaction systems where the product formation is limited by the equilibrium nature of the process. Developing alternative routes to overcome this equilibrium limitation has been becoming important. The reaction products contain a minimum boiling ternary azeotrope of ethyl acetate, ethanol and water which is homogeneous and difficult to separate. As a green reactor technology, catalytic distillation (CD) presents a viable solution to the esterification reaction system. To date, CD normally comprises a liquid phase reaction over a solid acid catalyst with countercurrent vapor flow and removal of products to make a positive shift of the chemical equilibrium. Moreover, the reaction heat can be utilized efficiently for the vaporization of the liquid phase to promote product distillation in the identical CD column. Therefore, CD enjoys many specific advantages over the conventional sequential reaction followed by distillation or other separation techniques; the potential benefits include higher reaction selectivity and process yield, lower energy consumption and capital investment.14–19 Lai et al.17 investigated the production of ethyl acetate by CD using Amberlyst 35 (acidic ion exchange resin) at a pilot-plant scale and they obtained high-purity ethyl acetate (higher than 99%) with acetic acid impurities of less than 100 ppm. Bhatia et al.18 investigated the performance of a CD column for the production of isopropyl palmitate by esterification of palmitic acid with isopropanol. Zinc acetate supported on a functionalized silica gel catalyst exhibited high conversion of palmitic acid (about 99.5%) under optimal reaction conditions. Kiss et al.19 studied the esterification of dodecanoic acid and methanol in a pilot plant by CD with a sulfated zirconia solid acid catalyst. Due to the small diameter of the column (only 0.1 m) and high efficiency of the catalyst (1% sulfated zirconia loading), low capital costs with high production (1880 tons per year of fatty ester) were obtained.
Despite these promising applications, some significant challenges still exist with regards to CD reactors, such as a high pressure drop and limited heat/mass transfer originating from the particulate form and low heat/mass transfer characteristics of these catalysts.20 Recently, some monolithic-structured metal-based supports (MULTIPAK®,21 KATAPAK ®-SP,22 and SCPI23) have been adopted to solve these problems, and in the CD process, a common way is to arrange the particulate catalyst in arrays of supports (namely arranged catalysts). However, these arranged catalysts are complex and costly exercised with no guarantee of catalyst durability due to the inherent usage of particulate catalysts even though in an arranged form. Monolithic microfibrous structures using metal fibers provide a combination of unique form factor, enhanced heat/mass transfer, high permeability, and highly efficient engineering of a catalyst from nano- to macro-scale in one step,24 making them one class of promising structured support particularly suitable for strongly endo-/exothermic and/or high-throughput reaction processes.25–30 Previous efforts have successfully applied this microfibrous support to develop structured catalysts for the methanol-to-propene reaction,25 NH3 cracking,26 gas-phase oxidation of alcohols,27 methane dry reforming,28 oxidative coupling of methanol to methyl formate,29 and methanol steam reforming.30 Moreover, such microfibrous supports with unique form factors can be made into thin sheets of large area and/or a pleated sheet structure to control pressure drop and improve contacting efficiency of the reactant, different from other traditionally employed contacting schemes including packed beds, honeycomb monoliths or woven and grid.26 Therefore, it is expected that their effective catalytic functionalization may outperform the traditional particulate and even the arranged catalysts.
Herein, we designed and tailored a microfibrous-structured Nafion–SiO2/SS-fiber catalyst with high heat/mass transfer and adequate exposed acid sites. Such a microfibrous-structured Nafion–SiO2/SS-fiber catalyst was used in the CD route and demonstrated a unique combination of high esterification efficiency and instantaneous ethyl acetate distillation. In this study, a sinter-locked 3-dimensional (3D) network consisting of 15 vol% 20 μm stainless steel microfibers (SS-fiber) was utilized as the structured matrix due to its high mechanical strength and thermal stability/conductivity.31,32 Subsequently, a Nafion/SiO2 solid acid film was embedded onto the microfiber surface via a dip-coating method with a self-crosslinking Nafion–SiO2 sol–gel prepared by Nafion-catalyzed hydrolysis of tetraethylorthosilicate (TEOS). The as-prepared catalysts were packed into the CD columns and tested in the esterification of acetic acid with ethanol. The catalysts were characterized by scanning electron microscopy (SEM), Fourier transform infrared spectroscopy (FTIR) and thermal gravimetric analysis (TGA). The influence of microfibrous-structured Nafion–SiO2/SS-fiber catalyst preparation and operation conditions on the overall performance was also carefully investigated.
Experimental
Catalyst preparation
Catalyst characterization
The Nafion–SiO2/SS-fiber catalyst morphology was imaged by SEM (Hitachi S-4800, Japan). The catalysts were characterized by FTIR (BRUKER Co., Germany) using Attenuated Total Reflectance (ATR) in the wavenumber range of 4000–400 cm−1. The thermal stability of the samples was studied by thermogravimetric analysis using an STA409 PC (TG, NETZSCH Co., Germany), which was carried out under a nitrogen atmosphere from 30 to 800 °C at a heating rate of 10 °C min−1. The structured catalyst was subjected to an ultrasonic concussion test in an ethanol solution for 5 h to check the durability of the catalyst, at a 200 W ultrasonic output power. The ion-exchange capacity (IEC) representing the number of milli-equivalents of ions (H+) in 1 g of catalyst was used to indicate the catalyst acid capacities.34 For IEC measurements, 2.0 g of the Nafion–SiO2/SS-fiber catalyst was dispersed in a 50 mL NaCl solution of 1 mol L−1 at room temperature for 24 h and the liquid portion was titrated with 0.01 mol L−1 NaOH using a 5% solution of phenolphthalein as the indicator. The Nafion loading was estimated on the basis of the weight change of the microfibrous-structured θ-ring analogues before and after dip-coating.Catalyst tests
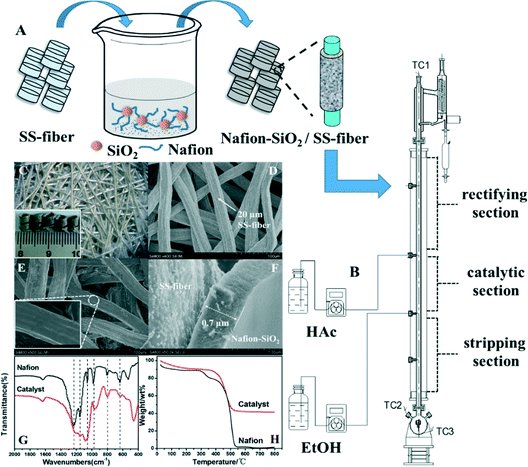
Catalyst tests were carried out in a laboratory scale column of 20 mm diameter and a total packing height of 0.8 m. The column was divided into three sections: a rectifying section, catalytic section and stripping section (Fig. 1B). The rectifying section at the top and the stripping section at the bottom both were packed with θ network rings (2 × 2 mm) and the catalytic section was equipped with the structured Nafion–SiO2/SS-fiber catalyst. Acetic acid and ethanol (A.R., Sinopharm Chemical Reagent Co., Ltd.) were fed into the column above and below the catalytic section, respectively (Fig. 1B). The column was heated by insulation current and the temperatures at the top and bottom of the column were measured by thermocouples. After starting the circulating water in the condenser, acetic acid and ethanol in the 3-neck flask were heated to the assigned temperature. The insulation current of the heating jacket of the column was switched on to control the column temperature, thus the vapor from the flask could have an effective transmission to the top of the column. When the backflow liquid began to appear at the top of the column, raw materials were continuously fed into the catalytic section (detailed inlet position shown in Fig. 1B) at room temperature to ensure the catalytic section was fully wetted. After 15 min of reflux, the reflux ratio was set to make partial organic phase back to the column. This CD process was performed for 8 h and the products were analyzed every 1 h with the results shown in the ESI† (Fig. S1–S7). The operation conditions including the feed molar ratio of acetic acid to ethanol, reflux ratio, weight hourly space velocity (WHSV, calculated by dividing the flow rate of acetic acid with the catalyst weight), reboiler duty (represented by the reboiler temperature), catalyst dosage and molar ratio of acetic acid to ethanol in the flask were systematically studied.Composition of the product samples collected at the top of the column and from the flask was quantitatively analyzed by a Shimadzu 2014C gas chromatograph-flame ionization detector (GC-FID) with a HP-INNOWax capillary column. An external standard method was used to simultaneously determine the ethyl acetate and ethanol contents, while the acetic acid content was determined by acid–base titration.35 The total yield of ethyl acetate (EtAc) was calculated as follows (eqn (1)): the sum of actual product outputs both at the top of the column (Ntop) and in the flask (Nbottom) was divided by the theoretical content (Ntheoretical) of ethyl acetate that was obtained by assuming that the ethanol molecules in the feedstock were all converted into ethyl acetate.
 | (1) |
 | (2) |
Results and discussion
Characteristics of the structured catalyst
The monolithic Nafion–SiO2/SS-fiber structured catalyst was prepared for a CD process. Fig. 1C shows the optical photograph for the typical structure of the monolithic catalyst with an inset showing its real-world image. The microfibrous structure of the θ-ring analogues was characterized by SEM, with the image shown in Fig. 1D, displaying the characteristic of a 3D sinter-locked network with entirely open but irregular submillimeter-scaled macropores. A uniform film of the Nafion–SiO2 composite was formed along the SS-fiber rather than lumps randomly heaped up inside the void spaces (Fig. 1E and F). This was true even after four dip-coating cycles with the composite sol–gel consisting of Nafion and SiO2. In this representative case, a high Nafion–SiO2 composite loading of 32.8 wt% was achievable, showing a Nafion–SiO2 composite thickness of 0.7 μm (Fig. 1F).The Nafion polymer dispersion and coating-film of the catalyst were characterized by FTIR spectroscopy with the spectra shown in Fig. 1G. For the Nafion polymer, the characteristic bands were observed clearly at 1240 cm−1, 1160 cm−1, 1060 cm−1, 980 cm−1 and 800 cm−1, being assigned to the asymmetric stretching of –CF2–, symmetric stretching of –CF2–,36 stretching vibration of –SO3,37 C–O–C stretching38 and S–OH stretching vibration, respectively. For our structured catalyst, similar characteristic bands of Nafion were also observed with the only difference being an additional band appearing at 461 cm−1 which was assigned to Si–O–Si stretching vibrations.39 The generally similar bands indicated that the TEOS incorporation during coating sol–gel preparation did not disrupt the overall structure of the Nafion polymer.40 We believed that such Nafion–SiO2 composite structure formation was mainly attributed to the Nafion-catalyzed hydrolysis of TEOS and effective homogeneous coatings on the SS-fiber surface.
The thermal properties of the Nafion–SiO2/SS-fiber catalyst and Nafion polymer were also tested by TGA (Fig. 1H). It was clear that the TG curves of Nafion exhibited three main degradation stages while the catalyst demonstrated two main stages. For the Nafion polymer, the first degradation stage at 50–300 °C was for the loss of water adsorbed by SO3H groups, the second between 300–450 °C for the decomposition of the sulfonic acid group,41 and the third at 450–550 °C for the decomposition of the Nafion backbone. In accordance, the degradation stage presented at around 50–400 °C for the Nafion–SiO2/SS-fiber catalyst was assignable to the loss of water adsorbed by the hydrophilic SO3H groups and the silica surface as well as the loss of SO3H groups themselves,41,42 while the stage at 400–550 °C was mainly due to the decomposition of the Nafion backbone.43 The above results indicated that the microfibrous-structured Nafion–SiO2 coating was stable enough for use in the CD process as the operation temperature was generally below 200 °C.
Effects of preparation conditions on the acidity and durability of the structured catalyst
High acidity and excellent durability of the catalytic packings are essential to CD for esterification. Notably, our Nafion–SiO2/SS-fiber catalyst, using dip-coating sol–gel obtained by adding TEOS into a Nafion polymer dispersion, showed significantly improved robustness (Table S1†). Therefore, the effects of the Nafion polymer dispersion solutions with 5 to 20 wt% Nafion content, weight ratio of Nafion to TEOS and varied coating times on the acidity and durability of the Nafion–SiO2/SS-fiber catalyst were investigated. The acid capacity of our structured catalyst was measured and represented by IEC, with the results as shown in Table 1. Clearly, the total loading of the coating-film as well as the IEC increased with increasing Nafion content in the original dispersion solutions, from 5 to 20 wt%. The loading of the coating-film decreased significantly with the Nafion/TEOS ratio from 2![[thin space (1/6-em)]](https://www.rsc.org/images/entities/char_2009.gif) :
:![[thin space (1/6-em)]](https://www.rsc.org/images/entities/char_2009.gif) 1 to 4
1 to 4![[thin space (1/6-em)]](https://www.rsc.org/images/entities/char_2009.gif) :
:![[thin space (1/6-em)]](https://www.rsc.org/images/entities/char_2009.gif) 1 using each Nafion polymer suspension solution while the IEC was discernibly enhanced using a suspension with low Nafion content of 5 wt%. A possible explanation was the lack of TEOS, which was paramount to bind more Nafion onto the SS-fiber surface.
1 using each Nafion polymer suspension solution while the IEC was discernibly enhanced using a suspension with low Nafion content of 5 wt%. A possible explanation was the lack of TEOS, which was paramount to bind more Nafion onto the SS-fiber surface.
| Nafion content (wt%) | Nafion/TEOS ratio (wt/wt) | 1st coating (wt%) | 2nd coating (wt%) | 3rd coating (wt%) | 4th coating (wt%) | Total loading (wt%) | IECa (mmol g−1) |
|---|---|---|---|---|---|---|---|
| a The ion-exchange capacity (IEC) was used to indicate the catalyst acid capacities. | |||||||
| 5 | 2![[thin space (1/6-em)]](https://www.rsc.org/images/entities/char_2009.gif) : :![[thin space (1/6-em)]](https://www.rsc.org/images/entities/char_2009.gif) 1 1 |
7.8 | 8.3 | 7.1 | 4.9 | 25.3 | 0.07 |
| 5 | 3![[thin space (1/6-em)]](https://www.rsc.org/images/entities/char_2009.gif) : :![[thin space (1/6-em)]](https://www.rsc.org/images/entities/char_2009.gif) 1 1 |
6.5 | 6.3 | 5.5 | 4.9 | 21.4 | 0.08 |
| 5 | 4![[thin space (1/6-em)]](https://www.rsc.org/images/entities/char_2009.gif) : :![[thin space (1/6-em)]](https://www.rsc.org/images/entities/char_2009.gif) 1 1 |
5.8 | 6.2 | 5.5 | 4.6 | 21.1 | 0.11 |
| 10 | 2![[thin space (1/6-em)]](https://www.rsc.org/images/entities/char_2009.gif) : :![[thin space (1/6-em)]](https://www.rsc.org/images/entities/char_2009.gif) 1 1 |
11.3 | 11.1 | 8.1 | 7.3 | 32.8 | 0.15 |
| 10 | 3![[thin space (1/6-em)]](https://www.rsc.org/images/entities/char_2009.gif) : :![[thin space (1/6-em)]](https://www.rsc.org/images/entities/char_2009.gif) 1 1 |
9.0 | 9.4 | 6.0 | 6.5 | 27.6 | 0.16 |
| 10 | 4![[thin space (1/6-em)]](https://www.rsc.org/images/entities/char_2009.gif) : :![[thin space (1/6-em)]](https://www.rsc.org/images/entities/char_2009.gif) 1 1 |
8.7 | 8.3 | 6.0 | 5.9 | 25.1 | 0.13 |
| 20 | 2![[thin space (1/6-em)]](https://www.rsc.org/images/entities/char_2009.gif) : :![[thin space (1/6-em)]](https://www.rsc.org/images/entities/char_2009.gif) 1 1 |
15.8 | 11.3 | 7.0 | 5.9 | 34.6 | 0.22 |
| 20 | 3![[thin space (1/6-em)]](https://www.rsc.org/images/entities/char_2009.gif) : :![[thin space (1/6-em)]](https://www.rsc.org/images/entities/char_2009.gif) 1 1 |
14.0 | 12.1 | 7.2 | 6.2 | 34.2 | 0.21 |
| 20 | 4![[thin space (1/6-em)]](https://www.rsc.org/images/entities/char_2009.gif) : :![[thin space (1/6-em)]](https://www.rsc.org/images/entities/char_2009.gif) 1 1 |
14.8 | 10.2 | 7.9 | 5.5 | 33.5 | 0.20 |
To check the durability of our structured catalysts, the catalyst samples were prepared under various conditions (Table 1) and subsequently subjected to severe ultrasonic concussion tests in ethanol to simulate the long-time reaction environment. Fig. 2 clearly shows that the catalyst weight loss increased with an increase in Nafion content of the original Nafion polymer suspension, from 5 to 20 wt% (Fig. 2A). The catalyst weight loss also increased with the Nafion/TEOS ratio at a fixed Nafion content. Meanwhile, unlike using the 20 wt% Nafion polymer suspension, the IEC content for the structured catalysts was almost unchanged with the Nafion/TEOS ratio using either 5 or 10 wt% Nafion polymer suspension (Fig. 2B). From the results in Table 1 and Fig. 2, coating sol–gels obtained using the 10 wt% Nafion polymer suspension at a Nafion/TEOS weight ratio of 2![[thin space (1/6-em)]](https://www.rsc.org/images/entities/char_2009.gif) :
:![[thin space (1/6-em)]](https://www.rsc.org/images/entities/char_2009.gif) 1 were preferred for a robust microfibrous-structured Nafion–SiO2/SS-fiber catalyst with a good balance of the IEC and the durability, which was employed in the following studies.
1 were preferred for a robust microfibrous-structured Nafion–SiO2/SS-fiber catalyst with a good balance of the IEC and the durability, which was employed in the following studies.
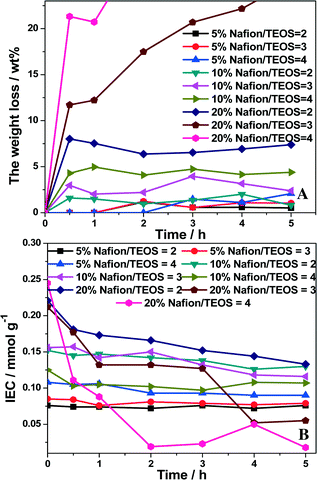 | ||
| Fig. 2 Effects of the Nafion content and Nafion/TEOS ratio on the weight loss (A) and IEC (B) with sonication time in an ethanol solution. | ||
Effects of reaction conditions on the CD performance
![[thin space (1/6-em)]](https://www.rsc.org/images/entities/char_2009.gif) :
:![[thin space (1/6-em)]](https://www.rsc.org/images/entities/char_2009.gif) 1 to 2
1 to 2![[thin space (1/6-em)]](https://www.rsc.org/images/entities/char_2009.gif) :
:![[thin space (1/6-em)]](https://www.rsc.org/images/entities/char_2009.gif) 1. Clearly, the acetic acid to ethanol ratio was optimal at 1.2
1. Clearly, the acetic acid to ethanol ratio was optimal at 1.2![[thin space (1/6-em)]](https://www.rsc.org/images/entities/char_2009.gif) :
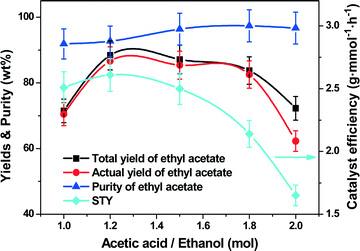
:![[thin space (1/6-em)]](https://www.rsc.org/images/entities/char_2009.gif) 1; an about 88.4% total yield of ethyl acetate was obtained with an 86.7% actual yield, 92.7% purity and the highest STY of 2.6 g mmol−1 h−1. Increasing the ratio from 1.2
1; an about 88.4% total yield of ethyl acetate was obtained with an 86.7% actual yield, 92.7% purity and the highest STY of 2.6 g mmol−1 h−1. Increasing the ratio from 1.2![[thin space (1/6-em)]](https://www.rsc.org/images/entities/char_2009.gif) :
:![[thin space (1/6-em)]](https://www.rsc.org/images/entities/char_2009.gif) 1 to 2
1 to 2![[thin space (1/6-em)]](https://www.rsc.org/images/entities/char_2009.gif) :
:![[thin space (1/6-em)]](https://www.rsc.org/images/entities/char_2009.gif) 1 decreased the total and actual yields of ethyl acetate to 72.3% and 62.3%, accompanied by a slight decrease in the STY to 1.7 g mmol−1 h−1 and a visible increase in the ethyl acetate purity to nearly 97%. At a high ratio of acetic acid to ethanol (e.g., 2.0), less ethanol was distilled and transferred through the distillation column thereby leading to lower mass/heat transfer efficiency.
1 decreased the total and actual yields of ethyl acetate to 72.3% and 62.3%, accompanied by a slight decrease in the STY to 1.7 g mmol−1 h−1 and a visible increase in the ethyl acetate purity to nearly 97%. At a high ratio of acetic acid to ethanol (e.g., 2.0), less ethanol was distilled and transferred through the distillation column thereby leading to lower mass/heat transfer efficiency.
![[thin space (1/6-em)]](https://www.rsc.org/images/entities/char_2009.gif) :
:![[thin space (1/6-em)]](https://www.rsc.org/images/entities/char_2009.gif) 1.5 to 1.5
1.5 to 1.5![[thin space (1/6-em)]](https://www.rsc.org/images/entities/char_2009.gif) :
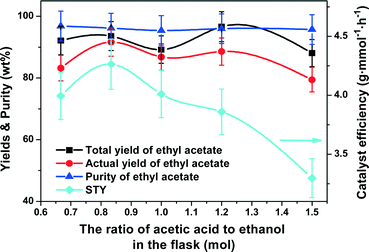
:![[thin space (1/6-em)]](https://www.rsc.org/images/entities/char_2009.gif) 1 was investigated with the results as shown in Fig. 8. The total and actual yields of ethyl acetate exhibited an “M”-shaped plot across the whole ratios studied. The highest total yield of 96.7% appeared at an acetic acid to ethanol molar ratio of 1.2
1 was investigated with the results as shown in Fig. 8. The total and actual yields of ethyl acetate exhibited an “M”-shaped plot across the whole ratios studied. The highest total yield of 96.7% appeared at an acetic acid to ethanol molar ratio of 1.2![[thin space (1/6-em)]](https://www.rsc.org/images/entities/char_2009.gif) :
:![[thin space (1/6-em)]](https://www.rsc.org/images/entities/char_2009.gif) 1, but the highest actual yield of 91.6% was at 1
1, but the highest actual yield of 91.6% was at 1![[thin space (1/6-em)]](https://www.rsc.org/images/entities/char_2009.gif) :
:![[thin space (1/6-em)]](https://www.rsc.org/images/entities/char_2009.gif) 1.2. The purity of ethyl acetate remained almost unchanged in the range of 95.4% to 96.8%. The STY first increased from 4.0 to 4.3 g mmol−1 h−1 when the molar ratio of acetic acid to ethanol in the flask was increased from 1
1.2. The purity of ethyl acetate remained almost unchanged in the range of 95.4% to 96.8%. The STY first increased from 4.0 to 4.3 g mmol−1 h−1 when the molar ratio of acetic acid to ethanol in the flask was increased from 1![[thin space (1/6-em)]](https://www.rsc.org/images/entities/char_2009.gif) :
:![[thin space (1/6-em)]](https://www.rsc.org/images/entities/char_2009.gif) 1.5 to 1
1.5 to 1![[thin space (1/6-em)]](https://www.rsc.org/images/entities/char_2009.gif) :
:![[thin space (1/6-em)]](https://www.rsc.org/images/entities/char_2009.gif) 1.2 and then decreased to 3.3 g mmol−1 h−1 with further increase in the ratio to 1.5
1.2 and then decreased to 3.3 g mmol−1 h−1 with further increase in the ratio to 1.5![[thin space (1/6-em)]](https://www.rsc.org/images/entities/char_2009.gif) :
:![[thin space (1/6-em)]](https://www.rsc.org/images/entities/char_2009.gif) 1. Therefore, the optimal molar ratio of acetic acid to ethanol in the flask was set to 1
1. Therefore, the optimal molar ratio of acetic acid to ethanol in the flask was set to 1![[thin space (1/6-em)]](https://www.rsc.org/images/entities/char_2009.gif) :
:![[thin space (1/6-em)]](https://www.rsc.org/images/entities/char_2009.gif) 1.2.
1.2.
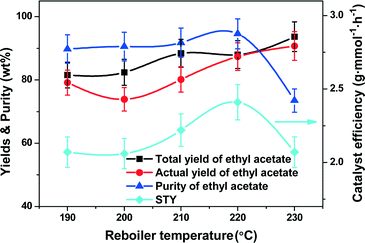
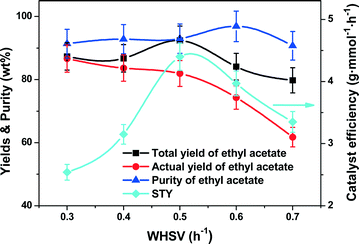
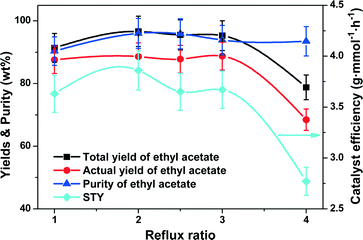
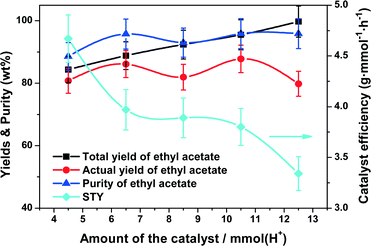
Considering the balance between the high total yield (93.6%) and actual yield (91.6%) with an excellent purity of ethyl acetate (96.2%) and a high STY of 4.3 g mmol−1 h−1, it was optimal to operate the reaction in a CD column used in this study under the conditions as follows: a reboiler temperature of 220 °C, a molar feed ratio of acetic acid to ethanol of 1.2![[thin space (1/6-em)]](https://www.rsc.org/images/entities/char_2009.gif) :
:![[thin space (1/6-em)]](https://www.rsc.org/images/entities/char_2009.gif) 1, WHSV of 0.5 h−1, a reflux ratio of 2, a catalyst dosage of 10.5 mmol of H+ (acid) and a molar ratio of acetic acid to ethanol in the flask of 1
1, WHSV of 0.5 h−1, a reflux ratio of 2, a catalyst dosage of 10.5 mmol of H+ (acid) and a molar ratio of acetic acid to ethanol in the flask of 1![[thin space (1/6-em)]](https://www.rsc.org/images/entities/char_2009.gif) :
:![[thin space (1/6-em)]](https://www.rsc.org/images/entities/char_2009.gif) 1.2.
1.2.
Catalyst stability
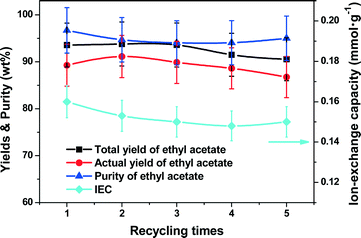
The structured Nafion–SiO2/SS-fiber catalyst was tested in consecutive batch experiments under the aforementioned optimal conditions for 5 runs of 8 h each. The IEC was measured before every batch and the results are shown in Fig. 9. The catalyst after the 40 h test was characterized by SEM, with the images as shown in Fig. 10. Clearly, throughout the test of the 5 batches, the total/actual yield and purity of ethyl acetate were sustained at 90–95%, respectively. No obvious deterioration of the catalyst IEC was observed and the IEC of the structured catalyst could be retained at around 0.15 mmol g−1. The θ-ring analogues of the microfibrous catalyst were preserved and the catalyst film remained bound to the surface of the SS-fiber with the same thickness of 0.7 μm as the fresh catalyst even after the 40 h test. These above results suggested that the monolithic structured Nafion–SiO2/SS-fiber catalyst had both excellent activity and structure stability in the CD for ethyl acetate synthesis, offering great potential for future industrial applications. | ||
| Fig. 10 SEM images of (A and B) the monolithic structured Nafion–SiO2/SS-fiber catalyst after five consecutive batch experiments. | ||
Conclusions
A promising thin-sheet microfibrous-structured Nafion–SiO2/SS-fiber solid acid catalyst has been successfully developed and shaped into θ-ring analogous packings as an example for CD synthesis of ethyl acetate from acetic acid and ethanol. By using a dip-coating method with self-crosslinking Nafion–SiO2 sol–gel, Nafion was firmly locked into the SiO2 layer that was anchored onto the SS-fiber surface. This new approach provides a combination of high thermostability, enhanced mass/heat transfer, unique form factors and acceptably high acid density. The further combination of the CD route visibly improved the esterification efficiency and distillation in situ. As a result, such micro-structured Nafion catalysts work effectively and efficiently in the CD for esterification of acetic acid with ethanol. A high total yield of 93.6% as well as a high actual yield of 91.6% of ethyl acetate is obtained with a very high target product purity of 96.2%. Moreover, the microfibrous-structured catalysts are stable for at least 40 h, with not only well-preserved structures but also excellent activity/selectivity maintenance. It is expected that the microfibrous-structured Nafion–SiO2/SS-fiber catalysts will provide great potential for future industrial applications of the analogous reactions and processes.Acknowledgements
This work was financially supported by the NSF of China (21473057, 21273075, U1462129, 21076083) and the “973 Program” (2011CB201403) from the MOST of China.Notes and references
- R. C. Tsai, J. Cheng, H. Huang, C. Yu, Y. Shen and Y. Chen, Ind. Eng. Chem. Res., 2009, 47, 9472–9484 CrossRef.
- J. Bedard, H. Chiang and A. Bhan, J. Catal., 2012, 290, 210–219 CrossRef CAS.
- P. Gupta and S. Paul, Catal. Today, 2014, 236, 153–170 CrossRef CAS.
- A. Molnar, Curr. Org. Chem., 2008, 12, 159–181 CrossRef CAS.
- J. P. Lange, J. Z. Vestering and R. J. Haan, Chem. Commun., 2007, 3488–3490 RSC.
- D. W. Lee and K. Y. Lee, Catal. Surv. Asia, 2014, 18, 55–74 CrossRef CAS.
- M. Alvaro, A. Corma, D. Das, V. Fornés and H. García, J. Catal., 2005, 231, 48–55 CrossRef CAS.
- K. Suwannakarn, E. Lotero and J. G. Goodwin, Ind. Eng. Chem. Res., 2007, 46, 7050–7056 CrossRef CAS.
- W. Shen, Y. Gu, H. Xu, R. Che, D. Dubé and S. Kaliaguine, Ind. Eng. Chem. Res., 2010, 49, 7201–7209 CrossRef CAS.
- F. Su and Y. Guo, Green Chem., 2014, 16, 2934–2957 RSC.
- A. Molnar, Curr. Org. Chem., 2011, 15, 3928–3960 CrossRef CAS.
- Y. Liu, E. Lotero and J. G. Goodwin, J. Catal., 2006, 242, 278–286 CrossRef CAS.
- D. E. López, J. G. Goodwin and D. A. Bruce, J. Catal., 2007, 245, 381–391 CrossRef.
- P. S. Metkar, E. J. Till, D. R. Corbin, C. J. Pereira, K. W. Hutchenson and S. K. Sengupta, Green Chem., 2015, 17, 1453–1466 RSC.
- X. Zhang, S. Zhang and C. Jian, Chem. Eng. Res. Des., 2011, 89, 573–580 CrossRef CAS.
- E. Wang, C. Li, L. Wen and E. Min, AIChE J., 2005, 51, 845–853 CrossRef CAS.
- I. Lai, Y. Liu, C. Yu, M. Lee and H. Huang, Chem. Eng. Process., 2008, 47, 1831–1843 CrossRef CAS.
- S. Bhatia, A. R. Mohamed, A. L. Ahmad and S. Y. Chin, Comput. Chem. Eng., 2007, 31, 1187–1198 CrossRef CAS.
- A. A. Kiss, A. C. Dimian and G. Rothenberg, Energy Fuels, 2008, 22, 598–604 CrossRef CAS.
- N. Semagina, M. Grasemann, N. Xanthopoulos, A. Renken and K. M. Lioubov, J. Catal., 2007, 251, 213–222 CrossRef CAS.
- A. Górak and A. Hoffmann, AIChE J., 2001, 47, 1067–1076 CrossRef.
- M. Klöker, E. Y. Kenig, A. Górak, A. P. Markusse, G. Kwant and P. Moritz, Chem. Eng. Process., 2004, 43, 791–801 CrossRef.
- X. Gao, F. Wang, R. Zhang, H. Li and X. Li, Ind. Eng. Chem. Res., 2014, 53, 12793–12801 CrossRef CAS.
- J. E. Samad, J. A. Nychka and N. V. Semagina, Chem. Eng. J., 2011, 168, 470–476 CrossRef CAS.
- X. Wang, M. Wen, C. Wang, J. Ding, Y. Sun, Y. Liu and Y. Lu, Chem. Commun., 2014, 50, 6343–6345 RSC.
- Y. Liu, H. Wang, J. Li, Y. Lu, Q. Xue and J. Chen, AIChE J., 2007, 53, 1845–1849 CrossRef CAS.
- G. Zhao, Y. Li, Q. Zhang, M. Deng, F. Cao and Y. Lu, AIChE J., 2014, 60, 1045–1053 CrossRef CAS.
- W. Chen, W. Sheng, G. Zhao, F. Cao, Q. Xue, L. Chen and Y. Lu, Int. J. Hydrogen Energy, 2012, 37, 18021–18030 CrossRef CAS.
- Q. Zhang, Y. Li, L. Zhang, L. Chen, Y. Liu and Y. Lu, J. Catal., 2014, 317, 54–61 CrossRef CAS.
- M. Ling, G. Zhao, W. Chen, M. Wang, Q. Xue and Y. Lu, Int. J. Hydrogen Energy, 2011, 36, 12833–12842 CrossRef CAS.
- I. Yuranov, A. Renken and K. M. Lioubov, Appl. Catal., A, 2005, 281, 55–60 CrossRef CAS.
- G. Ye, C. A. Hayden and G. R. Goward, Macromolecules, 2007, 40, 1529–1537 CrossRef CAS.
- M. A. Harmer, Q. Sun, A. J. Vega, W. E. Farneth, A. Heidekum and W. F. Hoelderich, Green Chem., 2000, 2, 7–14 RSC.
- J. K. Satyarthi, D. Srinivas and P. Ratnasamy, Energy Fuels, 2010, 24, 2154–2161 CrossRef CAS.
- B. Saha, S. P. Chopade and S. M. Mahajani, Catal. Today, 2000, 60, 147–157 CrossRef CAS.
- H. Li, M. Ai, F. Jiang, L. Yu, H. Tu, Q. Yu and H. Wang, J. Power Sources, 2011, 196, 4583–4587 CrossRef CAS.
- Y. Wei, L. Shen, Z. Wang, W. Yang, H. Zhu and H. Liu, Int. J. Hydrogen Energy, 2011, 36, 5088–5095 CrossRef CAS.
- J. Wang, L. Xiao, Y. Zhao, H. Wu, Z. Jiang and W. Hou, J. Power Sources, 2009, 192, 336–343 CrossRef CAS.
- K. G. Gnana, A. R. Kim, K. S. Nahm and Y. D. Jin, Curr. Appl. Phys., 2011, 11, 896–902 CrossRef.
- H. S. Thiam, W. W. Daud, S. K. Kamarudin, A. B. Mohamad, A. A. H. Kadhuma, K. S. Loh and E. H. Majlana, Int. J. Hydrogen Energy, 2013, 38, 9474–9483 CrossRef CAS.
- Y. Wang, R. H. Colby and D. Kim, J. Membr. Sci., 2011, 366, 421–426 CrossRef CAS.
- D. Aili, M. K. Hansen, C. Pan, Q. Li, E. Christensen, J. O. Jensen and N. J. Bjerrum, Int. J. Hydrogen Energy, 2011, 36, 6985–6993 CrossRef CAS.
- A. Ciftci, N. A. Sezgi and T. Dogu, Ind. Eng. Chem. Res., 2010, 49, 6753–6762 CrossRef CAS.
- Y. Tavana, R. M. Behbahani and S. H. Hosseini, Chem. Eng. Process., 2013, 73, 81–86 CrossRef.
Footnote |
| † Electronic supplementary information (ESI) available: Experimental details, preparation of the catalyst and content change of ethyl acetate during the reaction evaluation; Table S1 and Fig. S1–S7. See DOI: 10.1039/c6re00088f |
| This journal is © The Royal Society of Chemistry 2016 |

