
Process analytical technology (PAT) applied to biomass valorisation: a kinetic study on the multiphase dehydration of xylose to furfural†
T.
Eifert
and
M. A.
Liauw
*
Institut für Technische und Makromolekulare Chemie, RWTH Aachen University, Worringerweg 1, 52074 Aachen, Germany. E-mail: liauw@itmc.rwth-aachen.de; Tel: +49 241 80 26470
First published on 8th July 2016
Abstract
We present a methodology for evaluating the kinetic parameters of biomass transformations employing process analytical technology (PAT). The salient feature of this strategy involves the determination of reaction rates and activation energies for biomass conversions under process conditions without influence from possible side reactions or fouling of optical probes. PAT was applied to the dehydration of the C5-sugar xylose to the platform chemical furfural as a model reaction system. The reaction was monitored in situ in a biphasic 2-methyltetrahydrofuran/water (2-MTHF/H2O) system by ATR mid-IR and Raman spectroscopy at different reaction temperatures. We evaluated the reaction kinetics for the dehydration of xylose to furfural and the side reaction of humin formation by chemometric and kinetic modelling of the inline data. The activation energy for xylose dehydration (151 ± 3 kJ mol−1) was slightly higher than that for humin formation (139 ± 7 kJ mol−1). This insight allowed for the proposal of an optimised reactor concept to maximise the yields of furfural and minimise the production of humins.
Introduction
The use of biomass for the production of value-added chemicals and fuels is a promising possibility to meet future society needs with renewable resources.3–5 Lignocellulosic biomass represents a suitable feedstock, because it is the major component of terrestrial biomass and it is not in competition with food supply.3,6 Crucial steps within a lignocellulosic biorefinery involve the conversion of C5- and C6-sugars (e.g. xylose, glucose) derived from hemicellulose and cellulose to platform chemicals such as furfural and 5-hydroxymethylfurfural.7–9Biomass-based production routes compete with established, heavily optimised processes, e.g. the value chain of the petrochemical industry. Thus, synthesis steps based on lignocellulose have to be optimised while taking into account the principles of green chemistry to ensure sustainable valorisation of a sustainable feedstock. Biomass conversion reactions involve complicated reaction profiles in which the determination of kinetic parameters allows for a knowledge-driven optimisation by an improved control of the reaction network. Referring to the 11th principle of green chemistry,11 real-time analysis can be used for pollution prevention, but it can furthermore be used as a tool for obtaining kinetic data under process conditions.
Process analytical technology (PAT) involves the application of in-process, real-time analytics and chemometrics for monitoring chemical or physical attributes that cannot be derived from conventional physical variables like temperature or pressure.14,15 PAT tools offer a wide variety of non-invasive methods, such as UV/Vis, mid-IR or Raman spectroscopy, for obtaining kinetic data under process conditions. This avoids misleading conclusions due to distortions of reaction mixtures caused by sampling (e.g. change in phase behaviour, phase equilibria or course of the reaction).16
To date, only a few studies on the use of PAT tools for kinetic investigations in the field of biomass valorisation have been published.17–22 Weckhuysen and co-workers investigated the mechanism of the hydrolysis of cellulose in water using mid-IR spectroscopy.17 Exarhos and co-workers used in situ Raman and NMR spectroscopy for the kinetic investigation of the dehydration of glucose and fructose toward the formation of carbon spheres.18 NMR spectroscopy has also been used for kinetic19 or mechanistic20 studies of the conversions of glucose to 5-hydroxymethylfurfural or fructose to 5-hydroxymethylfurfural, respectively. To the best of our knowledge, PAT has not been previously used to simultaneously determine the kinetic parameters for the dehydration of C5- or C6-sugars and for the formation of side products.
Herein, we present the application of PAT toward the dehydration of xylose to furfural (Fig. 1).23 Furfural is an important platform chemical derived from C5-monosaccharides; however, its formation is complicated by the side reaction to humins.23 This is especially true for syntheses performed in aqueous acidic media.24–26 Humins are crosslinked polymers, consisting primarily of furan moieties, that are mostly insoluble in aqueous and organic phases and tend to stick to surfaces.27–30 As such, humin formation can affect the applicability of PAT tools due to polymerisation of the humins on the tips of immersion probes. We took into account the fouling of optical probes, which ensured the reliable application of PAT for kinetic process investigations of biomass-based reactions involving side reactions.
 | ||
| Fig. 1 Dehydration of xylose to furfural catalysed by iron(II) or (III). | ||
Thus, in situ reaction monitoring of the dehydration of xylose to furfural using UV/Vis, mid-IR and Raman spectroscopy allowed for the development of a methodology for extracting kinetic information from inline data of the mentioned PAT tools while humin formation and fouling are present. This technique allowed for the determination of the kinetic parameters of both the dehydration of xylose and the formation of humins. Establishment of these kinetic data enabled a knowledge-driven proposal for the design of a suitable reactor to maximise the selectivity. An improved control of the reaction network minimises humin formation and favours the formation of furfural.
Results and discussion
Model reaction system
The examined model reaction system from xylose to furfural exhibits high economic and environmental potential due to the use of inexpensive iron catalysts. Xylose was dehydrated in a biphasic mixture of 2-methyltetrahydrofuran (2-MTHF) and water using FeSO4 as a catalyst employing a reaction system that has been previously reported by Leitner and co-workers (Fig. 2).23 With respect to the green chemistry rules, FeSO4 is biocompatible to the extent that it is being used as a fertilizer in the agricultural sector.31 In our work, the same organic/aqueous biphasic system was used for extraction of the furfural product into the 2-MTHF phase, thereby improving the product selectivity because the side reaction to humins occurs mostly in the acidic aqueous phase. | ||
| Fig. 2 Dehydration of xylose to furfural and extraction of furfural into the organic phase monitored with fiber optical probes (red: ATR mid-IR probe, grey: Raman probe) in both phases (blue: aqueous phase; yellow: organic (2-MTHF) phase). | ||
The concentrations of the substrate (1.2 mol L−1) and catalyst (10 mol%), the reaction temperature (120–160 °C) and time were similar to the reported literature procedure.23 The used reaction temperature was in the range of the reported reaction parameters.24 Higher temperatures (200–250 °C) are known to provide higher yields,24 while biphasic systems show higher yields only at temperatures between 140–170 °C which is true for the investigated system.23,24 We performed the investigations for this manuscript at temperatures between 120–160 °C to ensure a proper determination of the reaction rates with respect to the heating rate. The initial heating period to reach the reaction temperatures above 160 °C was too long to collect proper inline data for an initial reaction profile.32
The selectivity of the reaction towards furfural was ca. 50%, while the conversion varied between 20–80%, depending on the temperature and the reaction time (see section 1, ESI†). Thus, the investigated reaction is a suitable model reaction system that is comparable to the published results of sugar dehydration reactions.8,24
Spectroscopic feasibility
Initial studies examined the feasibility of using in situ spectroscopic measurements to follow the course of this reaction and to ensure good correlation and causality with the spectral information. In principle, xylose could be analysed by ATR mid-IR and Raman spectroscopy and furfural could be analysed by ATR UV/Vis, ATR mid-IR and Raman spectroscopy. Pure component spectra of xylose in water and furfural in water and in 2-MTHF were compared with literature spectra to identify the analysable spectral signals (see section 2, ESI†).This comparison led to the use of ATR mid-IR and Raman spectroscopy as useful PAT tools. The most valuable spectral information was available in the mid-IR spectra of the aqueous phase. Despite the strong absorbance of water, the xylose signal was suitable for reaction monitoring in the required concentration region. In Fig. 3, the signal of xylose in the mid-IR fingerprint area between 1000–1200 cm−1 with an intensity maximum at 1047 cm−1 is composed of deformation and stretching vibrations. Only the sulphate vibration of the catalyst overlapped with the xylose signal; however, chemometric evaluation of the spectra was possible as this peak remains constant during the reaction.
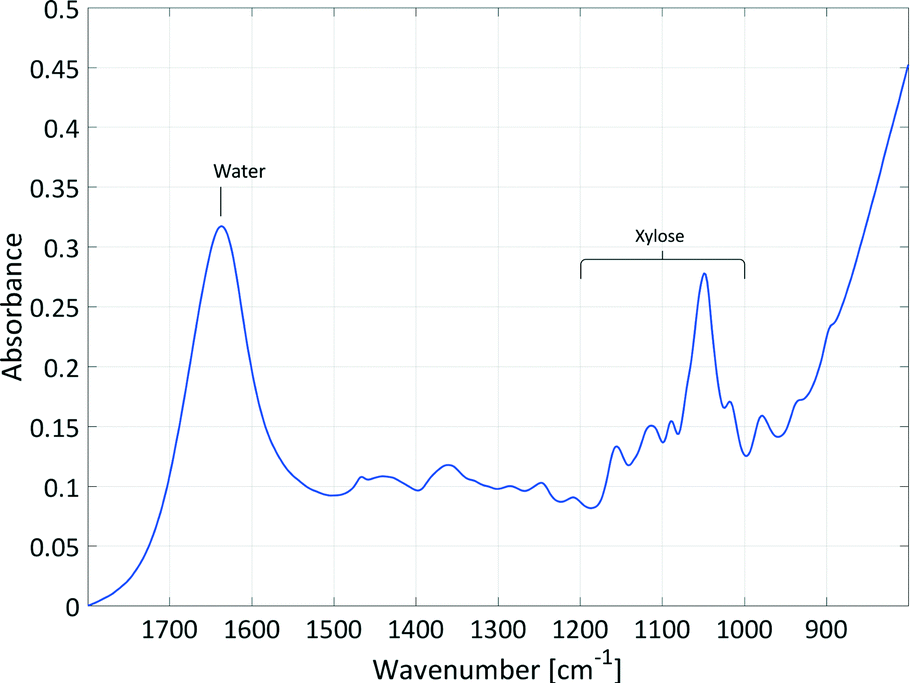 | ||
| Fig. 3 Mid-IR spectrum of xylose (c = 1.1 mol L−1, T = 25 °C) in water with xylose absorptions in the fingerprint region between 1000–1200 cm−1 with an intensity maximum at 1047 cm−1 and water absorption with an intensity maximum at 1635 cm−1. | ||
Since the fingerprint area from about 500–1500 cm−1 contains a series of different absorptions, it is difficult to pick out individual absorption peaks and assign them to a specific bond. To obtain bonding information from the signal of xylose in the mid-IR fingerprint area between 1000–1200 cm−1 anyhow, the spectrum of xylose in water was calculated by DFT (see section 2, ESI†) and compared to the literature data.33,34 The strongest absorption at 1047 cm−1 could be assigned to the C–O–C stretching vibrations of the cyclic ether in the pyranose ring. The four smaller peaks in the analysed spectral area at 1018 cm−1, 1088 cm−1, 1113 cm−1 and 1155 cm−1 are each caused by C–OH stretching vibrations. All five peaks also exhibited deformation vibrations with the main focus on the adjacent R–C–H and R–O–H bonds.
Real-time monitoring
The dehydration of xylose was monitored in real-time using mid-IR and Raman spectroscopy, in which spectra were recorded simultaneously in both the organic and the aqueous phases (Fig. 2). The change in the spectral information was analysed over the course of the reaction using all four spectral data sets. Thus, the system was evaluated sufficiently with respect to the number of reactants, the reaction and extraction processes.Since most information about the reaction kinetics can be obtained by analysing the xylose peak in the mid-IR spectra of the aqueous phase, we focus our discussion on these data. The time-dependent changes in the aqueous phase monitored by ATR mid-IR and the resulting discussion are always qualitatively supported by the mid-IR spectra of the organic phase and the Raman spectra of both phases.
Fig. 4 shows the development of the xylose peak over the course of the reaction in the mid-IR fingerprint region as an example of qualitative reaction progress. At the beginning of the reaction, the signal of xylose at 1047 cm−1 decreased due to the dehydration reaction (dark blue). The initial decrease of this signal slowed down (light blue) due to the production of humins. The formed humins showed a significant absorption in the region of the xylose peak at 1047 cm−1, because the absorptions of the first humin oligomers show similarities to the absorptions of their monomers.29 Then, the signal at 1047 cm−1 began to increase again towards the end of the reaction (yellow to red). The last spectra differed from the initial spectra by showing two peaks in the region of the xylose signal and a broad absorption between 1200 cm−1 and 1400 cm−1 (starting at t = 50 min, see Fig. 4). These absorptions originated from humins that deposited on the surface of the internal reflection element (IRE, a diamond in this case) at the tip of the ATR probes. The absorptions showed strong similarities with the literature mid-IR spectra of humins.27,28,30 GC, HPLC and NMR (see section 3, ESI†) showed no other significant by-product formation, and thus, these absorptions were attributed to the production of humins.
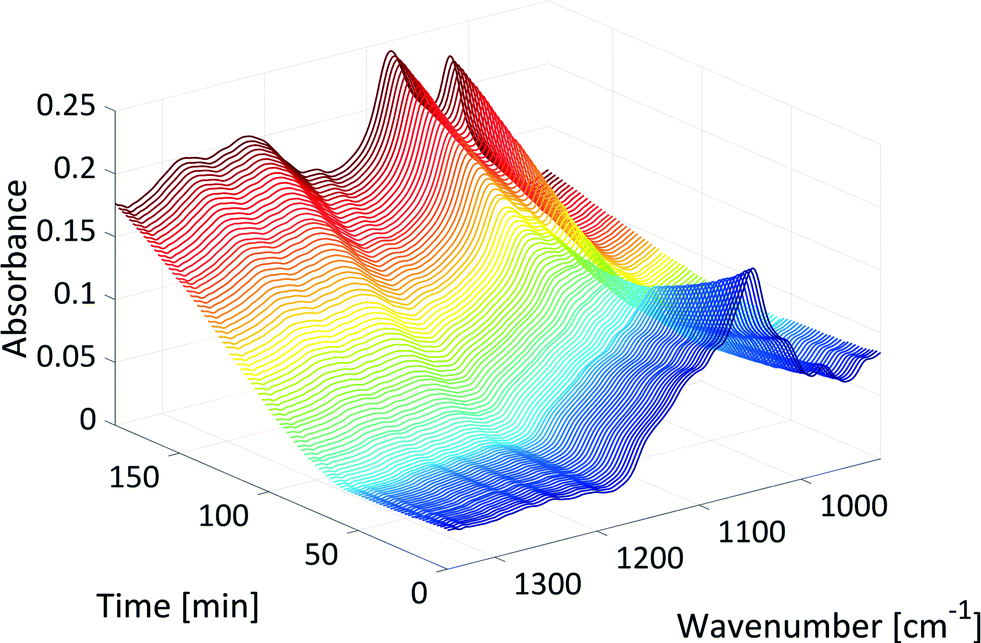 | ||
| Fig. 4 Xylose peak in the mid-IR fingerprint region over the course of the reaction (T: 150 °C, colour: increase in reaction time). | ||
Regarding the bonding information, at the beginning of the reaction, the whole signal of xylose in the mid-IR fingerprint area between 1000–1200 cm−1 decreased even though the product furfural also showed a strong absorption peak, the C–O–C stretching vibrations of the cyclic ether. This may indicate that furfural was formed and immediately extracted into the organic phase. At the end of the reaction, the absorptions between 1200 cm−1 and 1400 cm−1 could be assigned to C–O–C stretching vibrations30 of humins that showed the presence of ether bonds within the humins probably because of etherification.27 The peak at 1047 cm−1 divided into, or was overlapped by, two humin originated peaks at 1018 cm−1 and 1076 cm−1 that could be assigned to C![[double bond, length as m-dash]](https://www.rsc.org/images/entities/char_e001.gif) C furan ring deformation vibrations28,30 and C–O stretching vibrations in alcohols,27 respectively.
C furan ring deformation vibrations28,30 and C–O stretching vibrations in alcohols,27 respectively.
Increasing the reaction temperature accelerated the dehydration of xylose to furfural which was observed in the mid-IR data. The xylose peak decreased (dark blue in Fig. 4) more quickly at 160 °C compared to 150 °C or even 120 °C. Higher temperatures also increased the reaction rate or the formation of humins. Thus, the initial decrease of the xylose peak (light blue in Fig. 4) slowed down more quickly, and the signal between 1200 cm−1 and 1400 cm−1 (starting at t = 50 min in Fig. 4) increased more quickly at 160 °C compared to those at lower temperatures.
These findings were supported by the Raman data. The dehydration of xylose, the formation of furfural and the production of humins were analysed in the spectra. As humins are crosslinked polymers composed of furan moieties,28 they led to a weak and broad fluorescence signal in the Raman spectra (see section 4, ESI†). We evaluated this fluorescence signal by analysing a signal which was caused by the sapphire at the tip of the probes (see section 5, ESI†). The intensity of the sapphire peak at 748 cm−1 should not vary during the reaction because sapphire is an inert material under the reaction conditions. Thus, the changes in this signal originated from humins that were produced during the reaction.
Initially, the sapphire signal showed no strong deviations; however, subsequently, the baseline under the sapphire peak exhibited a strong increase due to fluorescence. This change in the sapphire signal occurred when the initial decrease of the xylose peak in the mid-IR began to slow down (light blue in Fig. 4). As the reaction continued, the fluorescence increased and the baseline under the sapphire peak increased to the detection limit of the Raman spectrometer (see section 4, ESI†). Thus, the integral of the sapphire peak with a corrected baseline started to decrease at this time of the reaction. When this happened, the broad absorption in the mid-IR spectra between 1200 cm−1 and 1400 cm−1 increased due to the humins that began depositing on the surface of the optical probes.
The information about the production and deposition of humins from the Raman spectra allowed us to distinguish between xylose formation and humin formation in the mid-IR spectra. The combination of both PAT methods allowed us to classify the spectral data with respect to the origin of the signal in the spectra. Thus, the kinetics of the dehydration of xylose and the production of humins could be observed from the inline data by chemometric and kinetic modelling.
Chemometric modelling
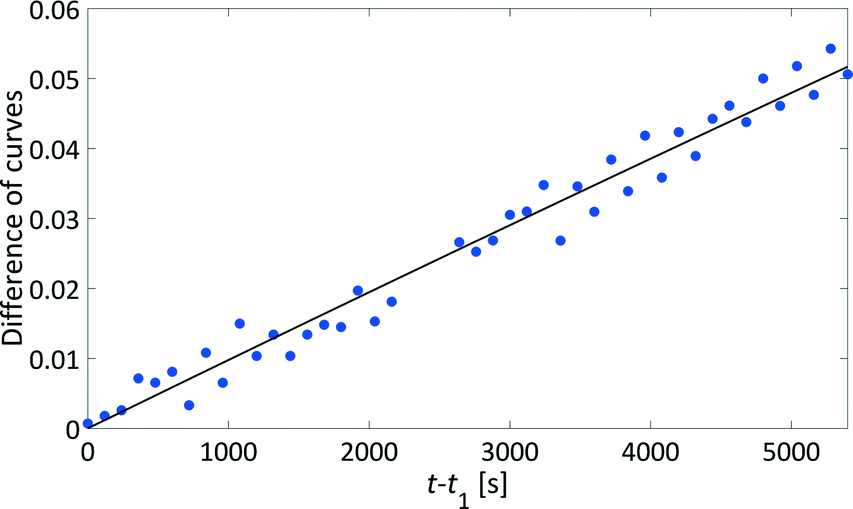
Right after the beginning of the reaction (t0), the changes in the mid-IR spectra originated from only the consumption of xylose. We defined the time as t1 before humin formation became significant in the mid-IR spectra and the initial decrease of the xylose peak in the mid-IR began to slow down (light blue in Fig. 4). The exact time frame was determined by the Raman spectra of the aqueous phase for each reaction. At t1, the baseline under the sapphire peak exhibited a strong increase due to fluorescence caused by the production of humins. After t1, xylose consumption and humin formation were superimposed in the experimental data. t2 was defined as the time when the humin deposition on the surface of the optical probes began and the broad absorption in the mid-IR spectra between 1200 cm−1 and 1400 cm−1 increased. t2 was determined as the time in which the integral of the sapphire peak in the Raman spectra with a corrected baseline started to decrease.To evaluate the initial conversion of xylose (dark blue in Fig. 4), the integral of the xylose peak at 1047 cm−1 in the mid-IR spectra was analysed between t0 and t1. Chemometric peak integration (PI) models were used to obtain concentration time profiles. The PI model of the xylose peak at 1047 cm−1 led to an integral that is proportional to the concentration according to the Lambert–Beer law. This PI model was calibrated in the range of 0.4–1.3 mol L−1, which covered the concentration of xylose during the reaction. Temperature effects and small amounts of the product furfural were taken into account.
To evaluate the PI model by conventional offline HPLC analysis, xylose dehydration was monitored inline for different reaction times at 140 °C. At the end of each reaction, the reaction mixture was cooled down, and a sample of the lower, aqueous phase was taken and analysed offline via HPLC. Sampling of 1 mL of one phase of a biphasic mixture influences the phase behaviour significantly.16 Therefore, only one sample was taken at the end of the reaction to avoid perturbations and obtain reliable analysis results. The xylose concentrations determined offline were used to display the conversion of the reaction over time in Fig. 5. The last spectrum of each experiment was evaluated with the calibrated PI model to determine the conversion from the inline data (see Fig. 5).
 | ||
| Fig. 5 Comparison of the conversion of xylose at 140 °C determined by conventional HPLC analysis and by the calibrated PI model based on inline ATR mid-IR spectra (black square: t0; grey line: region of t1; red diamonds: inline data; blue triangles: offline data). | ||
At the beginning of the reaction, between t0 and t1, the inline data of the PI model was very well reproduced by the offline HPLC method. After t1, both methods started to deviate because of the above discussed reasons, and therefore, the kinetic modelling of xylose dehydration relied on the inline data between t0 and t1. The first data point at 15 min showed a slightly higher conversion from the offline data compared to the inline data which could have originated from continuous conversion during the cooling period. The inline data was collected as closely as possible to the process conditions and therefore did not have deviations between sampling and analysis conditions. Furthermore, the number of data points determined by HPLC was still not sufficient to perform a reliable kinetic modelling, while each inline data point resembles a set of concentration–time profiles that can be used for kinetic modelling. However, the offline methods were still used to also determine the conversion and yield offline.
Kinetic modelling
The kinetics of xylose dehydration and humin formation in the investigated biphasic system were evaluated according to the proposed reaction scheme in Fig. 6. The overall mechanism is based on published reaction schemes such as the one described by Weingarten et al.,1 while we focused on the initial changes in the inline data for the kinetic modelling. The reaction of the biphasic system was at constant volume and was operated in an isothermal manner.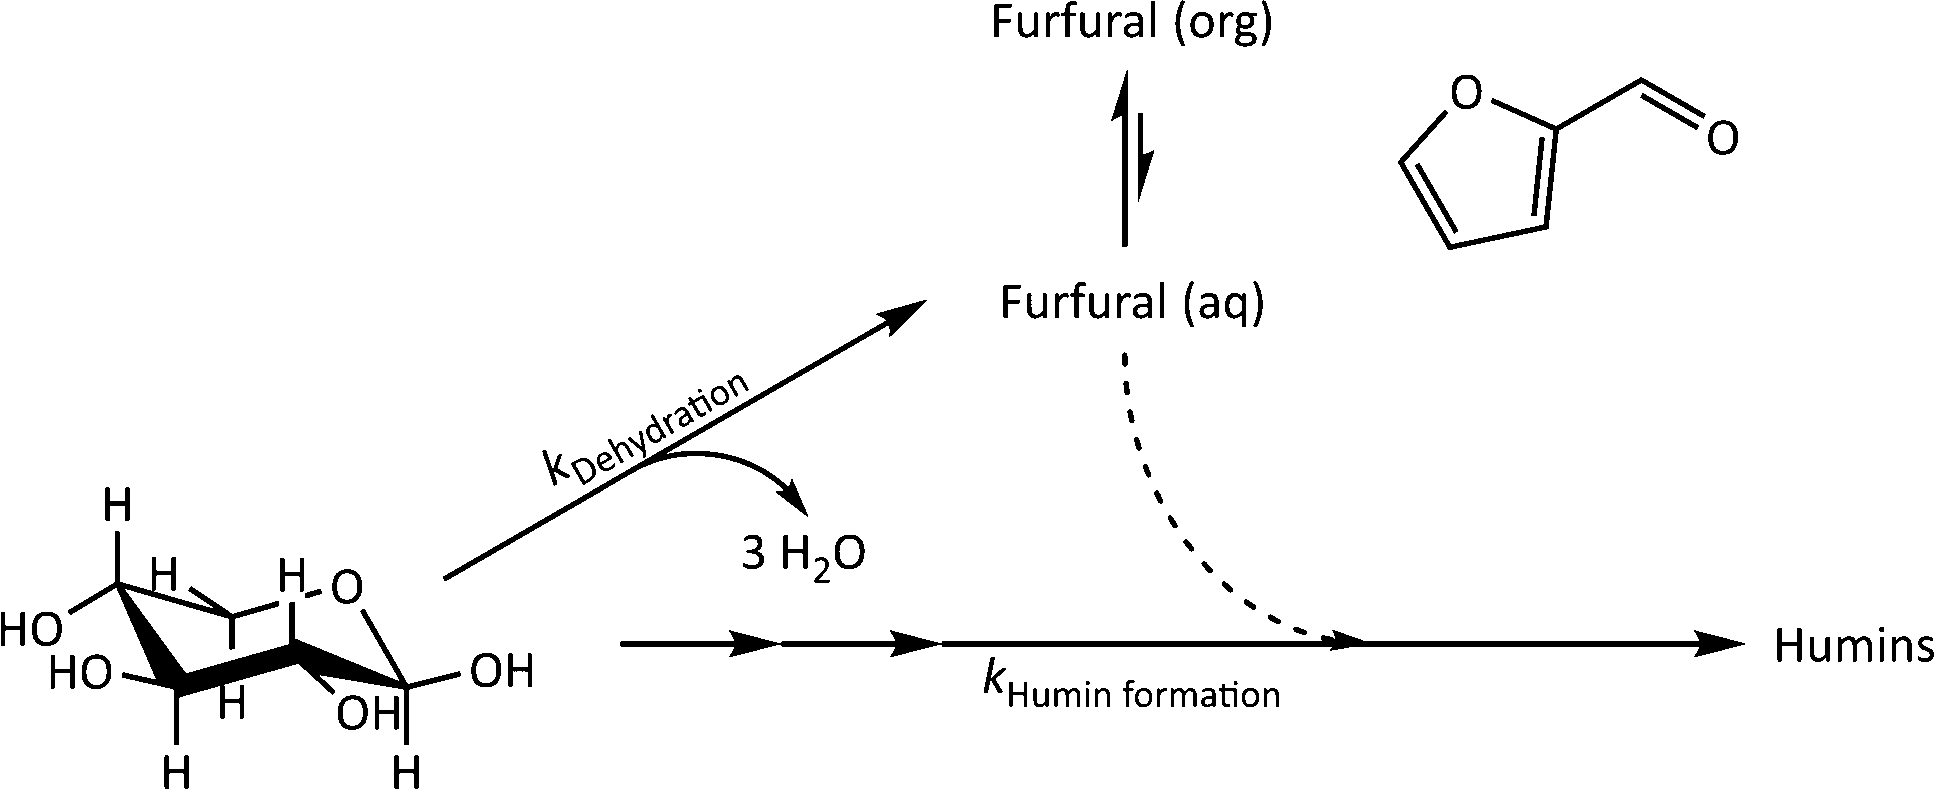 | ||
| Fig. 6 Overall mechanism of the reaction system focusing on the dehydration of xylose (kDehydration) and the formation of humins (kHumin formation) for the kinetic modelling. | ||
The dehydration of xylose could be generally described by eqn (1) according to the overall reaction mechanism (see Fig. 6). At the beginning of the reaction, the major process was the irreversible dehydration of xylose to furfural described by eqn (2). Starting from pyranose substrates such as xylose or glucose, the oligomerisation to humins can only occur after isomerisation steps from the respective pyranose.26 Between t0 and t1, the dehydration to furfural (eqn (2)) was assumed to be fast compared to all other reaction steps because of the high xylose concentration compared to other reactants. Since the amount of the catalyst was not varied, the concentration was constant and was incorporated in the rate constant. After t1, the humin formation was described by eqn (3) as an irreversible reaction. It may e.g. be that it is rather xylose isomers that are the real substrates, which need time (t1) to be formed in significant concentrations.
| dcXylose/dt = − (kDehydration + kHumin formation)·cXylose | (1) |
| dcXylose/dt|t<t1 = − kDehydration·cXylose | (2) |
| dcHumins/dt|t≥t1 = kHumin formation·cXylose | (3) |
| cHumins/cXylose,0 = 1 − exp(−kHumin formation·t) | (4) |
Mass transfer did not affect the observed kinetics. The substrate and the catalyst were only present in the aqueous phase and dehydration of xylose occurred solely in the aqueous phase. The modelled kinetics according to eqn (2) and (4) relied on the inline analysis of the aqueous phase. The organic extraction phase was downstream with respect to the consumption of the substrate. Weingarten et al. describe a similar reaction system in which the organic extraction phase served as a depot (or “storage”) for furfural where it did not undergo consecutive reactions.1
Kinetics of xylose dehydration
The rate law for a first order reaction (eqn (2)) leads to an exponential decay of the concentration with time, c = c0·e(−k·t). However, since the integral of a spectral signal is proportional to the concentration, I ∼ c, and the unit of a first order reaction rate constant is per second, the rate law can be adapted to the integral of a peak dI/dt = −k·I. This leads to I = I0·e(−k·t). Both mathematical expressions can be used to evaluate the activation energy of a reaction with the Arrhenius equation k = A0·e(−EA/RT).The initial reaction rate of xylose dehydration was determined at different temperatures with the help of chemometric PI models. First order reaction kinetics were fitted to the experimental concentrations or integral values. In Fig. 7, the initial decay of the xylose concentration shows a linear behaviour in the modelled time frame (solid black line between t0 = 0 s and t1 = 2280 s). This was true for all evaluated reactions at different temperatures. The reaction rate constants increased with temperature; thus, xylose dehydration was faster at higher temperatures. Using the reaction rate constants for xylose dehydration at different temperatures, the temperature dependence of xylose dehydration was modelled with an Arrhenius equation (Fig. 8).
 | ||
| Fig. 7 Analysing the xylose dehydration at 140 °C: apparent concentration of xylose analysed by the mid-IR spectra over the course of time (red circles) with a kinetic fit (solid black line) from t0 = 0 s to t1 = 2280 s (dashed black line). After t1, the determined apparent xylose concentration differs from the kinetic fit due humin formation (grey hatched area). | ||
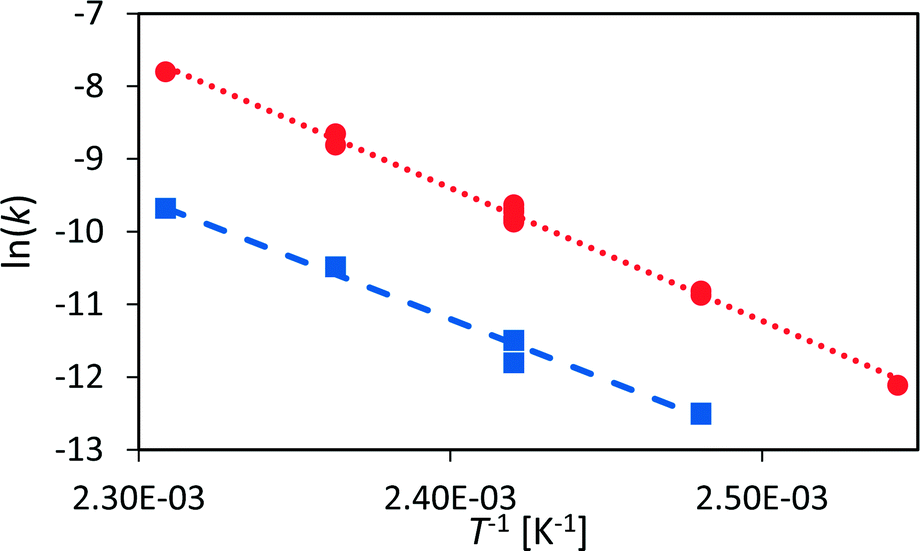 | ||
| Fig. 8 Arrhenius diagram for the dehydration of xylose to furfural (red circles) and for humin formation (blue squares). | ||
The Arrhenius plot shows good linearity between the logarithm of the reaction rate of xylose dehydration and the inverse of temperature. The activation energy, modelled with the calibrated PI model, was 151 ± 3 kJ mol−1. The activation energy with respect to the non-calibrated PI model was the same within the experimental error. If the activation energy of a reaction is the main aspect of interest, the PI model does not need time-consuming calibration to obtain accurate quantitative kinetic data. Furthermore, the error of the Arrhenius plot was small compared to the obtained activation energy.
However, the kinetic modelling was carried out within a fairly narrow temperature range. The slope (EA) of a model fitted to experimental data points (k) which do not span a wide temperature range might be sensitive to the experimental error of the data points. Therefore, a sensitivity analysis with respect to the influence of the variance of the reaction rate constant on the determined activation energy was performed (see section 6, ESI†). The kinetic modelling was only slightly sensitive to variances in the reaction rate constants with most values of EA distributed between 148–154 kJ mol−1 which resemble the error of the kinetic fitting according to the Arrhenius equation. This led to the conclusion that the presented PAT methodology is a robust method to investigate sugar dehydration reactions in the field of biomass conversion.
Since the first kinetic and mechanistic investigations of xylose dehydration by Hurd et al. in 1932,37 several kinetic studies on the dehydration of xylose to furfural have been published. In these studies, the determined activation energies for the dehydration of xylose vary significantly, in the range from 124 kJ mol−1 to 152 kJ mol−1.1,2,10,12,13 Danon et al.24 point out that the validity of most of the literature data is restricted to the specific catalyst and conditions used by each author. To compare our results of the employed Fe2+ catalyst with the broad range of literature known values, Table 1 shows the specific literature known reaction systems and their activation energies and yields. The activation energy that we determined coincides with the upper limit of this broad range of literature values. The yield of our reaction system is roughly the average of the presented literature values which shows that the performance of the analysed reaction system is comparable to literature known systems. Our data was obtained by using inline spectra that were recorded under process conditions. The PI data of these spectra was analysed by fitting only one reaction rate, that of the first order dehydration kinetics. Thus, the non-invasive method we used reflects the actual process as closely as possible, which is a hint for gaining highly accurate kinetic data. Another reason for the observed variance between the literature data might be the use of sampling data, which often does not take into account the difference in phase behaviour between reaction and analysis conditions.16
| Ref. | T/°C | c (xylose) | Cat. | Solv. | E A | Y max |
|---|---|---|---|---|---|---|
| a Maximum yield achieved in the temperature range used for the modelling. b Divided up into 96.7 kJ mol−1 for isomerisation of xylose to xylulose and 64.9 kJ mol−1 for dehydration of xylulose. | ||||||
| This paper | 120–160 | 1.2 mol L−1 (10 wt%) | FeSO4, 10 mol% | H2O/2-MTHF | 151 kJ mol−1 | 44%, 140 °C |
| Weingarten et al.1 | 140–160 | 10 wt% | HCl, 0.1 mol L−1 | H2O/MIBK | 124 kJ mol−1 | 50%, 160 °C |
| Lamminpää et al.2 | 130–200 | 0.2 mol L−1 | HCOOH, 30 wt% | H2O | 152 kJ mol−1 | 35%, 160 °C |
| O'Neill et al.10 | 140–220 | 10 wt% | ZSM-5, 0.3 wt% | H2O | 134 kJ mol−1 | 46%, 200 °C |
| Rojas12 | 130–170 | 0.2–0.27 mol L−1 | HCOOH, 31 wt% | H2O | 140 kJ mol−1 | 45%, 150 °C |
| Choudhary et al.13 | 105–145 | 1 wt% | CrCl3, 6 mmol L−1; HCl, 0.1 mol L−1 | H2O/toluene | 133b kJ mol−1 | 38%, 145 °C |
The catalytic activity of the iron based catalyst, FeSO4, was also compared against the more conventional xylose dehydration system involving the use of an acid catalyst, H2SO4. Within a comparable pH range (pH = 3.0), the dehydration of xylose at 140 °C catalysed by H2SO4 (kDehydration = 7.60 × 10⁻⁶ s−1) was slower than that for FeSO4 (kDehydration = 5.81 × 10⁻⁵ s−1) by an order of magnitude. The improved catalytic activity of the iron salt compared to the respective acid leads to the higher reaction rate constants which we obtained using inline data. This enhancement of activity by metal salts is literature known24 and is not further discussed in this work.
Kinetics of humin formation
We have developed a kinetic model for xylose dehydration that showed a good comparison with the experimental xylose consumption between t0 and t1. Between t1 and t2, the difference between that kinetic model (dashed line in Fig. 7) and the experimental data revealed a progression that corresponded to the humin formation. This was true for every experiment and originated from increased humin formation that increased its significance with respect to the absorption in the mid-IR spectra. In principle, xylose dehydration continued after t1, but the spectral data from humin formation were superimposed. The xylose concentration had to be considered as apparent concentration after t1 because the humin formation led to deviations of the PI model with respect to the true xylose concentration. Thus, at the end of the reaction (130 min), the PI models revealed a conversion of xylose of 31%, while the offline HPLC analysis showed a conversion of 43% (see Fig. 5). This deviation is marked as a grey hatched area in Fig. 7. The conversion modelled with the kinetic model resulted in a conversion of 37% which was significantly closer to the offline analysis. The remaining difference between the inline data and the offline analysis could be explained by the continuous conversion during the cooling period during the offline analysis. Furthermore, increasing influence of humin formation to xylose conversion was not incorporated into the kinetic model for xylose dehydration.While the humins had not yet accumulated on the surfaces of the optical probes, the kinetic modelling of the difference between the experimental data and the kinetic model for xylose dehydration led to the initial kinetics of humin formation (Fig. 9). First order reaction kinetics were fitted to the data according to eqn (4). The initial increase of the differential data showed a linear behaviour between t1 and t2. Thus, we modelled the humin formation as a side reaction to the dehydration from xylose to furfural.
 | ||
| Fig. 9 Analysing the humin formation at 140 °C: difference between the kinetic model and the apparent xylose concentration determined by analysing the mid-IR spectra (grey triangle in Fig. 7) which refer to the humin formation over the course of time (blue circles) with a kinetic fit (solid black line). | ||
Similar to xylose dehydration, humin formation also showed reaction rate constants that increased with reaction temperature. As such, the time frame between t0 and t1 decreased with temperature as the formation of humins was faster at higher temperatures. At 140 °C, t1 was ca. 2000 s, while at 150 °C t1 was significantly reduced to ca. 1000 s. The reaction rate constants of the humin formation between 130 °C and 160 °C were used to determine the activation energy for the production of humins (Fig. 8). Again, the Arrhenius plot showed a linear correlation between the reaction rate of humin formation and temperature. The modelled activation energy was 139 ± 7 kJ mol−1. Thus, the activation energy for the formation of humins was of the same order of magnitude as that for xylose dehydration, albeit slightly lower taking the experimental error into account.
The formation of humins as an unfavourable side product is controversially discussed in the literature, while mostly 5-hydroxymethylfurfural as a substrate is considered. The activation energy for the humin formation from 5-hydroxymethylfurfural varies between 85–130 kJ mol−1.8,27,38 Starting from furfural, the activation energy for humin formation is reported to be 125.1 kJ mol−1 (ref. 39) or 110–113 kJ mol−1.40 Danon et al.41 pointed out that the humin formation from furfural has a lower activation energy (65.7 kJ mol−1) when glucose is present, compared to the reaction from furfural only (102.1 kJ mol−1). The activation energy that we determined is slightly higher compared to the literature values taking the experimental error into account.
To the best of our knowledge, there has been no publication about in situ kinetic investigations on humin formation. Our methodology is able to reflect the actual process as closely as possible, while investigating simultaneously the kinetics of xylose dehydration and the production of humins. Weingarten et al.1 determined the activation energies for the humin formation from furfural (67.6 kJ mol−1) and from xylose and furfural (72.5 kJ mol−1). Since their reaction system and the modelled kinetic equations differ from the presented research, the activation energies are not quantitatively comparable. However, Weingarten also showed that the activation energy for the xylose dehydration to furfural is higher (123.9 kJ mol−1) than that for the humin formation.
Optimised reactor concept
The difference in activation energy between the xylose dehydration and the humin formation is small (ΔEA = 151–139 = 12 kJ mol−1). However, high temperatures (likely 160–190 °C) will improve the selectivity towards furfural, because this favours the reaction with higher activation energy, which is the xylose dehydration. In addition, the concentration of xylose and furfural should be relatively low. Then, the driving force of the humin formation as a side reaction1 between xylose isomers and furfural is decreased. This would be achieved with a semi-batch process where xylose is added slowly to the process. Since this process would need large amounts of solvent and furfural can also react with itself to form humins, a continuous process with short residence times (probably in the range of minutes compared to hours in batch) is to be preferred. This would keep the concentration of furfural low in the first cycle, and after a separation step, the reaction mixture would be fed again into the reactor.To achieve reasonable space time yields, the concentration of xylose has to be adapted at the beginning of each cycle to keep the substrate stream at a fairly high concentration (slightly lower than 1 mol L−1). For this purpose, the PAT tools presented in this manuscript can be applied in a continuous plant for inline concentration measurements. A high concentration of the substrate and a high temperature will result in a high reaction rate according to eqn (2). In addition to a short reaction time, the mixing behaviour and the extraction kinetics have to be improved to keep the concentration of furfural in the reactive aqueous phase low. The reaction rate constant for this system extrapolated to 185 °C is 0.00437 s−1. In this case, the volumetric mass transfer coefficient (kLa) has to be significantly higher (kLa ≫ kDehydration = 0.00437 s−1) to ensure that the reaction is not mass transfer limited. Therefore, the mass transfer coefficient kL or the interfacial area per unit volume a has to be increased by at least two orders of magnitude42 compared to the reaction rate.
A continuous reactor system with constant biphasic mixing that improves the mass transfer is a capillary micro-reactor with a liquid–liquid slug flow.43,44 This reactor concept also enables lab scale research on this aspect, because a slug flow with a well-defined flow pattern gives a uniform specific surface area that can be determined and furthermore varied.43,44 The mass transfer coefficient itself is also adaptable by changing the flow velocity of the slugs.43
Regarding the selectivity of such a process, the continuous liquid–liquid slug flow reactor would need to be optimised, e.g. along a design of experiments. A key challenge for this optimisation is the formation of solid humins, which should be minimised to ensure the processing of the flow in the continuous plant. Since the humins form in the aqueous phase, but accumulate in the organic phase, this is especially crucial for the organic extraction phase. The separation of the aqueous and the organic slug streams can be achieved by integrating a liquid–liquid separation device based on a glass separation column as shown by Ley and co-workers45 into the continuous system. The remaining humins could be removed by ultra- and nanofiltration based on membranes, similarly to what is known for the separation of lignin in the context of biorefineries.46 After the separation steps, the aqueous phase can be fed back into the reactor, while the product furfural has to be isolated from the organic phase.
Liquid phase adsorption on activated carbon or hyper-cross-linked polymers47 of furfural should be a viable method to separate the product from the organic phase.
The proposed continuous reactor design with optimised conditions will improve the precise adjustment of short reaction times and will intensify the mass transfer of the xylose dehydration to furfural and this leads to an intensified yield of furfural and a more sustainable use of the renewable lignocellulosic biomass. The proposed lab scale reactor concept can be used for investigations regarding the importance of mass transfer and separation techniques. Regarding a scale-up for a lignocellulosic biorefinery, this knowledge is crucial to be able to perform a holistic process design with respect to reactor network synthesis with a special focus on reactor–separator synthesis problems.48
Conclusions
We showed that the comprehensive reaction monitoring by using ATR mid-IR and Raman spectroscopy in combination with kinetic modelling can be applied to the dehydration of xylose to furfural in a biphasic system (2-MTHF/H2O). The kinetics of the dehydration of xylose, the production of humins as a side reaction and the fouling of the optical probes were investigated simultaneously. The combination of in-process Raman spectra and mid-IR data made it possible to investigate the reaction rates and activation energies of this system. The activation energies for xylose dehydration (EA = 151 ± 3 kJ mol−1) and for humin formation (EA = 139 ± 7 kJ mol−1) were determined under process conditions. With this knowledge on hand, a continuous reactor design was proposed, which, with high reaction temperatures and small residence times, should improve the selectivity towards furfural.The investigated reaction from xylose to furfural catalysed by FeSO4 is a typical sugar dehydration reaction known in the literature. Thus, the established PAT tools are suitable to monitor complicated reaction networks involved in biomass transformations in order to increase the reaction selectivity and decrease the side reactions. Therefore, this methodology could be applied to the hemicellulose stream of a lignocellulosic feedstock. For example Leitner and co-workers introduced the OrganoCat process49 where the lignocellulosic feedstock is first fractionated and the further processing of the xylose rich stream could be analysed inline with our presented method. The PI model could also be adapted to glucose to permit the inline analysis of the glucose rich stream originated from cellulose. For direct applicability to a lignocellulosic feedstock containing cellulose, hemicellulose, lignin, their building blocks and other extractives, the chemometric model has to be expanded to a multivariate approach such as indirect hard modelling (IHM) or principal component analysis (PCA) probably with lumped clusters of substances rather than with single components. However, the major issue for all applications is the transformation of sugars to furan derivatives and the undesired humin formation as described in this manuscript.
Furthermore, in continuous reaction processes, the PAT tools could be used for real-time, in-process monitoring to control the specific process. This would make a bio-based process more economical by ensuring that the carbon and energy balance would be levelled because the substrate is processed not into humin waste material but into a usable product.
Experimental and methods
Materials
Xylose (≥99%), furfural (99%), FeSO4 (≥99%), Fe2(SO4)3 (97%) and NaCl (≥99.8%) were provided by Sigma-Aldrich. 2-MTHF (99% with 150–400 ppm BHT as a stabilisation agent) was provided by ABCR. H2O was purified by the EASYpure System from Werner (Leverkusen, Germany) to a resistivity of 18.2 MΩ cm (referring to 25 °C). The other chemicals were used without further purification.Xylose dehydration reactions
Dehydration reactions were performed in a special batch autoclave that allowed spectroscopic investigations of multiphase systems at elevated pressures and temperatures. The reactor system was already described elsewhere.16 Xylose (1.2 mol L−1) and the specific iron sulphate (10 mol% referring to xylose concentration) were added to a water–2-MTHF mixture (each 11 mL) inside the autoclave. To increase the salting out effect, NaCl (7.7 wt% referring to xylose concentration) was added to the solution.23 The reaction system was heated by using a heating plate, and the reaction time was set to zero (t0). When the reaction system reached the specific conditions, the inline spectra were acquired throughout the whole reaction time. The reaction was quenched with a cooling plate, and the samples were taken, filtered and analysed by offline analytics.In situ analytics
All spectra were acquired every 120 s in situ with an exposure time of 60 s using fibre optical immersion probes (diameter: 1/4 inch). The described autoclave was equipped with two immersion probes per phase. The reaction was performed at temperatures between 120 °C and 160 °C and pressures up to 15 bar, which allowed a broad variety of optical probes. Because of the high turbidity due to the formation of solid humins, only ATR probes (UV/Vis and mid-IR) and short focus probes (Raman) were suitable to monitor the reaction in real time. The probes were directly mounted in the autoclave and fixated by cutting or squeezing rings. UV/Vis spectra were collected using a MultiSpec (tec5, Oberursel, Germany) spectrometer, equipped with ATR probes (type KATANA from Hellma Analytics, Mülheim/R., Germany). The shaft was made of titanium, and the IRE is a sapphire with three reflections. A MATRIX-MF (Bruker Optik, Ettlingen, Germany) was used to acquire the inline mid-IR spectra. ATR probes (type IN350-T from infrared fiber sensors, Aachen, Germany) with a Hastelloy shaft and a diamond IRE with two reflections were attached to the mid-IR spectrometer. Raman spectra were acquired using an RXN2 (Kaiser Optical, Lille, France). An excitation wavelength of 785 nm was used to record the spectra. The shaft of the short focus probes consisted of Hastelloy, and the tip was made out of sapphire.Offline analytics
The samples of the organic reaction phase were analysed by using a GC (type Trace GC Ultra from Thermo Scientific) with the column HP-INNOWax from Agilent Technologies. He was used as the mobile phase with a constant flow of 1.5 mL min−1. A flame ionisation detector was attached to the GC. The external standard was 1-hexanol (≥99.9%), which was provided by Sigma-Aldrich, with a correction factor of Kf = 1.658. An HPLC (type PROMINENCE from Shimadzu) with two organic acid resin columns from CS Chromatographie was used to analyse the samples of the aqueous phase. A refractive index detector was used to determine the xylose concentration, and an UV/Vis detector measured the furfural concentration.Chemometric modelling
The data evaluation of all spectra was performed using the Software PEAXACT3 (S-PACT, Aachen, Germany). To extract kinetic information from the mid-IR spectra of the aqueous phase, an integration model that integrates the xylose peak in the fingerprint region between 980 cm−1 and 1200 cm−1 (see section 5, ESI†) was built. The PI model was calibrated at room temperature with gravimetrically prepared samples containing H2O (as solvent), xylose (0.4–1.3 mol L−1), and FeSO4 (concentration equal to dehydration reactions) (see section 5, ESI†). Small amounts of furfural were added to three samples to ensure the independence of the PI model from the low concentrations of furfural in the aqueous phase. A linear fit baseline correction was used for the PI model to compensate the changes in the spectra due to temperature effects.The integration model was calibrated with a linear model for the reaction system with a good R2 of 0.96, a moderate RMSEC of 0.055 mol L−1 and an RMSECV of 0.066 mol L−1 (Fig. 10). The difference between the RMSEC and the RMSECV was less than 20% which was an indicator for a robust chemometric model. In Fig. 11, two mid-IR spectra of xylose with similar concentrations (ca. 0.7 mol L−1) show the temperature effect on the signals: upon heating from 20 °C to 140 °C, the separate maxima have merged to some extent, and the minimum at 1000 cm−1 is shifted to lower wavenumbers, while the highest signal at 1050 cm−1 is only slightly shifted. The absorptions between 1000–1050 cm−1 increase with temperature and the absorptions between 1050–1200 cm−1 decrease with temperature. Therefore, the integral between the two minima at 1000 cm−1 and 1200 cm−1 does not change significantly with temperature and the deviations between the concentrations predicted by the chemometric model are 0.014 mol L−1 and 0.028 mol L−1 lower than the RMSECV at 25 °C and 140 °C, respectively.
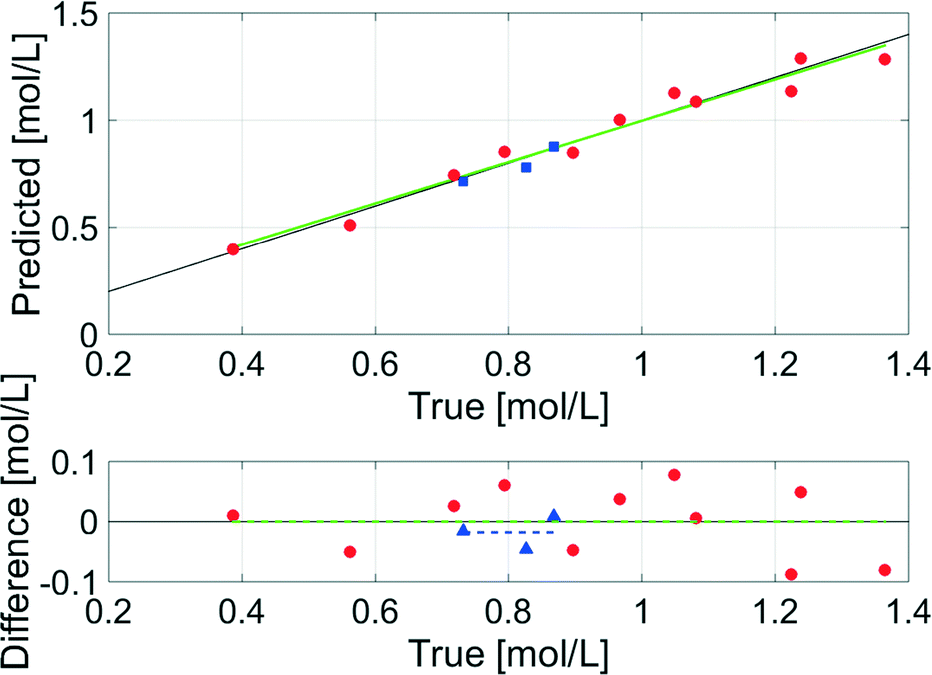 | ||
| Fig. 10 Predicted versus true values of the calibration and the validation of the integration model for the mid-IR spectra of the aqueous phase (green line: linear calibration function; red circles: training samples for calibration; blue squares: test samples for validation). | ||
 | ||
| Fig. 11 Comparison of xylose peaks in the mid-IR fingerprint region at 25 °C (red line, cTrue = 0.718 mol L−1, integral: 7.77454 a.u., cPredicted = 0.732 mol L−1) and 140 °C (blue line, cTrue = 0.732 mol L−1, integral: 7.4191 a.u., cPredicted = 0.704 mol L−1). | ||
To validate the model, samples of the reaction mixture were taken under process conditions after 15 min, 30 min and 60 min at 140 °C and analysed offline with HPLC. The offline data showed a higher concentration in all three cases compared to the inline data, because the density of the solvent H2O changes from 0.997 g mL−1 at 25 °C to 0.926 g mL−1 at 140 °C (ref. 50) which lowers the concentration of the solutes. Thus, the density corrected offline data were compared to the inline data and resulted in a good RMSEP of 0.029 mol L−1 (Fig. 10), which indicated the accuracy of the chemometric model even under process conditions.
The time information about the significance of humin formation was analysed by integrating the sapphire peaks of the Raman spectra. Two chemometric models that both integrated the sapphire peak at 748 cm−1 between 725 cm−1 and 770 cm−1 with a prior data thinning factor of 4.0 (see section 5, ESI†) were built. The first model integrated the peak without a baseline correction and the second model used a linear fit baseline correction. Due to the described fluorescence in the Raman spectra, the integral of the sapphire peak at 748 cm−1 without a baseline correction increased. When this integral is higher than the initial value (time t0), humin formation became significant. The time when the humins were deposited on the surface of the probes was also determined by the Raman spectra. At this time, the integral of the sapphire peak at 748 cm−1 with a corrected baseline started decreasing.
Kinetic modelling
Kinetic modelling was performed using MATLAB R2015a (The MathWorks Inc., Natick, USA). The concentration or the integral of xylose or sapphire was normalised to the initial concentration or integral value, respectively. The integral of the sapphire peak was compared over the course of the reaction time with the initial value. The time when the integral of the peak without a baseline correction doubled its value was determined as t1. t2 was determined as the time when the integral of the peak with a linear fit baseline correction was smaller than 95%. The kinetic modelling of xylose dehydration was carried out using the concentration and just the integral of the xylose peak in the mid-IR spectra between the start of the reaction and t1. A first order kinetic was fitted to the linearized experimental data with lsqcurvefit and 1000 iterations and a tolerance of 1 × 10⁻¹². To model the reaction kinetics of humin formation, the difference between the kinetic model for xylose dehydration and the experimental data was determined between t1 and t2. Again, first order kinetics were fitted to the experimental data with lsqcurvefit and 1000 iterations and a tolerance of 1 × 10⁻¹². The obtained reaction rate constants were used to evaluate the activation energy for xylose dehydration and the activation energy for humin formation with an Arrhenius diagram.Abbreviations
| ATR | Attenuated total reflection |
| c | Concentration [mol L−1] |
| E A | Activation energy [kJ mol−1] |
| GC | Gas chromatography |
| HPLC | High performance liquid chromatography |
| I | Integral of a peak [−] |
| IHM | Indirect hard modelling |
| IRE | Internal reflection element |
| k | Reaction rate constant [s−1] |
| mid-IR | Mid-wavelength infrared |
| 2-MTHF | 2-Methyltetrahydrofuran |
| PAT | Process analytical technology |
| PCA | Principal component analysis |
| PI | Peak integration |
| R | Gas constant (8.31446 J mol−1 K−1) |
| RMSEC | Root mean square error of calibration |
| RMSECV | Root mean square error of cross validation |
| RMSEP | Root mean square error of prediction |
| t | Reaction time [s] |
| t 0 | Start time of the reaction [s] |
| t 1 | Reaction time in which the humin formation was significant with respect to its influence on the spectra [s] |
| t 2 | Reaction time in which the humin deposition was significant with respect to its influence on the spectra [s] |
| UV/Vis | Ultraviolet–visible |
Acknowledgements
The authors thank Ralf Thelen and the staff of the mechanical workshop (ITMC, RWTH Aachen University) and Lukas Küpper (IFS Aachen) for their technical contributions. Clemens Minnich, Dirk Engel (both from S-PACT) and Sonja Hardy (formerly from S-PACT) are greatly acknowledged for PAT and chemometric consultation. We thank Markus Hölscher and Jens Kothe (both from ITMC, RWTH Aachen University) for their contribution to the DFT calculations. Sincere thanks are given to Delia Reinhardt and Kylie L. Luska for fruitful discussions and Harald Voelkel for experimental contributions. This work was performed as part of the Cluster of Excellence “Tailor-Made Fuels from Biomass”, which is funded by the Excellence Initiative by the German federal and state governments to promote science and research at German universities.Notes and references
- R. Weingarten, J. Cho, W. C. Conner and G. W. Huber, Green Chem., 2010, 12, 1423–1429 RSC.
- K. Lamminpää, J. Ahola and J. Tanskanen, Ind. Eng. Chem. Res., 2012, 51, 6297–6303 CrossRef.
- A. J. Janssen, F. W. Kremer, J. H. Baron, M. Muether, S. Pischinger and J. Klankermayer, Energy Fuels, 2011, 25, 4734–4744 CrossRef CAS.
- A. Bohre, S. Dutta, B. Saha and M. M. Abu-Omar, ACS Sustainable Chem. Eng., 2015, 3, 1263–1277 CrossRef CAS.
- M. J. Climent, A. Corma and S. Iborra, Green Chem., 2014, 16, 516 RSC.
- J. S. Luterbacher, D. M. Alonso and J. A. Dumesic, Green Chem., 2014, 16, 4816–4838 RSC.
- R. A. Sheldon, Green Chem., 2014, 16, 950–963 RSC.
- R. J. van Putten, J. C. van der Waal, E. de Jong, C. B. Rasrendra, H. J. Heeres and J. G. de Vries, Chem. Rev., 2013, 113, 1499–1597 CrossRef CAS PubMed.
- R. Mariscal, P. Maireles-Torres, M. Ojeda, I. Sádaba and M. López Granados, Energy Environ. Sci., 2016, 9, 1144–1189 CAS.
- R. O'Neill, M. N. Ahmad, L. Vanoye and F. Aiouache, Ind. Eng. Chem. Res., 2009, 48, 4300–4306 CrossRef.
- P. T. Anastas and J. C. Warner, Green Chemistry: Theory and Practice, Oxford University Press, New York, 1998 Search PubMed.
- K. D. Rojas, PhD Thesis, University of Limerick, 2014 Search PubMed.
- V. Choudhary, S. I. Sandler and D. G. Vlachos, ACS Catal., 2012, 2, 2022–2028 CrossRef CAS.
- K. A. Bakeev, Process Analytical Technology: Spectroscopic Tools and Implementation Strategies for the Chemical and Pharmaceutical Industries, Wiley, 2010 Search PubMed.
- R. W. Kessler, Prozessanalytik, Wiley-VCH, Weinheim, 2012 Search PubMed.
- S. Hardy, I. M. de Wispelaere, W. Leitner and M. A. Liauw, Analyst, 2013, 138, 819–824 RSC.
- J. Zakzeski, R. J. Grisel, A. T. Smit and B. M. Weckhuysen, ChemSusChem, 2012, 5, 430–437 CrossRef CAS PubMed.
- C. Yao, Y. Shin, L. Q. Wang, C. F. Windisch, W. D. Samuels, B. W. Arey, C. Wang, W. M. Risen and G. J. Exarhos, J. Phys. Chem. C, 2007, 111, 15141–15145 CAS.
- H. Kimura, M. Nakahara and N. Matubayasi, J. Phys. Chem. A, 2011, 115, 14013–14021 CrossRef CAS PubMed.
- J. Zhang and E. Weitz, ACS Catal., 2012, 2, 1211–1218 CrossRef CAS.
- A. J. Kunov-Kruse, A. Riisager, S. Saravanamurugan, R. W. Berg, S. B. Kristensen and R. Fehrmann, Green Chem., 2013, 15, 2843 RSC.
- H. B. Liu and X. C. Zhang, Chem. Phys. Lett., 2006, 429, 229–233 CrossRef CAS.
- T. vom Stein, P. M. Grande, W. Leitner and P. Domínguez de María, ChemSusChem, 2011, 4, 1592–1594 CrossRef PubMed.
- B. Danon, G. Marcotullio and W. de Jong, Green Chem., 2014, 16, 39–54 RSC.
- A. R. C. Morais, M. D. D. J. Matuchaki, J. Andreaus and R. M. Bogel-Lukasik, Green Chem., 2016, 18, 2985–2994 RSC.
- G. Yang, E. A. Pidko and E. J. M. Hensen, J. Catal., 2012, 295, 122–132 CrossRef CAS.
- G. Tsilomelekis, M. J. Orella, Z. Lin, Z. Cheng, W. Zheng, V. Nikolakis and D. G. Vlachos, Green Chem., 2016, 18, 1983–1993 RSC.
- T. M. C. Hoang, E. R. H. van Eck, W. P. Bula, J. G. E. Gardeniers, L. Lefferts and K. Seshan, Green Chem., 2015, 17, 959–972 RSC.
- S. K. R. Patil, J. Heltzel and C. R. F. Lund, Energy Fuels, 2012, 26, 5281–5293 CrossRef CAS.
- I. van Zandvoort, Y. Wang, C. B. Rasrendra, E. R. van Eck, P. C. Bruijnincx, H. J. Heeres and B. M. Weckhuysen, ChemSusChem, 2013, 6, 1745–1758 CrossRef CAS PubMed.
- G. W. Hergert, P. T. Nordquist, J. L. Petersen and B. A. Skates, J. Plant Nutr., 1996, 19, 1223–1233 CrossRef CAS.
- C. Michalik, M. Brendel and W. Marquardt, AIChE J., 2009, 55, 1009–1022 CrossRef CAS.
- J. Fernandez-Bertran, E. Reguera and P. Ortiz, Spectrochim. Acta, Part A, 2001, 57, 2607–2615 CrossRef CAS.
- M. Hesse, H. Meier and B. Zeeh, Spektroskopische Methoden in der organischen Chemie, Thieme Georg Verlag, 2005 Search PubMed.
- A. P. Dunlop, Ind. Eng. Chem., 1948, 40, 204–209 CrossRef CAS.
- M. J. Antal, T. Leesomboon, W. S. Mok and G. N. Richards, Carbohydr. Res., 1991, 217, 71–85 CrossRef CAS.
- C. D. Hurd and L. L. Isenhour, J. Am. Chem. Soc., 1932, 54, 317–330 CrossRef CAS.
- S. K. R. Patil and C. R. F. Lund, Energy Fuels, 2011, 25, 4745–4755 CrossRef CAS.
- G. Marcotullio, M. A. T. Cardoso, W. De Jong and A. H. M. Verkooijen, Int. J. Chem. React. Eng., 2009, 7, A67 Search PubMed.
- K. Lamminpaa, J. Ahola and J. Tanskanen, RSC Adv., 2014, 4, 60243–60248 RSC.
- B. Danon, L. van der Aa and W. de Jong, Carbohydr. Res., 2013, 375, 145–152 CrossRef CAS PubMed.
- J. Atherton and K. Carpenter, Process Development: Physicochemical Concepts, OUP, Oxford, 1999 Search PubMed.
- G. Dummann, U. Quittmann, L. Gröschel, D. W. Agar, O. Wörz and K. Morgenschweis, Catal. Today, 2003, 79–80, 433–439 CrossRef CAS.
- J. R. Burns and C. Ramshaw, Lab Chip, 2001, 1, 10–15 RSC.
- D. X. Hu, M. O'Brien and S. V. Ley, Org. Lett., 2012, 14, 4246–4249 CrossRef CAS PubMed.
- C. Abels, F. Carstensen and M. Wessling, J. Membr. Sci., 2013, 444, 285–317 CrossRef CAS.
- C. Detoni, C. H. Gierlich, M. Rose and R. Palkovits, ACS Sustainable Chem. Eng., 2014, 2, 2407–2415 CrossRef CAS.
- M. Feinberg, Ind. Eng. Chem. Res., 2002, 41, 3751–3761 CrossRef CAS.
- P. M. Grande, J. Viell, N. Theyssen, W. Marquardt, P. Domínguez de María and W. Leitner, Green Chem., 2015, 17, 3533–3539 RSC.
- E. W. Lemmon, M. O. McLinden and D. G. Friend, Thermophysical Properties of Fluid Systems, in NIST Chemistry WebBook, NIST Standard Reference Database Number 69, 2016, http://webbook.nist.gov Search PubMed.
Footnote |
| † Electronic supplementary information (ESI) available: X, Y, S data, spectra of pure components, results of offline analytics, Raman spectra over the course of the reaction, details about chemometric PI models, and sensitivity analysis of kinetic modelling. See DOI: 10.1039/c6re00082g |
| This journal is © The Royal Society of Chemistry 2016 |