Fabrication of sponge-like α-Ni(OH)2 on styrene–acrylonitrile copolymer (SAN)-derived carbon spheres as electrode materials for supercapacitor application
Zemin Maoa,
Yingjie Zhou*b,
Zhoulu Wanga,
Zhengkai Yanga and
Xiang Liu*a
aKey Laboratory of Flexible Electronics (KLOFE), Institute of Advanced Materials (IAM), National Jiangsu Synergistic Innovation Center for Advanced Materials (SICAM), Nanjing Tech University (Nanjing Tech), 30 South Puzhu Road, Nanjing, Jiangsu 211816, China. E-mail: iamxliu@njtech.edu.cn
bDepartment of Materials Physics, School of Physics and Optoelectronic Engineering, Nanjing University of Information Science & Technology, 219 Ningliu Road, Nanjing, Jiangsu 210044, China. E-mail: zyj8703@163.com
First published on 13th October 2016
Abstract
Styrene–acrylonitrile copolymer particles (SANPs) were synthesized through dispersion polymerization. Their high residual carbon content and abundant nitrogen is beneficial for electrochemical performance. In this work, the SANPs were used as the carbon precursor to prepare a series of different carbon spheres by carbonization at various temperatures. Then, α-Ni(OH)2 was coated on the above carbon backbones via the hydrothermal method to give sponge-like morphologies. The nanostructures of both the SANPs and the nanocomposites were fully investigated by scanning electron microscopy, transmission electron microscopy, X-ray diffraction spectroscopy, and Raman analysis. The electrochemical studies found that when the carbonization temperature of the SANPs was 900 °C, the composite could achieve a high specific capacitance of 333.84 F g−1 at a current density of 0.5 A g−1, with 75.34% capacitance retention of the initial value after 3000 cycles. The capacitances of the composites are greatly influenced by the carbonization conditions of the SANPs and the special core–shell structures with their sponge-like surface morphologies.
1. Introduction
To date, considerable efforts have been devoted to the development of alternative energies to fossil fuels due to ever-increasing environmental problems. Meanwhile, novel energy storage devices with higher power and energy densities are attracting a great deal of attention. Among all the energy storage devices developed, supercapacitors usually present high power density, fast charge–discharge rates and long cycle life, and these outstanding electrochemical properties allow them be considered as the most promising devices when compared to secondary batteries and traditional electric double-layer capacitors.1,2 Based on the charge storage mechanism, supercapacitors can be categorized into electric double-layer capacitors (EDLCs) and pseudocapacitors.3 In EDLCs, the energy is stored by means of charge separation, which takes place across a very small distance in the electrical double layer by electrostatic adsorption of electrolyte ions at the interphase between electrolyte and electrode. By comparison, the capacitances of pseudocapacitors are related to the faradaic-type charge transfer. Carbon materials are extensively used as electrode materials in EDLCs currently.4,5 The electrochemical performance of carbon materials is greatly influenced by surface area, pore size and pore size distribution.6 The major objective is to achieve high surface area with low matrix resistivity.To date, various carbon materials have been developed to achieve these goals, including carbon nanotubes (CNTs),7–10 activated carbon fibers (ACFs),11 carbon aerogels (CAs),12 carbon foams (CFs),13 carbon nanocages (CNCs),14 hollow carbon spheres (HCSs),15 graphene (Gr),16–19 graphene oxide (GO)20 and reduced graphene oxide (rGO)21 etc. These materials all possess promising futures through modification of their nanostructures, device structures and shapes, etc. For instance, graphene has an EDLC capacitance as high as 550 F g−1 if its entire surface area of up to 2630 m2 g−1 can be used.22 Utilizing the advantage of this huge surface area, 3-dimensional graphene networks with a specific capacitance of 816 F g−1 at a scan rate of 5 mV s−1 and a stable cycling performance have been developed.23
During the charging/discharging process in EDLCs, the movement of ions on the surface requires a small distance in the interphase between the electrode and electrolyte. Hence, the specific capacitance strongly depends on the effective surface area of the electrode materials as well as the affinity between the electrolyte and the electrode. It has been proven that EDLCs with high capacitance display a good match between the electrode pore size and the size of the electrolyte's ions. When the pore size is too small to match the electrolyte ions, the specific capacitance is poor due to insufficient use of the surface area. Hence, meso- (2–50 nm) or macro- (>50 nm) pores are believed to be ideal for shortening the ion diffusion distance and taking full advantage of the surface area.24 Furthermore, carbon materials can be modified with different heteroatoms and functional groups, such as nitrogen (N),25–28 boron (B),29 phosphorous (P),27 sulfur (S),30 fluorine (F),5,28 oxygen (O)31 and their derivative functional groups, in order to improve their electrochemical performances.31 The enhancement in electrochemical performances caused by the addition of these elements lies in both the enhanced affinity between the carbon materials and the electrolytes, and also the induced pseudocapacitance achieved through changing the electronic density and increasing the active sites of the carbon materials.31 Moreover, the heteroatom-containing materials offer beneficial electrical conductivity.6,33 According to the literature,32,34 heteroatoms may be introduced into the carbon matrix either by preparing the carbon precursors containing the various heteroatoms, or by post-processing with compounds to introduce these elements.
Although different carbon materials have been developed and processed via various methods, the performance of EDLCs still cannot compare with that of pseudocapacitors, which display higher specific capacitances for the highly reversible faradaic redox reaction. This not only occurs at the surface but also internally in the electrode. To date, many metal oxides and conducting polymers with redox-capability have been investigated. The conducting polymers always swell and shrink during the charging/discharging process, and mechanical degradation compromises their electrochemical performances.35,36 In contrast, the metal oxides offer better electrochemical stability. Numerous metal oxides and their derivatives have been developed, such as RuO2,37 NiO,38 MnO2,39 Co3O4,40 MoO2,41 SnO2,42 Fe2O3 (ref. 43) etc. Among these, the VIII B (Ni, Co) based metal oxides are attracting enormous attention because of their huge theoretical capacitances; for example, the capacitances of NiO and Co3O4 could reach up to 2573 F g−1 and 3560 F g−1, respectively, in theory.44 Unfortunately, the severe aggregation of the metal oxides, unsatisfactory electrochemical windows and electronic conductivities limit their widespread practical application. The cooperation of metal oxides with carbon materials might relieve the aggregation and combine the merits of these materials, thus providing higher energy density for supercapacitors than conventional carbon materials, and also maintaining higher stability.
In this work, grape-like carbon spheres with abundant N, derived from styrene acrylonitrile copolymer particles (SANPs), are employed as the matrix to cooperate with nickel for supercapacitor applications. These hybrid materials could comprehensively display the advantages and make up the disadvantages of both hedgehog-like carbon spheres and nickel oxides. The relationship between the intrinsic characteristic properties of the hybrid composites and their electrochemical performances is demonstrated in detail.
2. Experimental
2.1. Materials
Styrene (St, 99.9%, Sigma-Aldrich) and acrylonitrile (AN, 95%, Sigma-Aldrich) were distilled under reduced pressure and degassed by performing three freeze–thawing cycles before use. Poly(N-vinylpyrrolidone) (PVP, 36![[thin space (1/6-em)]](https://www.rsc.org/images/entities/char_2009.gif) 000 g mol−1) was dissolved in ethanol. 2,2′-Azobis(isobutyronitrile) (AIBN, 99%, Sigma-Aldrich) and benzoyl peroxide (BPO, 75%, Sigma-Aldrich) were distilled before use.
000 g mol−1) was dissolved in ethanol. 2,2′-Azobis(isobutyronitrile) (AIBN, 99%, Sigma-Aldrich) and benzoyl peroxide (BPO, 75%, Sigma-Aldrich) were distilled before use.
2.2. Preparation of SANPs
Monomers of St (26 g) and AN (64 g) together with the initiators AIBN (0.5 g) and BPO (1.0 g) were dispersed in PVP ethanol/water solution (9.58 g PVP solution in 140 mL ethanol and 50 mL deionized water) in a four-neck round bottomed flask equipped with a condenser and a gas inlet valve, which had been evacuated and refilled with nitrogen five times prior to the reaction. The reaction was carried out at 75 °C for 24 h under constant stirring and N2 flow. Finally, the obtained SANPs were filtered using a sieve (300 mesh) and rinsed 5 times with water. After being dried at room temperature and ground, the SANPs were ready for further use.2.3. Fabrication of α-Ni(OH)2 with carbon from the pyrolysis of SANPs
First of all, the pyrolysis of SANPs was performed at temperatures of 600 °C, 700 °C, 800 °C, 900 °C and 1000 °C under N2 for 3 h. The resulting powders were denoted as C-600, C-700, C-800, C-900 and C-1000, respectively. Then, 0.469 g nickel nitrate hexahydrate (Ni(NO3)2·6H2O), 0.48 g PVP (K30), 0.29 g urea (CO(NH2)2) together with 0.8 g carbon from the pyrolysis of the SANPs were mixed in 60 mL ethanol with constant stirring for 24 h. Each mixture was subsequently transferred to a 100 mL Teflon lined stainless steel autoclave and reacted at 150 °C for 24 h. The resultant powders were collected, centrifuged, rinsed 5 times with water, and dried at 80 °C overnight. Finally, the black hybrid composites were ground, ready for the preparation of electrode materials. The samples were named as Ni(OH)2@C-600, Ni(OH)2@C-700, Ni(OH)2@C-800, Ni(OH)2@C-900 and Ni(OH)2@C-1000. The entire process for the fabrication of α-Ni(OH)2 with hedgehog-like carbon spheres is illustrated in Fig. 1.2.4. Material characterization
The morphological properties of the prepared samples were examined by scanning electron microscopy (SEM, JSM-6360LV, Japan) operated at 15 kV.Transmission electron microscopy (TEM, HT7700 Japan) was carried out with an accelerating voltage of 200 kV. The particles were first dispersed in a mixture of ethanol and water, and then deposited on a carbon-film supported copper grid and air dried prior to measurement.
X-ray diffraction (XRD) was carried out on Rigaku Smartlab TM 9KW (Japan) between 10 and 80° with Cu Kα radiation (λ = 0.154059 nm) at 40 kV and 100 mA.
Raman measurement was performed with a Horiba Jobin Yvon HR 800 spectrometer (Japan) with wavelengths of 514.5 nm.
Thermogravimetric analysis (TGA, STA449, Germany) was carried out at a heating rate of 10 °C min−1 under N2 atmosphere.
A Fourier transform infrared spectrophotometer (FT-IR, Agilent Cary 660, Australia) was used to characterize the functional groups of samples using the KBr disc method in the 4000–400 cm−1 region.
Ultraviolet-visible (UV-vis) absorbance spectra were collected on a Shimadzu UV-1750 (Japan) spectrometer over the range of 340–600 nm.
2.5. Electrochemical measurements
All electrochemical measurements were conducted on a CHI660E electrochemical workstation in a conventional three-electrode system with 2 M KOH solution as the electrolyte. The three-electrode cell configuration consisted of Ag/AgCl as the reference electrode, a platinum wire as the counter electrode, and one of the active materials as the working electrode. The working electrodes were prepared by casting mixtures of 70 wt% active materials with 20 wt% acetylene black and 10 wt% polyvinylidene fluoride (PVDF) on nickel foam (1 cm × 1 cm).45 Each electrode was dried at 120 °C overnight prior to testing; the typical mass load of the active component was about 3.0 mg. Cyclic voltammetry (CV), galvanostatic charge–discharge (GCD) and electrochemical impedance spectroscopy (EIS) techniques were employed to evaluate the electrochemical performances of the as-prepared samples. In accordance with the literature,46 the voltammetric-specific capacitances (Cs (F g−1)) were calculated from CV curves by eqn (1), while the GCD-specific capacitances (C (F g−1)) were calculated by eqn (2) using the integral current areas of the GCD discharge curves.
 | (1) |
 (A V g−1) is the voltammetric charge density (that is, the area under the cyclic voltammetry curve).
 | (2) |
 represents the integral current area, and V (V) is the potential with initial and final values of Vi and Vf, respectively.
3. Results and discussion
3.1. Characterizations of SANPs
According to our previous research,47 SANPs with smaller particle sizes and a narrower size distribution could be obtained by decreasing the St/AN monomer weight ratio. This was mainly attributed to a restraining of the aggregation by the grafting reaction between acrylonitrile-rich oligomeric radicals and PVP radicals. In the present work, we synthesized SANPs of a much more uniform size by lowering the content of St during the synthetic procedure; the morphologies and structures observed by SEM and TEM are presented in Fig. 2. It can be seen from Fig. 2(a) that all SANPs possess a uniform size of around 1.3 μm, indicating a narrow size distribution for the high St/AN monomer weight ratio. This is an important basis for the preparation of carbon backbones with high homogeneity and uniform size from the SAN copolymer particles. From Fig. 2(b), the clear morphology of the SANPs can be observed; they have a rough surface with undulating humps. Fig. 2(c) and (d) show that the SAN copolymer particles are covered with a uniform layer of folded polymer film, which can be explained by the polarity of the system. That is, the polyacrylonitrile chain has better hydrophilicity for the ethanol/water solvent system than for the polystyrene chain, which results in the precipitation of a large number of polyacrylonitrile chains on the surface of the particles. Moreover, the friction between SANPs becomes larger when the initial smaller SANPs aggregate. These also gradually enhance the viscosity of the polymerization system, which gives rise to the phenomenon of larger viscosity during the later period of the experiment.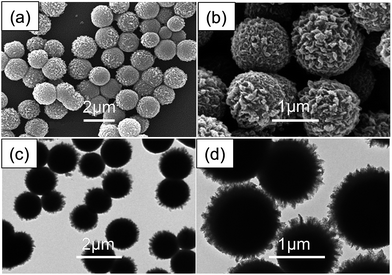 | ||
| Fig. 2 (a) and (b) SEM images of SAN copolymer particles, and (c) and (d) TEM images of SAN copolymer particles. | ||
The FT-IR spectra and TGA of the SAN copolymer particles are presented in Fig. 3. The characteristic peaks of –C![[triple bond, length as m-dash]](https://www.rsc.org/images/entities/char_e002.gif) N, observed at 2240 cm−1, and –NH2, located at 3650 cm−1, suggest that AN was incorporated in the SAN copolymer particles, which might in theory provide a rich N content in the carbon spheres; this would be confirmed from the residual content of C and N in the SANPs after carbonization, as detected by XPS (Table 1).48 In addition, the molar ratios of C to N decreased gradually with increasing carbonization temperatures, and this suggests the removal of organic moieties little by little.
N, observed at 2240 cm−1, and –NH2, located at 3650 cm−1, suggest that AN was incorporated in the SAN copolymer particles, which might in theory provide a rich N content in the carbon spheres; this would be confirmed from the residual content of C and N in the SANPs after carbonization, as detected by XPS (Table 1).48 In addition, the molar ratios of C to N decreased gradually with increasing carbonization temperatures, and this suggests the removal of organic moieties little by little.
| SAN | C (wt%) | N (wt%) | Molar ratio of N to C |
|---|---|---|---|
| 600 °C | 83.4 | 16.6 | 0.171 |
| 700 °C | 83.7 | 16.3 | 0.167 |
| 800 °C | 88.3 | 11.7 | 0.114 |
| 900 °C | 95.2 | 4.8 | 0.043 |
| 1000 °C | 95.45 | 4.6 | 0.041 |
The TGA curve of the SANPs presented in Fig. 3(b) shows that they went through a degradation in the range of 300–500 °C, which is attributed to the removal of organic moieties.49 When increasing the temperature above 800 °C, a slight weight loss of 4% could be observed, which could be due to the carbonization of the SANPs by pyrolysis to form a conjugated structure that might favour their electrochemical performances. The synthesis and pyrolysis processes of the SANPs are illustrated in Scheme 1.
3.2. Characterization of the carbon spheres produced from SAN copolymer particles by pyrolysis
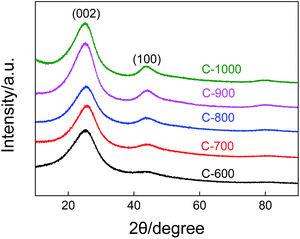
The micrographs in Fig. 4 show the morphologies of the carbon spheres derived from different temperatures ranging from 600 °C to 1000 °C. The carbon spheres obtained by carbonization at 600 °C are totally different from those made at higher temperatures; they have a smaller particle size with a diameter of around 50 nm and adhere to each other because the particles are in a viscous state. These observations indicate the incomplete pyrolysis of the SANPs at 600 °C; there are still numerous fragments of the SANPs. When the carbonization temperature is increased up to 700 °C, 800 °C, 900 °C or 1000 °C, larger grape-like carbon spheres with diameters of around 0.9 μm are obtained, which is probably due to the agglomeration of the small carbon particles into the larger spherical shapes to keep them stable after complete pyrolysis by providing the minimum specific surface energy.Fig. 5 presents the XRD patterns of pristine carbon spheres prepared from SANPs at different temperatures. With increasing carbonization temperatures, the peaks located at around 26° and 44°, assigned to the (002) (100) lattice planes, become more intense and sharper, indicating that the carbon in the spheres becomes more and more crystalline. The results suggest that the carbon goes through a transition state from amorphous to crystalline carbon. At the same time, this observation proves the graphitization trend of carbon. This agrees with the synthetic scheme for the pyrolysis of SANPs, which indicates that carbon backbones are going through a graphitization process upon thermal treatment.
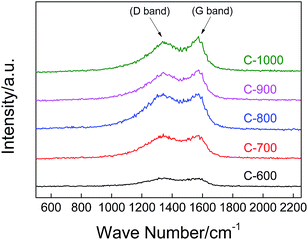
Raman spectroscopy was employed to further identify the states of the carbon spheres derived from the SANPs, and the spectra in the range of 500–2250 cm−1 are plotted in Fig. 6. The two peaks located at around 1340 cm−1 and 1574 cm−1 represent the D (disordered) and the G (graphite) bands of carbon materials, respectively. The D band arises from the defects and the disorder induced in sp2-bonded carbon, while the G band is attributed to the relative motion of sp2 carbon (graphite) atoms. The peak area ratio of the D band and G band is defined as R, which represents the graphitization of the carbon sphere. The value of R is negatively correlated with the domain size of the carbon sphere, that is, the smaller the R value, the bigger the domain size and the higher the graphitization of the carbon material. The R values calculated from Fig. 6 for C-600, C-700, C-800, C-900 and C-1000 are 5.45, 5.42, 5.39, 4.28 and 4.04, respectively. The decrease in R values suggests that the carbonization degree is increased with increasing carbonization temperature, which could also be observed from the TGA (Fig. 3(b)). It is well known that the better carbonized carbon materials offer improved transportation of electrons, which might lead to better electrochemical performance. Thus the conductivity of the carbon spheres will increase with higher carbonization temperatures due to the higher degree of graphitization, and it can be speculated that the better supercapacitor performances should be obtained when higher carbonization temperatures have been used.
3.3. Characterizations of Ni(OH)2-coated grape-like carbon spheres (α-Ni(OH)2@C)
The XRD patterns of carbon spheres which are coated with Ni(OH)2 are presented in Fig. 7. The characteristic peaks at 12.8°, 33.3°, and 59.76° assigned to the respective (003) (101) and (110) planes of α-Ni(OH)2 (JCPDS card no. 38-0715) can be compared. As the carbonization temperature increases, the intensities of the diffraction peaks belong to α-Ni(OH)2 first increase and then decrease; at the same time, the peaks become first sharper and then broader. The α-Ni(OH)2 grown on C-800 and C-900 showed better crystallinity than that grown on the other samples. These observations are definitely closely related to the surface properties of the carbon spheres. It can be seen from Fig. 3(b) that the lower carbonization temperature of 600 °C leads to the incomplete pyrolysis of the SAN copolymers, and amorphous carbon is not favourable for the growth of crystalline α-Ni(OH)2. When the carbonization temperature is increased up to 1000 °C, the greater amount of graphite phase carbon in the carbon spheres will lead to the random growth of α-Ni(OH)2 nanosheets, which is probably due to a faint interaction between the graphite phase carbon and the PVP.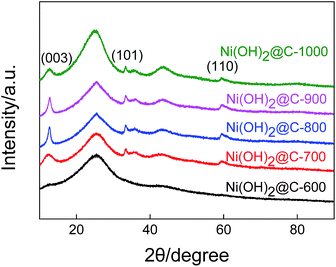 | ||
| Fig. 7 XRD patterns of the Ni(OH)2@C-600, Ni(OH)2@C-700, Ni(OH)2@C-800, Ni(OH)2@C-900 and Ni(OH)2@C-1000. | ||
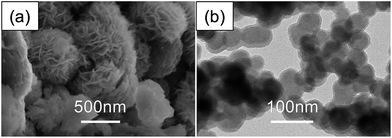
Fig. 8(a) shows that α-Ni(OH)2 nanosheets were successfully grown on the surface of the grape-like carbon spheres and a 3-dimensional spongy conformation was obtained. Irregular continuous pieces of slightly wrinkled α-Ni(OH)2 nanosheets can be observed. As is verified from the TEM presented in Fig. 8(b), the carbon spheres are wrapped uniformly by α-Ni(OH)2 with a thickness of 10 nm. In summary, the α-Ni(OH)2@C nanocomposites exhibit core–shell sphere structures with sponge-like surfaces. It is speculated that this unique structure might greatly increase the contact surface area with the electrolyte when the composites are employed as electrode materials. Moreover, the bending planar structure of the wrinkled walls might provide extra pathways for the transportation/diffusion of electrolytes ions. These might favour the electrochemical performances.
The impregnation of samples in dye solutions is usually used as a visual method to evaluate the effective contact surface area for aqueous electrolytes.50 The α-Ni(OH)2@C nanocomposites were each impregnated in 10 mg L−1 methyl orange (MO) solution. The concentration of the α-Ni(OH)2@C was 0.1 mg L−1. After 48 h, the UV-vis spectra of the remaining MO solutions were evaluated in the wavelength range of 340 to 600 nm, and the results are shown in Fig. 9. The Ni(OH)2@C-900 has the lowest absorption intensity among all samples, which means that the Ni(OH)2@C-900 has the biggest effective surface area for the accessibility of electrolyte ions. This is closely related to the intrinsic features of its flower-like surface morphology as well as the higher crystallinity of the surface coated Ni(OH)2.
3.4. Electrochemical performance
Fig. 10 shows a series of CV measurements of Ni(OH)2@C-600, Ni(OH)2@C-700, Ni(OH)2@C-800, Ni(OH)2@C-900 and Ni(OH)2@C-1000 at a scan rate of 25 mV s−1. Three redox peaks can be clearly observed in a potential window of 0 to 0.5 V, attributed to the combination of EDLC and faradaic pseudocapacitive mechanisms. The EDLC is the result of the N-rich grape-like carbon spheres at the core of the nanocomposites, and the faradaic behavior is due to the deintercalation and intercalation of OH− from the electrolytes during electrochemical reactions. As can be seen, the CV curve area is positively correlated with the carbonization temperature below 1000 °C, and Ni(OH)2@C-900 shows the highest CV curve area. The carbon made from this higher carbonization temperature will lead to a more isotropous morphology, which is good for the growth of α-Ni(OH)2 nanosheets on the carbon surface. The higher carbonization temperature will also decrease the defects on the surface of the particles, which is conducive to the uniform growth of α-Ni(OH)2 rather than induced crystallization at local defect regions. | ||
| Fig. 10 CV curves of Ni(OH)2@C-600, Ni(OH)2@C-700, Ni(OH)2@C-800, Ni(OH)2@C-900 and Ni(OH)2@C-1000 at a scan rate of 25 mV s−1. | ||
In order to further investigate the electrochemical performance of all electrodes, GCD measurements were conducted to determine the specific capacitance of each electrode in a potential range of 0 to 0.45 V at current densities of 0.5 A g−1, 1 A g−1, 2 A g−1, 5 A g−1, 8 A g−1 and 10 A g−1. The GCD curves of all samples at a current density of 1 A g−1 were selected for display in Fig. 11. The voltage platforms were consistent with the peaks observed in the CV curves. According to eqn (2) the specific capacitance values of Ni(OH)2@C-600, Ni(OH)2@C-700, Ni(OH)2@C-800, Ni(OH)2@C-900 and Ni(OH)2@C-1000 were calculated as 64.90, 213.04, 244.94, 296.89 and 163.99 F g−1, respectively. The specific capacitance values (C) at various current densities calculated by eqn (2) for the nanocomposites are illustrated in Fig. 12. All C values decreased with increasing current densities, and the Ni(OH)2@C-900 exhibited the highest specific capacitances of 333.84, 295.89, 269.12, 218.49, 183.67 and 165.78 F g−1 at current densities of 0.5, 1, 2, 5, 8, 10 A g−1, respectively. Fig. 13 shows the electrochemical stability of Ni(OH)2@C-900 as an electrode material at a current density of 1 A g−1. As can be seen, 75.34% of the initial specific capacitance was maintained after 3000 cycles. The inset of Fig. 13 shows the GCD curve of Ni(OH)2@C-900. The fading of the capacitance is probably due to the conversion of some of the α-Ni(OH)2 in the shell to β-Ni(OH)2 under the alkaline conditions; the latter phase is not favourable for the intercalation/deintercalation of OH−.51,52 This might be why the specific capacitance dropped rapidly after 1250 cycles.
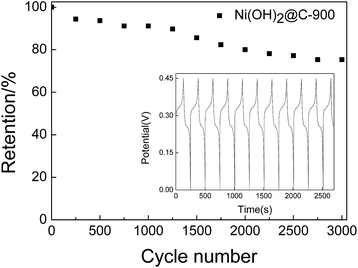 | ||
| Fig. 13 Cycling performance of Ni(OH)2@C-900 over 3000 cycles at a current density of 1 A g−1. The inset shows the GCD curve at a current density of 1 A g−1. | ||
EIS provides clear evidence to describe the ion diffusion and charge transfer processes of the electrodes, and the Nyquist plots of the Ni(OH)2@C nanocomposites are shown in Fig. 14; the inset presents the simulated equivalent circuit using software Zview 2.0. The Rs is the internal resistance, including the ionic resistance of the electrolyte, the intrinsic resistance of the porous substrate, and the contact resistance at the active material/current collector interface. Rct represents the charge transfer resistance, Cp is the pseudocapacitive element from the redox process of the Ni–O/NiO–OH, while W is the constant phase element involving the double-layer capacitance. The x axis intercepts in the high frequency range represent the internal resistances (Rs) of the cells, and the diameters of the semicircles correspond to the interfacial charge-transfer resistances Rct of the electrodes. It can be seen that Ni(OH)2@C-900 has a small Rs of 0.42 Ω, which is smaller than that of Ni(OH)2@C-1000 at 0.68 Ω, implying its lower intrinsic resistance and better faradaic capacitive performances. This is the reason why it possesses the best electrochemical performance among all the nanocomposites. On the other hand, the Ni(OH)2@C-1000 owns the smallest Rct of 0.72 Ω, suggesting that it has better electrolyte penetration and faster ion/electron transfer than Ni(OH)2@C-900 (1.03 Ω). This is due to the higher content of graphite phase in C-1000. The inclined lines of the Nyquist plots in the low-frequency range are closely related to the diffusive resistance of the electrolyte ions. The higher the slope of the inclined lines, the faster the diffusion/transportation process of the electrolyte ions to the electrode surface. Among all the Ni(OH)2@C nanocomposites, Ni(OH)2@C-800 and Ni(OH)2@C-900 exhibit lines closest to vertical. Therefore, the Ni(OH)2@C-800 and Ni(OH)2@C-900 electrodes exhibit better performance than the other composites.
 | ||
| Fig. 14 Nyquist plots of Ni(OH)2@C-600, Ni(OH)2@C-700, Ni(OH)2@C-800, Ni(OH)2@C-900 and Ni(OH)2@C-1000. | ||
Correlating the structures and electrochemical performances of the nanocomposites, it is clear that the carbonization temperatures greatly influence the carbon state as well as the crystallinity of the α-Ni(OH)2 nanosheets. A higher content of graphite phase in the carbon spheres as well as a higher crystallinity of α-Ni(OH)2 is definitely beneficial for the electrochemical performance. Higher carbonization temperatures used to prepare the SANPs led to more graphitized carbon, which is the major reason for the increasing electrochemical performances of the α-Ni(OH)2-coated SANPs produced with the higher carbonization temperatures, with the exception of C-1000. The sudden decrease in the supercapacitance for Ni(OH)2@C-1000 might be ascribed to its poor α-Ni(OH)2 crystallinity. Moreover, the supercapacitance is not only related to the intrinsic features of the surface coated α-Ni(OH)2, but also to the accessibility/transportation of the electrolyte ions. From the MO adsorption curves, it seems that the Ni(OH)2@C-900 had the highest MO adsorption capacity (Fig. 9), suggesting that it has the highest effective surface area in the KOH electrolytes. In contrast, the Ni(OH)2@C-1000 has the poorest effective surface area, and this is unfavourable for the accessibility of electrolyte ions. In addition, the internal resistance (Rs) of Ni(OH)2@C-1000 is higher than that of Ni(OH)2@C-900, which leads to the poor transportation of electrolyte ions. This might be another reason for its inferior electrochemical performance.
4. Conclusions
In this study, a unique hybrid core–shell structure with a sponge-like shell material was synthesized by a hydrothermal method. The derived N-rich carbon core was carbonized from styrene–acrylonitrile copolymer particles, and the shell consisted of α-Ni(OH)2 nanosheets. When α-Ni(OH)2@C was employed as an electrode material for supercapacitors, a high specific capacitance of 333.84 F g−1 at a current density of 0.5 A g−1 could be obtained when the carbonization temperature used to prepare the carbon core was 900 °C, and the electrode maintained 75.34% of its initial capacitance after recycling 3000 times. The special core–shell structure with its sponge-like surface morphology as well as the good crystallinity of the α-Ni(OH)2 covering the grape-like carbon spheres are closely related and beneficial for electrochemical performance.Acknowledgements
The research was financially supported from the Primary Research & Development Plan of Jiangsu Province (BE2016183), the Natural Science Foundation of Jiangsu Province for Youth (BK20160960), and the Natural Science Fund for Colleges and Universities in Jiangsu Province (16KJB430022).Notes and references
- S. Chen, R. Ramachandran, V. Mani and R. Saraswathi, Int. J. Electrochem. Sci., 2014, 9, 4072–4085 Search PubMed
.
- R. Kotz and M. Carlen, Electrochim. Acta, 2000, 45, 2483–2498 CrossRef CAS
.
- G. A. Snook, P. Kao and A. S. Best, J. Power Sources, 2011, 196, 1–12 CrossRef CAS
.
- M. Inagaki, H. Konno and O. Tanaike, J. Power Sources, 2010, 195, 7880–7903 CrossRef CAS
.
- H. Zhou, Y. Peng, H. B. Wu, F. Sun, H. Yu, F. Liu, Q. Xu and Y. Lu, Nano Energy, 2016, 21, 80–89 CrossRef CAS
.
- D. Zhang, L. Zheng, Y. Ma, L. Lei, Q. Li, Y. Li, H. Luo, H. Feng and Y. Hao, ACS Appl. Mater. Interfaces, 2014, 6, 2657–2665 CAS
.
- A. Chinnappan, C. Baskar, H. Kim and S. Ramakrishna, J. Mater. Chem. A, 2016, 4, 9347–9361 CAS
.
- H. Yi, H. Wang, Y. Jing, T. Peng, Y. Wang, J. Guo, Q. He, Z. Guo and X. Wang, J. Mater. Chem. A, 2015, 3, 19545–19555 CAS
.
- H. Gu, C. Ma, J. Gu, J. Guo, X. Yan, J. Huang, Q. Zhang and Z. Guo, J. Mater. Chem. C, 2016, 4, 5890–5906 RSC
.
- X. Yan, J. Gu, G. Zheng, J. Guo, A. M. Galaska, J. Yu, M. A. Khan, L. Sun, D. P. Young, Q. Zhang, S. Wei and Z. Guo, Polymer, 2016, 103, 315–327 CrossRef CAS
.
- Y. Huang, L. Peng, Y. Liu, G. Zhao, J. Y. Chen and G. Yu, ACS Appl. Mater. Interfaces, 2016, 8, 15205–15215 CAS
.
- X. Wang, L. Liu, X. Wang, L. Bai, H. Wu, X. Zhang, L. Yi and Q. Chen, J. Solid State Electrochem., 2011, 15, 643–648 CrossRef CAS
.
- W. Xiong, M. Liu, L. Gan, Y. Lv, Z. Xu, Z. Hao and L. Chen, Colloids Surf., A, 2012, 411, 34–39 CrossRef CAS
.
- J. Zhao, H. Lai, Z. Lyu, Y. Jiang, K. Xie, X. Wang, Q. Wu, L. Yang, Z. Jin, Y. Ma, J. Liu and Z. Hu, Adv. Mater., 2015, 27, 3541–3545 CrossRef CAS PubMed
.
- J. Han, G. Xu, B. Ding, J. Pan, H. Dou and D. R. MacFarlane, J. Mater. Chem. A, 2014, 2, 5352–5357 CAS
.
- S. Zhang, Y. Li and N. Pan, J. Power Sources, 2012, 206, 476–482 CrossRef CAS
.
- W. Zhao, J. Kong, H. Liu, Q. Zhuang, J. Gu and Z. Guo, Nanoscale, 2016 10.1039/c6nr06622d
.
- J. Gu, X. Yang, Z. Lv, N. Li, C. Liang and Q. Zhang, Int. J. Heat Mass Transfer, 2016, 92, 15–22 CrossRef CAS
.
- J. Gu, N. Li, L. Tian, Z. Lv and Q. Zhang, RSC Adv., 2015, 5, 36334–36339 RSC
.
- S. Chen, J. Zhu, X. Wu, Q. Han and X. Wang, ACS Nano, 2010, 4, 2822–2830 CrossRef CAS PubMed
.
- Y. Chen, X. Zhang, D. Zhang, P. Yu and Y. Ma, Carbon, 2011, 49, 573–580 CrossRef CAS
.
- X. Dong, N. Hu, L. Wei, Y. Su, H. Wei, L. Yao, X. Li and Y. Zhang, J. Mater. Chem. A, 2016, 4, 9739–9743 CAS
.
- X. Cao, Y. Shi, W. Shi, G. Lu, X. Huang, Q. Yan, Q. Zhang and H. Zhang, Small, 2011, 22, 3163–3168 CrossRef PubMed
.
- Y. Zhai, Y. Dou, D. Zhao, P. F. Fulvio, R. T. Mayes and S. Dai, Adv. Mater., 2011, 23, 4828–4850 CrossRef CAS PubMed
.
- W. Lu, M. Liu, L. Miao, D. Zhu, X. Wang, H. Duan, Z. Wang, L. Li, Z. Xu, L. Gan and L. Chen, Electrochim. Acta, 2016, 205, 132–141 CrossRef CAS
.
- J. Chen, J. Xu, S. Zhou, N. Zhao and C. P. Wong, Nano Energy, 2016, 25, 193–202 CrossRef
.
- U. B. Nasini, V. G. Bairi, S. K. Ramasahayam, S. E. Bourdo, T. Viswanathan and A. U. Shaikh, J. Power Sources, 2014, 250, 257–265 CrossRef CAS
.
- J. Zhou, J. Lian, L. Hou, J. Zhang, H. Gou, M. Xia, Y. Zhao, T. A. Strobel, L. Tao and F. Gao, Nat. Commun., 2015, 6, 8503 CrossRef CAS PubMed
.
- J. Gao, X. Wang, Y. Zhang, J. Liu, Q. Lu and M. Liu, Electrochim. Acta, 2016, 207, 266–274 CrossRef CAS
.
- Y. Zhou, S. L. Candelaria, Q. Liu, Y. Huang, E. Uchaker and G. CaO, J. Mater. Chem. A, 2014, 2, 8472–8482 CAS
.
- Y. Li, S. Zhang, H. Song, X. Chen, J. Zhou and S. Hong, Electrochim. Acta, 2015, 180, 879–886 CrossRef CAS
.
- L. Z. Fan, S. Qiao, W. Song, M. Wu, X. He and X. Qu, Electrochim. Acta, 2013, 105, 299–304 CrossRef CAS
.
- M. Seredych, E. Rodriguez-Castellon and T. J. Bandosz, ChemSusChem, 2015, 8, 1955–1965 CrossRef CAS PubMed
.
- Y. Zhou, A. D. Brittain, D. Kong, M. Xiao, Y. Meng and L. Sun, J. Mater. Chem. C, 2015, 3, 6947–6961 RSC
.
- Y. Zhou, Z. Mao, W. Wang, Z. Yang and X. Liu, ACS Appl. Mater. Interfaces, 2016 DOI:10.1021/acsami.6b10640
.
- L. B. Kong, J. Zhang, J. J. An, Y. C. Luo and L. Kang, J. Mater. Sci., 2008, 43, 3664–3669 CrossRef CAS
.
- W. Wang, S. Guo, I. Lee, K. Ahmed, J. Zhong, Z. Favors, F. Zaera, M. Ozkan and C. S. Ozkan, Sci. Rep., 2014, 4, 4452 Search PubMed
.
- S. Ci, Z. Wen, Y. Qian, S. Mao, S. Cui and J. Chen, Sci. Rep., 2015, 5, 11919 CrossRef PubMed
.
- C. Ye, Z. M. Lin and S. Z. Hui, J. Electrochem. Soc., 2005, 152, 1272–1278 CrossRef
.
- Y. Wang, Y. Lei, J. Li, L. Gu, H. Yuan and D. Xiao, ACS Appl. Mater. Interfaces, 2014, 6, 6739–6747 CAS
.
- J. Rajeswari, P. S. Kishore, B. Viswanathan and T. K. Varadarajan, Electrochem. Commun., 2009, 11, 572–575 CrossRef CAS
.
- Y. Yang, S. Ren, X. Song, Y. Guo, D. Si, H. Jing, S. Ma, C. Hao and M. Ji, Electrochim. Acta, 2016, 209, 350–359 CrossRef CAS
.
- H. Wang, Z. Xu, H. Yi, H. Wei, Z. Guo and X. Wang, Nano Energy, 2014, 7, 86–96 CrossRef CAS
.
- Y. Wang, J. Guo, T. Wang, J. Shao, D. Wang and Y. W. Yang, Nanomaterials, 2015, 5, 1667–1689 CrossRef CAS
.
- J. Zhu, M. Chen, H. Wei, N. Yerra, N. Haldolaarachchige, Z. Luo, D. P. Young, T. C. Ho and S. Wei, Nano Energy, 2014, 6, 180–192 CrossRef CAS
.
- L. Q. Mai, A. M. Khan, X. Tian, K. M. Hercule, Y. L. Zhao, X. Lin and X. Xu, Nat. Commun., 2013, 4, 2923 Search PubMed
.
- M. Chen, Z. Wang, A. Wang, W. Li, X. Liu, L. Fu and W. Huang, J. Mater. Chem. A, 2016, 4, 9865–9872 CAS
.
- J. Gu, X. Yang, C. Li and K. Kou, Ind. Eng. Chem. Res., 2016, 55, 10941–10946 CrossRef CAS
.
- J. Gu, C. Liang, J. Dang, W. Dong and Q. Zhang, RSC Adv., 2016, 6, 35809–35814 RSC
.
- Y. Zhou, A. Wang, Z. Wang, M. Chen, W. Wang, L. Sun and X. Liu, RSC Adv., 2015, 5, 93969–93978 RSC
.
- H. Cui, J. Xue, W. Ren and M. Wang, J. Nanopart. Res., 2014, 16, 2601 CrossRef
.
- B. Dong, H. Zhou, J. Liang, L. Zhang, G. Gao and S. Ding, Nanotechnology, 2014, 25, 435403 CrossRef PubMed
.
| This journal is © The Royal Society of Chemistry 2016 |


