DOI:
10.1039/C6RA24355J
(Paper)
RSC Adv., 2016,
6, 109495-109505
Controlled exfoliation of monodispersed MoS2 layered nanostructures by a ligand-assisted hydrothermal approach for the realization of ultrafast degradation of an organic pollutant†
Received
30th September 2016
, Accepted 10th November 2016
First published on 10th November 2016
Abstract
Molybdenum disulfide (MoS2) layered nanosheets were synthesized by the hydrothermal method. Citric acid was used as an organic ligand to obtain the monodispersed layered MoS2 nanostructures. The effect of citric acid on the formation and functional properties of the layered MoS2 nanostructures was investigated. The X-ray diffraction patterns revealed the formation of a hexagonal crystal structure of MoS2. Significant peak shift was observed for the interaction of citric acid and Mo in the core level spectra of X-ray photoelectron spectroscopy. Citric acid-free hydrothermal growth resulted in the formation of micron-sized MoS2 nanospheres, whereas citric acid-assisted hydrothermal growth resulted in the formation of well dispersed layers of MoS2, confirmed by morphological analysis. However, the highest concentration of citric acid resulted in the formation of aggregated layers. The obtained MoS2 nanostructures were used as photocatalysts to decompose methylene blue (MB) as a model pollutant. The obtained results showed that the MoS2 layered nanosheets could effectively decompose the organic pollutant. The MB absorption peaks completely disappeared after 24 min of irradiation when using the nanosheets synthesized with a citric acid concentration of 0.04 M. The effect of pH on the MoS2 nanosheets was studied, and 96% MB degradation was observed at pH 12 after 2 min of visible-light irradiation.
1. Introduction
A new two-dimensional (2D) material, molybdenum disulfide (MoS2), with a direct band gap of 1.82 eV, has attracted immense interest in various applications. For example, MoS2 has been utilized for applications such as lithium ion batteries, dye-sensitized solar cells, gas sensors, photodetectors, memory devices, catalysts for hydrogen evolution and photocatalysts for dye degradation. Layered structures of MoS2 have been extensively investigated as photocatalysts for decomposing organic compounds. The layered structure of MoS2 consists of Mo–S–Mo units sandwiched in a graphite-like manner by relatively weak van der Waals forces.1,2 The size of its direct band gap makes it a visible-active photocatalyst.3,4 Charge carriers are generated in the valence band and the conduction band of MoS2 under light irradiation. The recombination rate of the photo-generated electron–hole pair is problematically high; however, recombination can be effectively suppressed by the formation of specific layered nanostructures.5–9
Several methods have been applied to obtain the required MoS2 nanostructures, such as wet chemical synthesis, thermal oxidation, microwave-assisted synthesis and the hydrothermal method. Many researchers have focused on the direct exfoliation of MoS2 crystals in solvents to obtain layered MoS2 nanosheets. The exfoliation of MoS2 crystals can be performed by ultra-sonication or shear mixing in solvents with surface tensions close to 40 mJ m2.10 The best exfoliation results have been achieved by using high-boiling organic solvents, such as N-methyl-2-pyrrolidone (NMP), or surfactant solutions.11 Recently, Jawaid and co-workers have shown that the exfoliation yield in NMP is sensitive to trace water and dissolved oxygen.12 Xu et al. have reported a strategy for exfoliating crystalline MoS2 into a suspension of nanosheets with retention of the semiconducting phase.13
In addition to the exfoliation process, hydrothermal growth has been explored for the synthesis of MoS2 layered nanostructures. For example, Sheng et al. synthesized flower-like MoS2 nanospheres by applying the hydrothermal method at 220 °C for 24 h and investigated their photocatalytic properties.14 Zhou et al. synthesized porous MoS2 by hydrothermal growth at 240 °C for 24 h and measured its visible-light photocatalytic activity.15 However, the fast hydrolysis process led to the formation of an irregular morphology with large particle sizes. To synthesize nanoparticles without agglomeration, organic ligands have been used. For example, Wang et al. synthesized monodispersed MoS2 nanoparticles using different capping agents, such as hexadecyltrimethylammonium bromide (CTAB) and polyvinylpyrrolidone (PVP), by the hydrothermal method, and measured their ability to catalyze the reactivity of 4-methylphenol.16 Hence, because of the strong influence of the capping agent on the synthesis of monodispersed MoS2, it is important to investigate the ability of other capping agents to assist the production of layered MoS2 nanostructures.
Citric acid has been used as a capping agent to obtain layered nanostructures.17 Citric acid possesses three carboxyl groups (–COO) and one hydroxyl group (–OH), which can serve as binding sites. It has been used in fabricating inorganic nanomaterials as a nontoxic and stable biological ligand for metal ions.18 It has been established that citric acid is an effective capping agent for stabilizing nanoparticles because of the formation of citrate ions.19 Citric acid exerts a strongly retarding effect on crystal nucleation and growth via its adsorption on crystal facets,19,20 which effectively prevents catalyst aggregation. Moreover, there are several reports of the use of citric acid for the growth of MoS2 nanostructures. Santillo et al. synthesized MoS2 nanoparticles and investigated the effect of citric acid on their formation.17 Vattikuti et al. controlled the morphology of MoS2 nanorods formed by the co-precipitation method, exploiting the crucial role played by citric acid in the formation of the nanorods.21 However, a disadvantage shared by the above synthetic methods is that they involved multiple steps and resulted in the formation of large-sized nanostructures. Therefore, it is vital to develop a simple processing scheme for the preparation of MoS2 layered nanostructures by a facile hydrothermal method.
In the present work, we have synthesized layered MoS2 nanostructures by the hydrothermal method, using citric acid as a capping ligand. The effect of the concentration of citric acid on the formation of layered MoS2 was investigated. The photocatalytic activity of the prepared samples was assessed by measuring the decomposition rate of methylene blue (MB) in aqueous solution under visible-light irradiation. The effect of pH on the MB degradation was also studied. Finally, a possible formation mechanism of the nanostructures was proposed.
2. Experimental section
All the chemicals were of analytical grade and used without further purification. Sodium molybdate dehydrate (Na2MoO4·2H2O), thioacetamide (C2H5NS), citric acid (C6H8O7), sodium hydroxide (NaOH) and hydrochloric acid (HCl) were purchased from Wako Chemicals, Japan.
In a typical synthesis, 0.04 M of sodium molybdate dihydrate was dissolved in 50 mL of deionized water and allowed to stir until complete dissolution of the compound. 0.08 M of thioacetamide was added and the reaction was allowed to stir for 3 h. Finally, the mixture was transferred into a Teflon-lined autoclave and maintained at 180 °C for 24 h. The obtained precipitate was separated by centrifugation and washed several times with deionized water and ethanol. The obtained product was dried at 80 °C for 10 h. The samples of this product were denoted CA0. For the synthesis of citric acid-capped nanostructures, citric acid at four different concentrations, namely, 0.01, 0.02, 0.04 and 0.05 M, was added to the mixture of 0.04 M sodium molybdate dehydrate and 0.08 M thioacetamide under vigorous stirring, and the remaining procedure was followed as described for CA0. These samples were denoted CA1 (0.01 M), CA2 (0.02 M), CA3 (0.04 M) and CA4 (0.05 M).
The structure of the product was characterized by a Rigaku X-ray diffractometer (XRD) (RINT 2200, Japan) with CuKα radiation and a step interval of 0.02° s−1. The morphology of the product was measured by a field emission scanning electron microscope (FESEM) (JEOL JSM 7001F microscope) at an accelerating voltage of 15 kV and a transmission electron microscope (TEM) (JEOL JEM 2100F microscope) at an accelerating voltage of 200 kV. UV-vis spectroscopy analyses were performed by a Shimadzu 3100 PC spectrophotometer (Japan). X-ray photoelectron spectroscopy (XPS) was performed by a Shimadzu ESCA 3400 (Japan).
The photocatalytic activity of the synthesized MoS2 samples was evaluated by examining the photo-assisted degradation of MB, as a model dye, at room temperature under a xenon light source (MAX-303, Asahi Spectra) as a source of visible-light irradiation. The procedure was adopted from a previous report, with the following modification.22 In a typical reaction, the amount of dye was fixed at 5 mg and the solution pH was controlled at the desired level by the addition of NaOH. At regular time intervals, 3 mL of the suspension was collected, centrifuged, and analyzed by a UV-vis spectrometer. The degradation of MB was quantified from the decrease in the intensity of the associated characteristic absorption band at 664 nm. The photodegradation percentage of MB was calculated using the following equation:22
| |
 | (1) |
where
C0 and
Ct are the concentrations of MB at time 0 and
t (s), respectively, where
t is the irradiation time.
3. Results and discussion
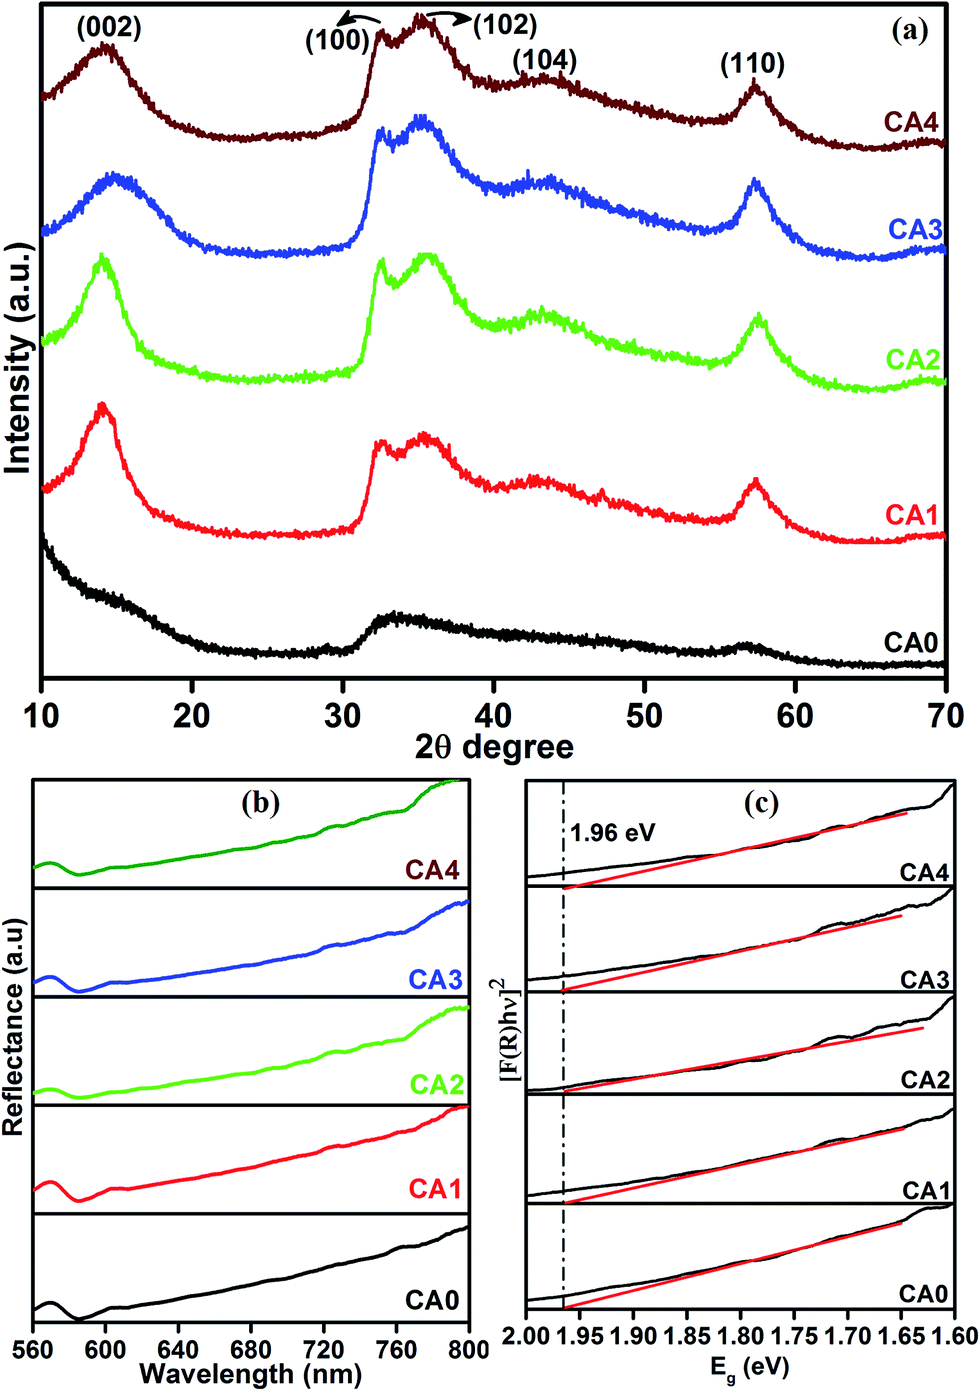
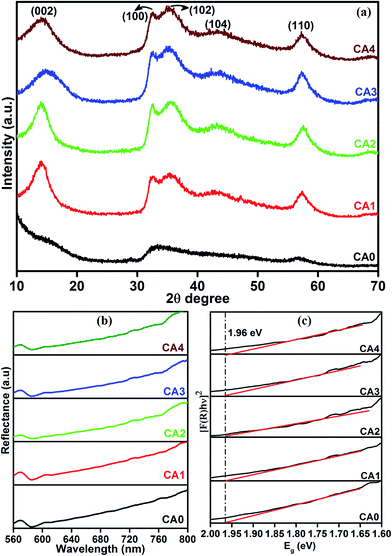
The XRD patterns of the pure (CA0) and citric acid-capped MoS2 structures (CA1, CA2, CA3, and CA4) are shown in Fig. 1(a). The pure sample exhibited a poorly crystalline structure. In contrast, the citric acid-capped MoS2 possessed crystal planes with clear peak positions, closely matching the standard diffraction pattern of hexagonal MoS2 (JCPDS card no. 24-0513). These results suggested that the citric acid played a crucial role in the formation of the hexagonal crystal structure.23 We attribute this to the ability of the capping agent to retard the process of nucleation and particle growth during the reaction. Fig. 1(b) shows the UV-vis diffuse reflectance spectroscopy of as-prepared MoS2 layered nanosheets. It was found that the samples exhibited the strong light absorption in the wavelength range of 600–800 nm.24 As shown in Fig. 1(c), the bandgap of the samples is 1.96 eV. The obtained bandgap data indicated that the MoS2 shows a blue shift bandgap of 1.96 eV compared to bulk MoS2 of 1.23 eV.25,26
 |
| | Fig. 1 (a) XRD, (b) UV-vis diffuse reflectance spectra (DRS) and (c) band gap plot of MoS2 layered nanosheets. | |
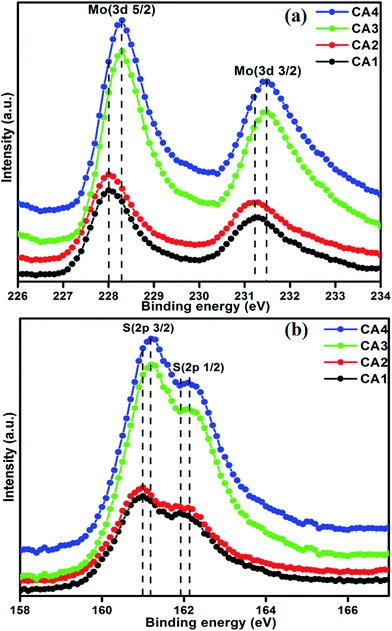
The core-level electronic states of the MoS2 nanostructures were investigated by XPS analysis, as shown in Fig. 2(a) and (b). Fig. 2(a) shows the high-resolution XPS spectra of the Mo 3d state, with two symmetric peaks. The peaks at 228 and 231.20 eV correspond to Mo 3d5/2 and Mo 3d3/2, respectively. Their presence implies that the Mo was in the Mo4+ state. The separation energy between Mo 3d5/2 and Mo 3d3/2 was 3.2 eV, a typical value for this element.27 When the concentration of citric acid was increased from 0.04 M (CA3) to 0.05 M (CA4), the peak positions of samples were shifted from 228 to 228.30 eV for Mo 3d5/2 and 231.20 to 231.50 eV for Mo 3d3/2 state, respectively. This slight shift is attributed to the interaction of Mo and citric acid. Fig. 2(b) shows the high-resolution XPS spectra of the S 2p state. The S 2p peaks of CA1 can be deconvoluted into two peaks at 161 and 161.90 eV, which correspond to S 2p3/2 and S 2p1/2, respectively. These peaks exhibited a similar shift to that of the Mo 3d peaks between the CA3 and CA4 samples, i.e., from 161 to 161.20 eV and from 161.90 to 162.10 eV for S 2p3/2 and S 2p1/2, respectively, with the increase in the concentration of citric acid. The XPS core-level spectra of the Mo and S states thus provided evidence of a significant interaction of citric acid with MoS2.
 |
| | Fig. 2 XPS spectra of Mo 3d state (a) and S 2p state (b) of samples. | |
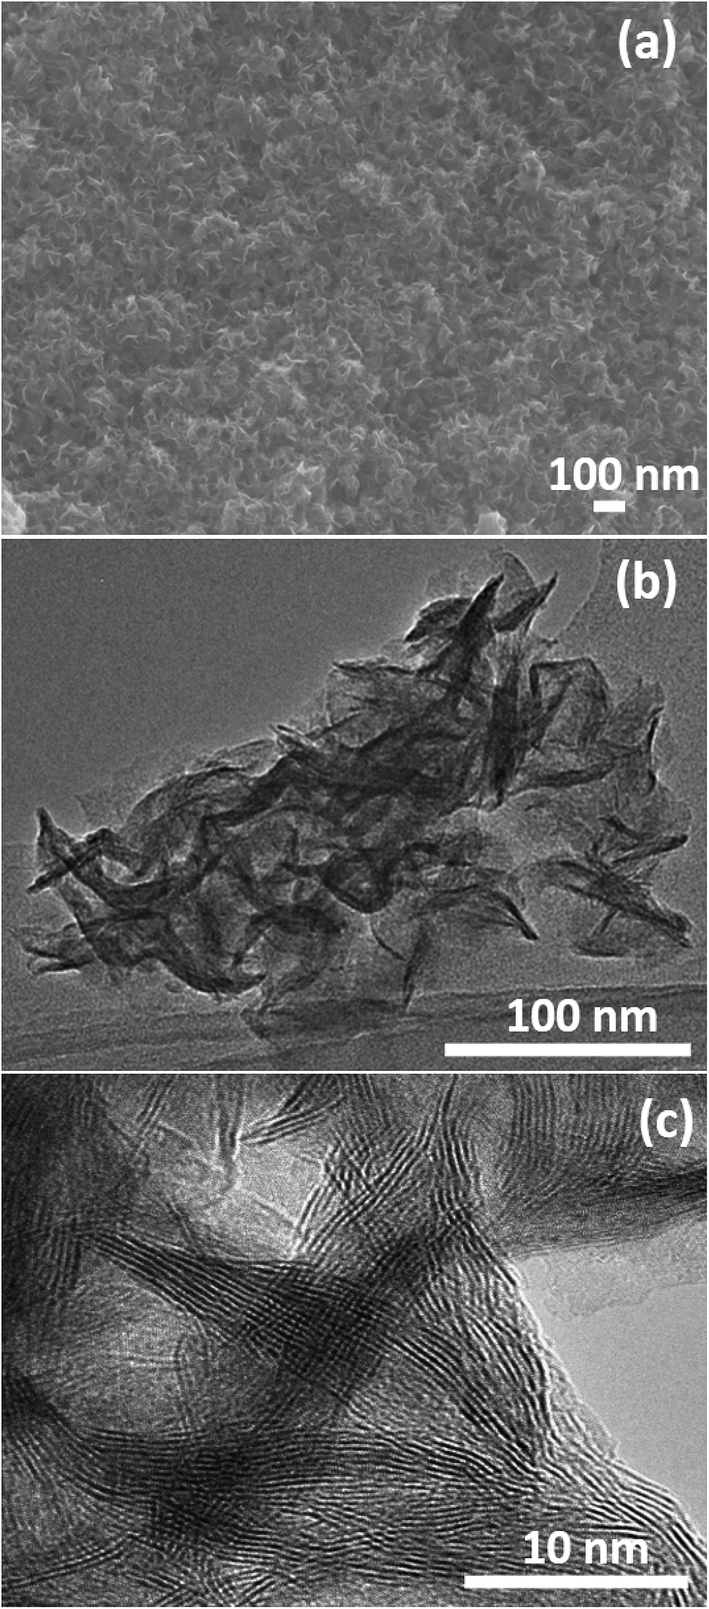
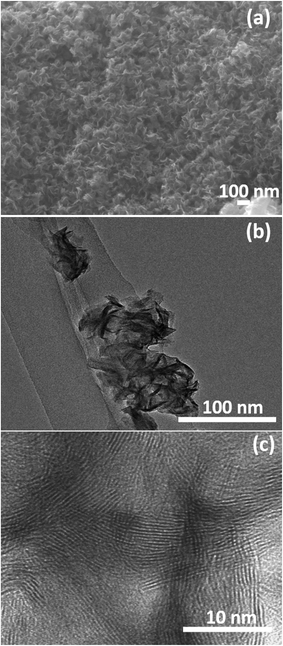
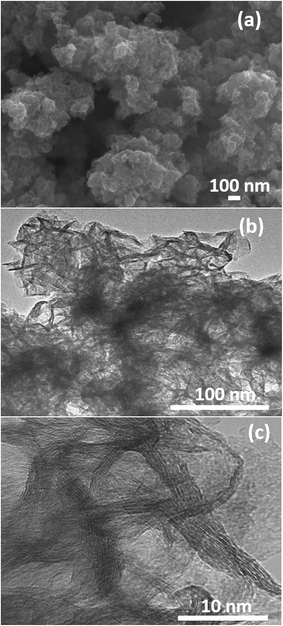
The surface morphology and microstructures of the samples were characterized by FESEM, TEM and HRTEM, as shown in Fig. 3–7. Fig. 3(a) and (b) show the morphology of the MoS2 microspheres of CA0. It can be seen that these MoS2 microspheres were composed of sheet-like subunits. In contrast, the FESEM images of sample CA1 indicated the formation of nanosheets (Fig. 4(b)). This change in morphology occurred in the presence of citric acid. When the concentration of citric acid was increased to 0.02 (CA2) and 0.04 M (CA3), similar layered nanosheets were observed, as shown in Fig. 5(b) and 6(b). With the further increase in the concentration of citric acid to 0.05 M (CA4), the MoS2 nanosheets became slightly agglomerated, as shown in Fig. 7(b). These results indicate that citric acid played a crucial role in determining the morphology of MoS2. The citric acid effectively directed the MoS2 nanostructures toward the formation of layers. The TEM and HRTEM images showed the presence of these layered MoS2 nanostructures. The agglomeration of the MoS2 nanosheets was attributed to the increased ionic strength with higher concentrations of citric acid, which facilitated interaction among the nanosheets.28 The capping agent reduced the number of dangling bonds (a form of surface defect) present on the surface of the nanosheets, thus lowering their surface energy and stabilizing their growth. HRTEM analysis confirmed a lattice spacing of 0.6 nm, corresponding to the (002) plane of the MoS2 nanosheets, as shown in Fig. 6(c).
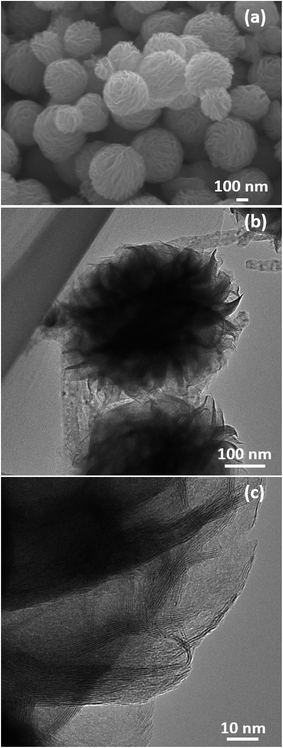 |
| | Fig. 3 FESEM, TEM and HRTEM images of sample CA0 (a–c). | |
 |
| | Fig. 4 FESEM, TEM and HRTEM images of sample CA1 (a–c). | |
 |
| | Fig. 5 FESEM, TEM and HRTEM images of sample CA2 (a–c). | |
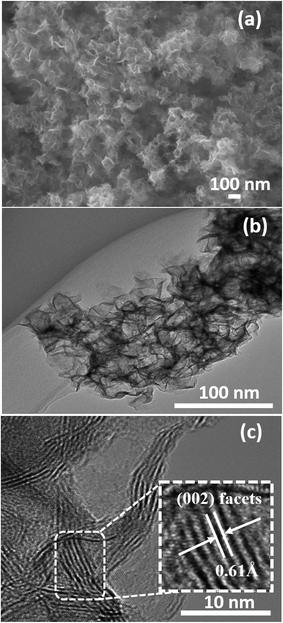 |
| | Fig. 6 FESEM, TEM and HRTEM images of sample CA3 (a–c). | |
 |
| | Fig. 7 FESEM, TEM and HRTEM images of sample CA4 (a–c). | |
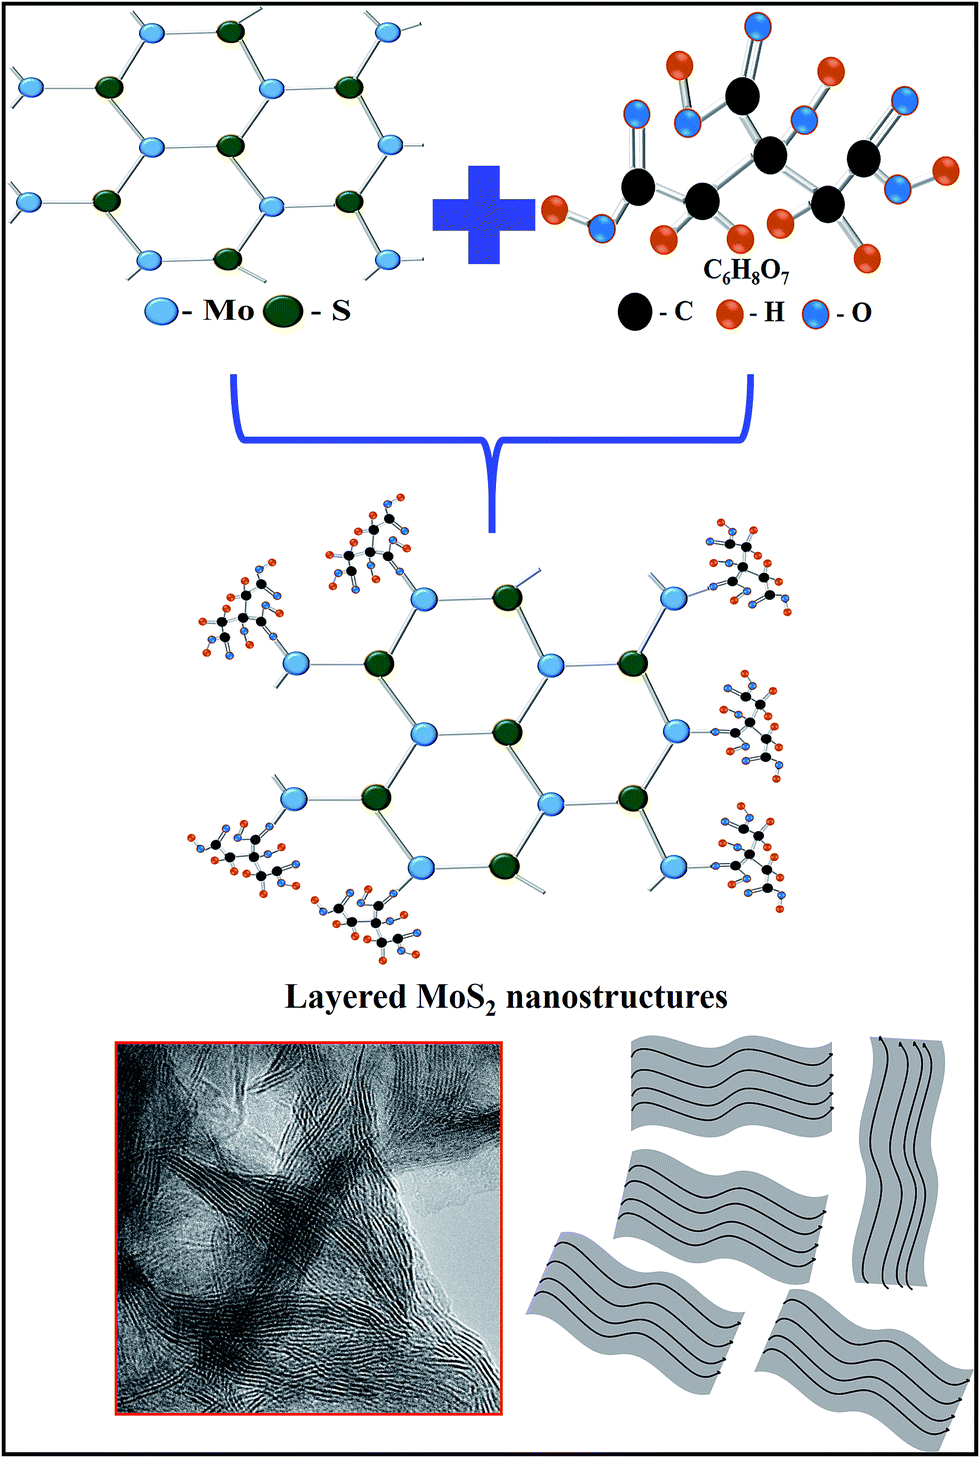
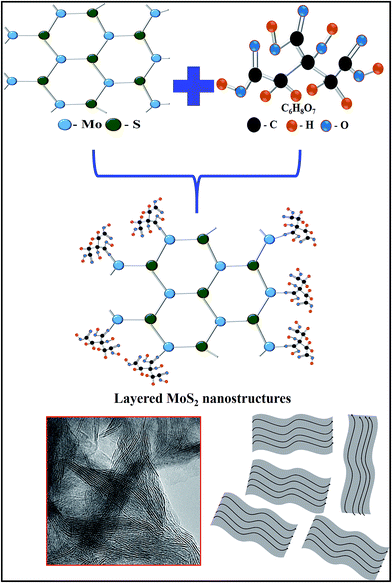
Based on the above structural and morphological analysis, we propose the following formation mechanism, as shown in Fig. 8. It has been established previously that citric acid is an effective capping agent to adjust the relative activity of the cations and retard the grain growth of MoS2. Citric acid can be hydrolyzed into [C6O7H5]3− and H+, the presence of which will affect the nucleation, growth and self-assembly of crystals. The [C6O7H5]3− ions can chelate Mo4+ to form [C6O7H5]3− [Mo4+] complexes.29,30 In these complexes, hydrogen bonds can be formed between the carboxyl groups of citric acid and the hydroxyl ions, and also between two hydroxyl ions. The self-assembly growth of MoS2 microspheres is controlled by the interaction between the [C6O7H5]3− [Mo4+] complexes and the hydrogen bonds, directing the formation of layered nanosheets.31,32 The citric acid also has the effect of reducing the Mo valence state from Mo6+ to Mo4+, in good agreement with the XPS data.33,34
 |
| | Fig. 8 Schematic reaction mechanism of layered MoS2 nanosheets. | |
3.1 Photocatalytic activity
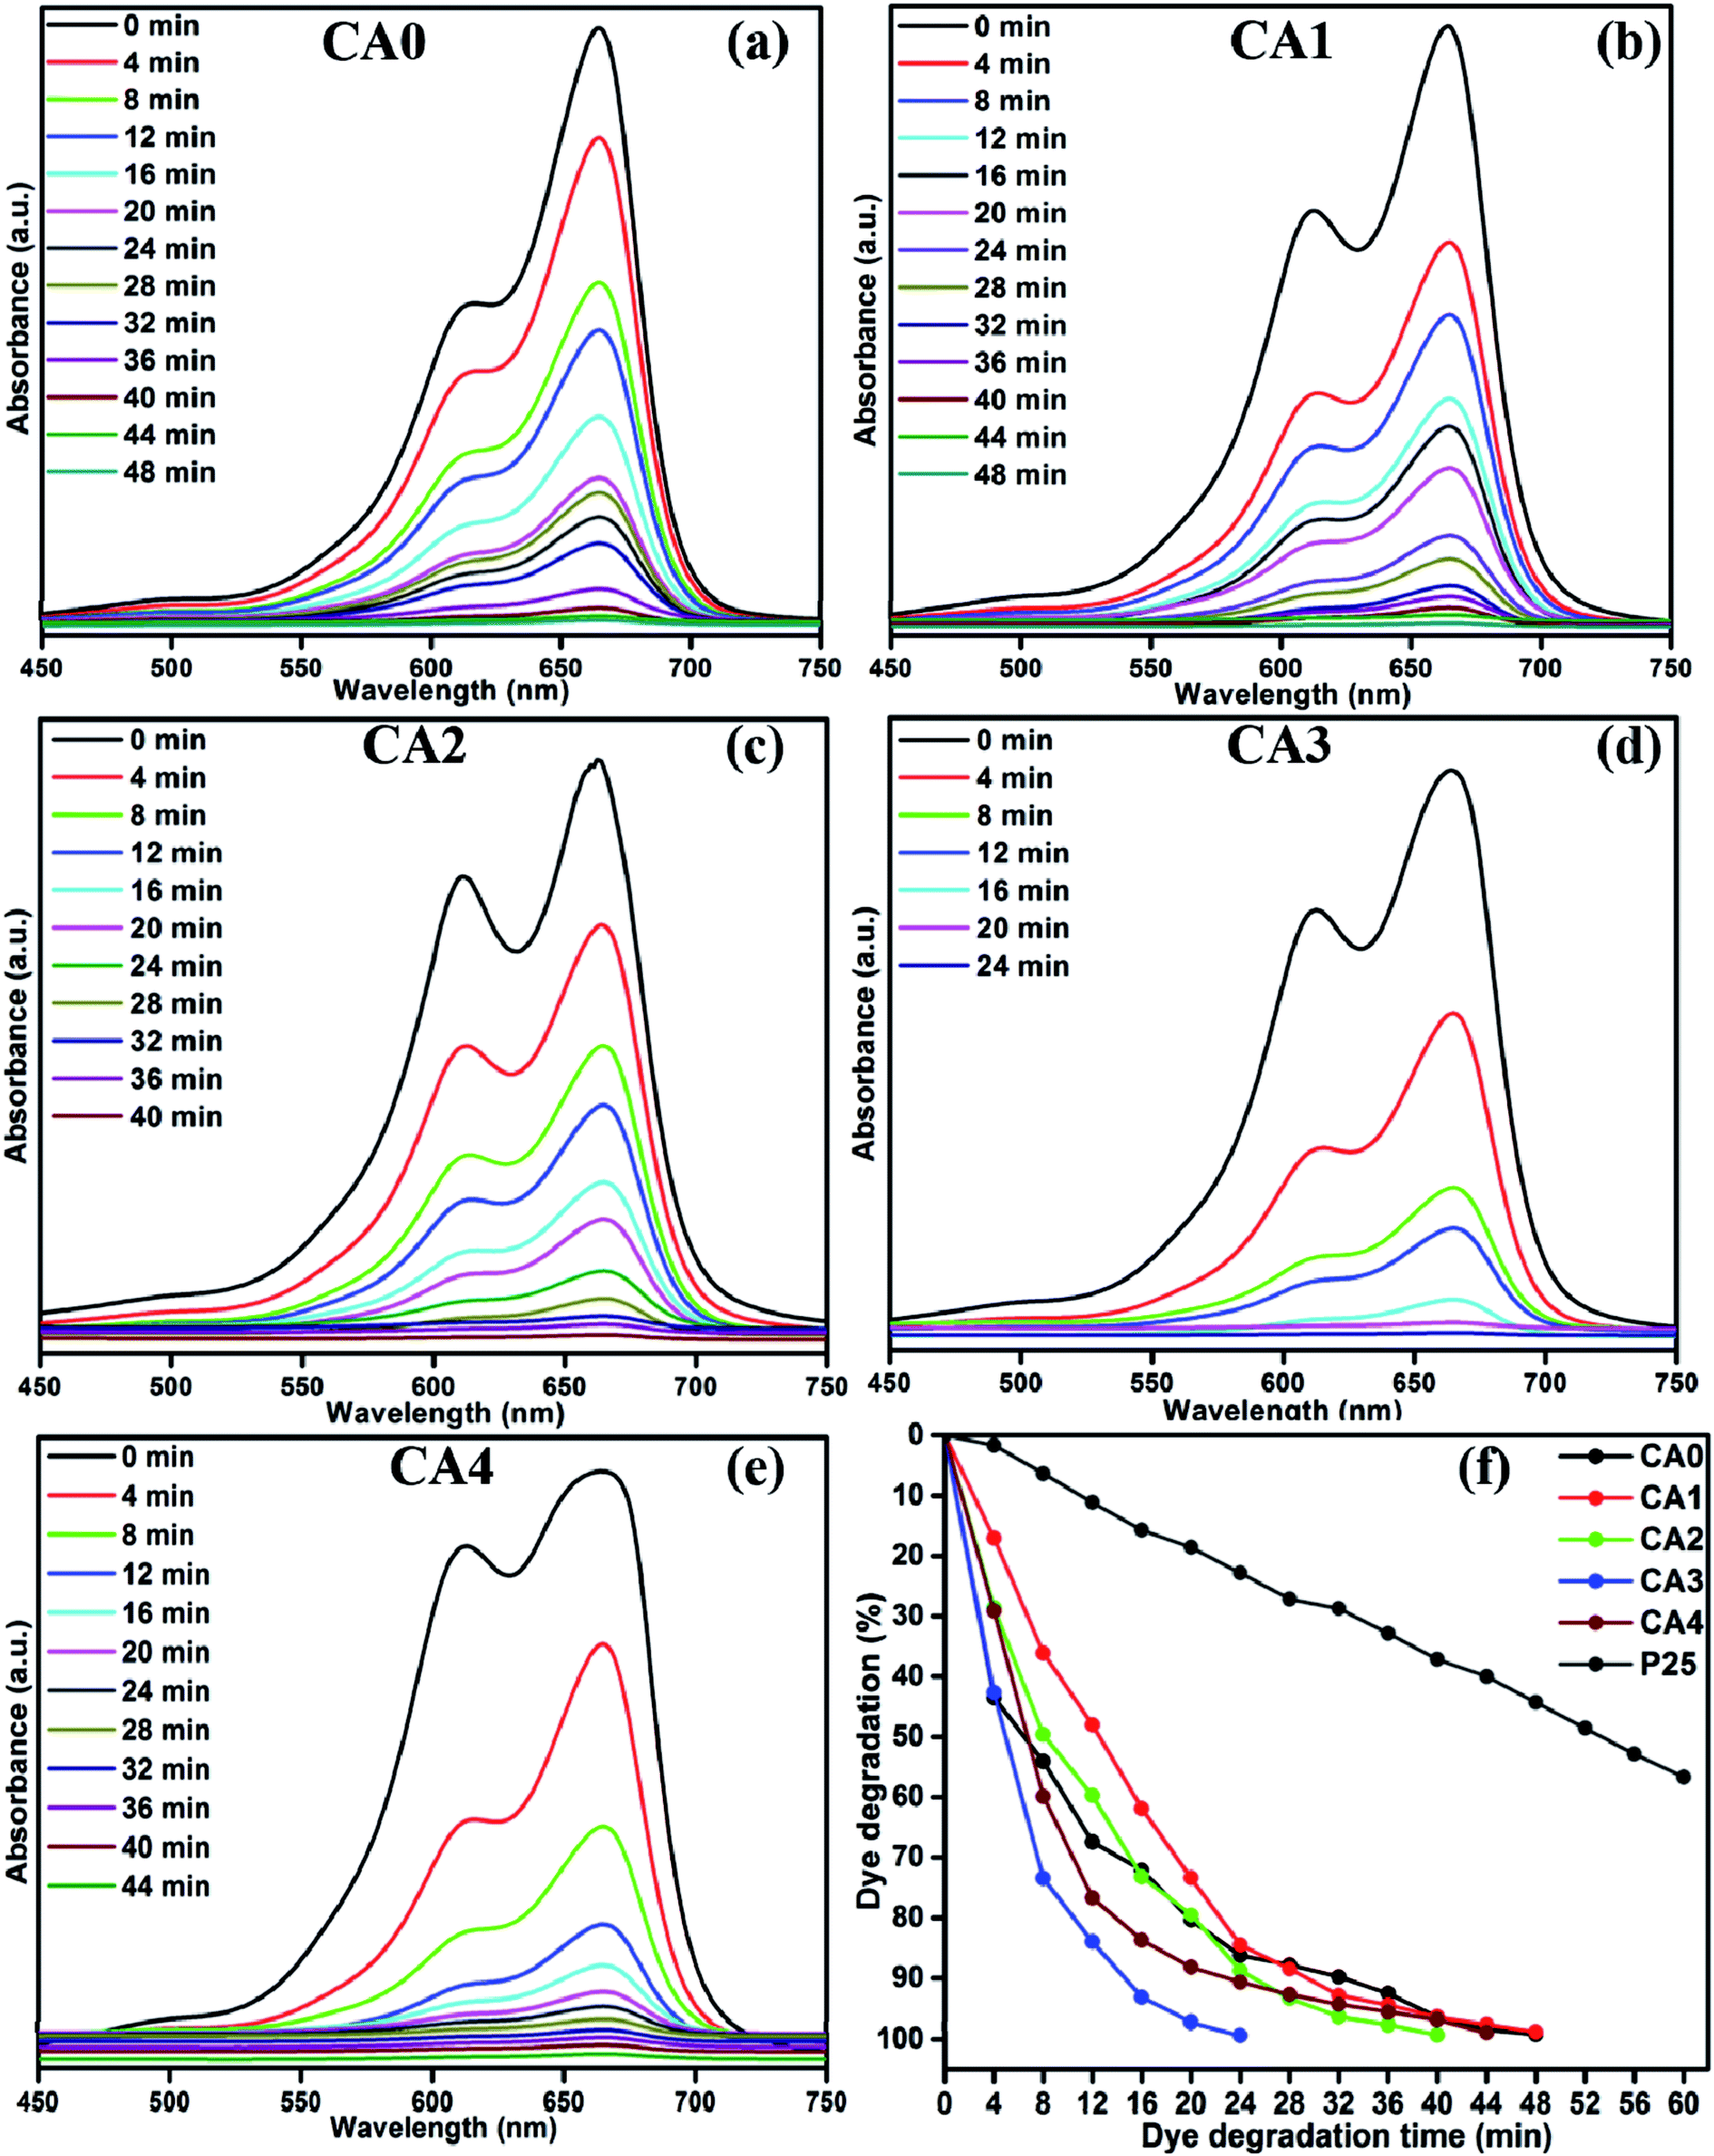
The photocatalytic activity of the MoS2 nanostructures was investigated via their ability to degrade MB as a model pollutant. Fig. 9(a) shows the time-dependent UV absorption spectrum of the pure (CA0) MoS2 catalyst under visible-light irradiation. The MB was completely decomposed after an irradiation time of 48 min. The time-dependent UV absorption spectra of MB under visible-light irradiation for samples CA1, CA2, CA3 and CA4 are shown in Fig. 9(b)–(e), respectively. For CA1, it can be seen that the maximum absorbance peak at 664 nm gradually decreased in intensity with the increase in irradiation time, and completely disappeared after 48 min. For CA2, CA3 and CA4, the total irradiation times required for the complete degradation of the MB absorbance peak were 40, 24 and 44 min, respectively. Fig. 9(f) shows the percentage of MB degradation achieved by the samples TiO2 (P25), CA0, CA1, CA2, CA3 and CA4, which were 56.89%, 99.17%, 99.30%, 98.82%, 99.37% and 98.89%, respectively. Therefore, the citric acid-capped MoS2 nanostructures showed enhanced photocatalytic activity compared with pure MoS2 and commercial TiO2 (P25) under visible-light irradiation. Among all the synthesized samples, CA3 showed the greatest photocatalytic activity and achieved complete degradation of MB within 24 min of irradiation.
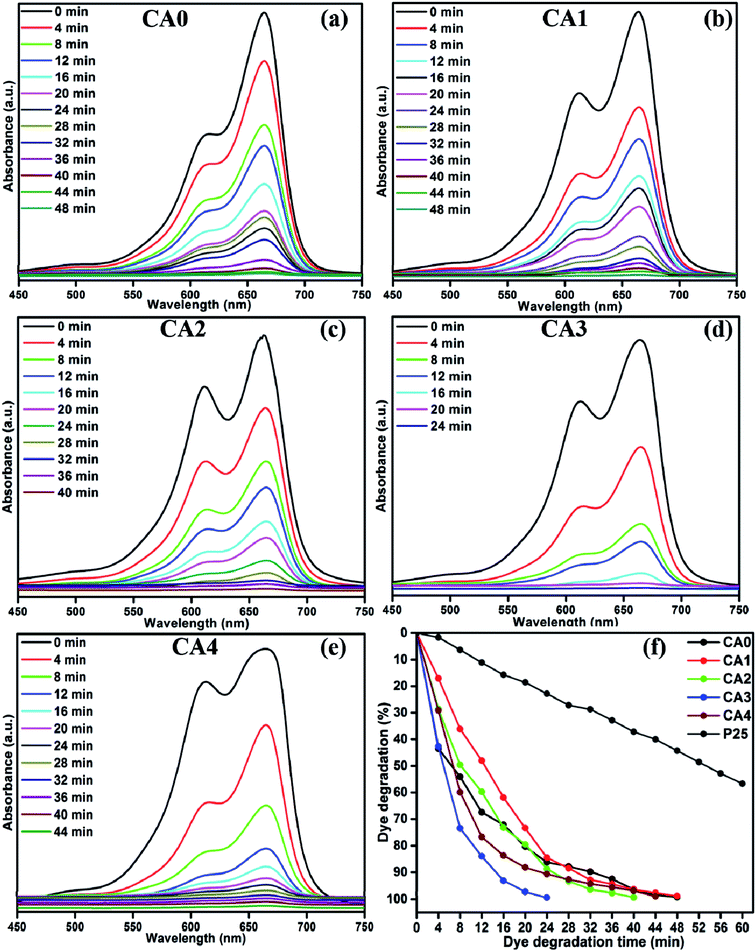 |
| | Fig. 9 UV absorbance spectra of MB samples CA0 (a), CA1 (b), CA2 (c), CA3 (d) and CA4 (e), (f) time (min) vs. dye degradation (%). | |
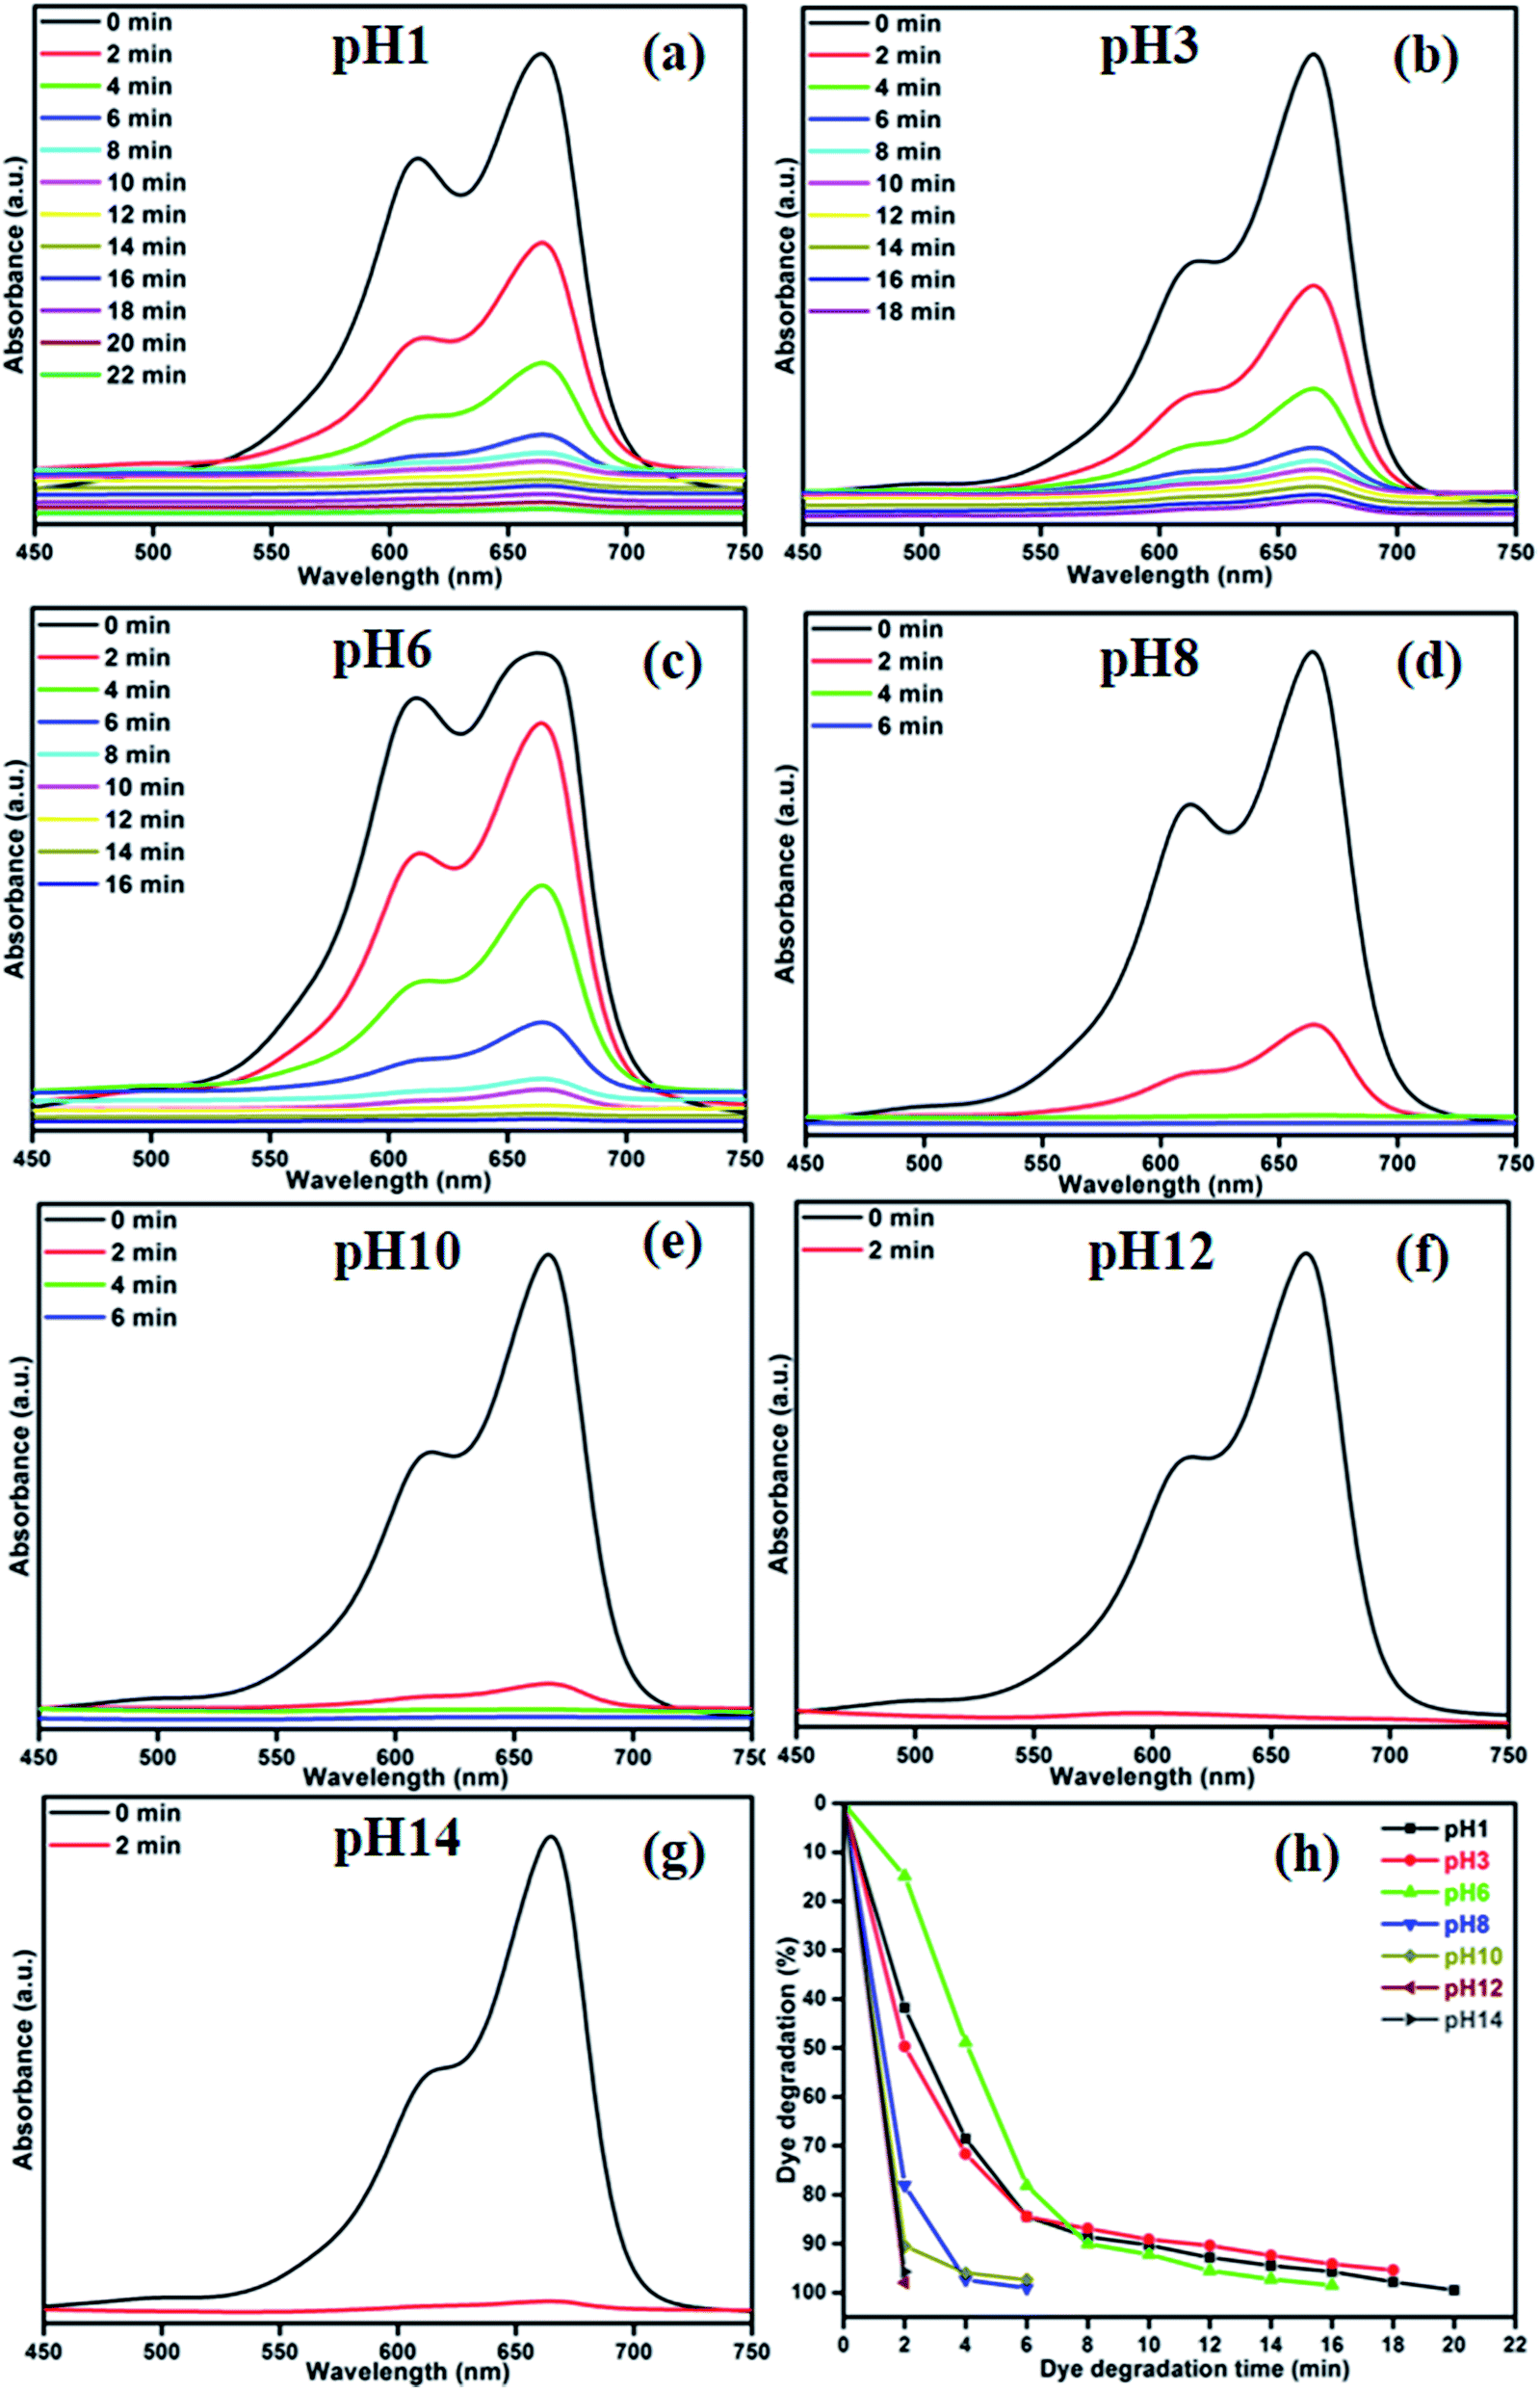
The photocatalytic decomposition of MB by sample CA3 was studied at varying pH values of the suspension, as shown in Fig. 10(a)–(g). The greatest photocatalytic activity was attained at pH 12 and 14, where 96% of the dye was degraded in 2 min. Thus, MB degradation was more active in alkaline medium. Fig. 10(h) shows the percentage of MB degraded as a function of pH. The degradation percentages achieved in 2 min at pH 1, 3, 6, 8 and 10 were 41%, 49%, 14%, 78% and 90%, respectively. The variation of photocatalytic efficiency with pH is generally an effect of the surface charge of the catalyst and the charge on the dye molecules.35 At lower pH values, the surface of the catalyst was positively charged and the degradation efficiency was low. In contrast, higher pH values can instigate the formation of a large concentration of hydroxyl ions (OH−), which can react with holes to form hydroxyl radicals (˙OH), resulting in a rapid increase in the degradation efficiency. In addition to the photocatalytic degradation of MB, we have studied the photocatalytic performance of sample CA3 under two different organic dyes (Methylene Orange (MO) and Rhodamine B (RhB)). Fig. S2† shows the percentage of MO and RhB degradation achieved by the sample CA3 which were 56.44% in 60 min for MO and 92.12% in 60 min for RhB, respectively. Whereas, the same sample exhibited the higher degradation percentage of 99.37% in 24 min under MB dye degradation. It is clear that the MB degradation of CA3 photocatalyst shows the best enhancement in the photodecomposition of MB under visible light irradiation.
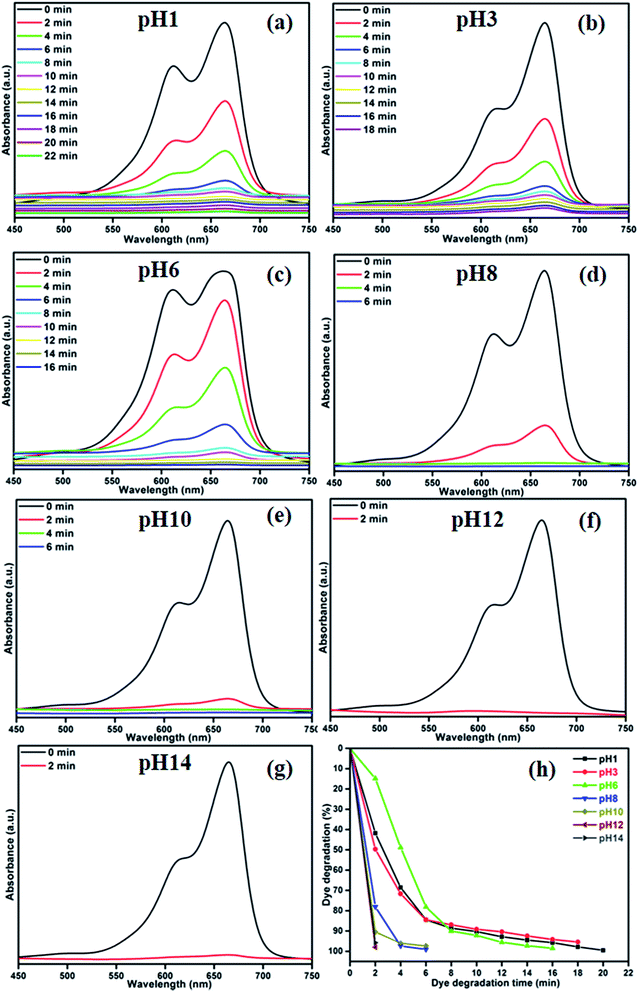 |
| | Fig. 10 Effect of pH on degradation efficiency, (a)–(g) UV absorbance spectra of MB samples and (h) time (min) vs. dye degradation (%). | |
To elucidate the photocatalytic mechanism of MB degradation over MoS2, the scavengers are used. The obtained results are shown in Fig. 11(a). Hydroxyl radical (˙OH) and superoxide anions (O2−˙) are the possible active species in the photodegradation of organic pollutants. The scavengers are known to react with reactive oxygen species preferentially over the organic dye. The nitrogen (N2) and disodium ethylenediaminetetraacetate (EDTA-2Na)24,36 were used as an electron acceptor and hole scavenger. When EDTA was added into the solution as ˙OH radical scavenger, the degradation of MB slowed down slightly as shown in Fig. 11(a). This conforms that the ˙OH radical plays a minor role in the photocatalysis process. In order to further determine the degradation mechanism, another experiment was performed under N2 atmosphere. A high purity N2 gas was continuously purged throughout the reaction process under ambient condition, which eliminates the dissolved oxygen content from the reaction solution and thereby prevents the formation of O2−˙.37,38 Therefore, it is clearly illustrated that O2−˙ radical from the reaction of photogenerated electron plays an important role, while the photogenerated h+ also contributed in certain extent for the degradation of MB in the MoS2 photocatalyst process.
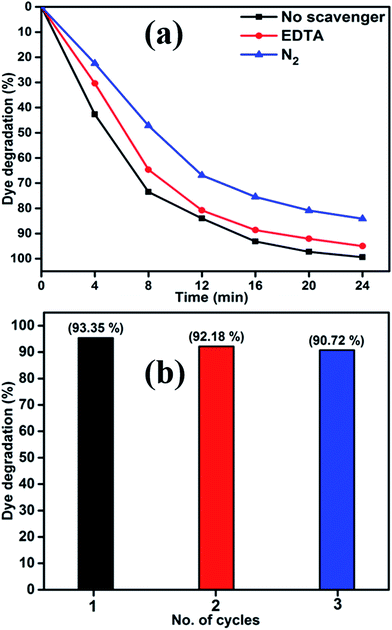 |
| | Fig. 11 (a) MB over MoS2 in the presence of various scavengers and (b) reusability of CA3 photocatalyst under visible light irradiation. | |
Fig. 11(b) shows the reusability of CA3 photocatalyst for the degradation of MB examined over three cycles under visible light irradiation. After the photocatalysis experiments, the catalyst was separated from the reaction mixture by centrifugation and the concentration of the dye solution was adjusted to its initial value. Photocatalysts were reused for three cycles and the obtained degradation values were 93.35, 92.18 and 90.72% for first, second and third cycles, respectively. The photocatalytic efficiency of the MoS2 did not declined significantly, which suggests that the catalyst had good stability and sustainability. Fig. S1(a)† shows the XRD patterns of the MoS2 after four runs under the visible light irradiation for the degradation of MB. It can be clearly observed that the phase and structure of the MoS2 remained to be unchanged after photocatalytic cycles; suggesting the sample is stable under the present photocatalytic degradation process. In addition, the photocatalytic structural stabilities and photocatalytic loss of MoS2 were investigated by XPS spectra as shown in Fig. S1(c) and (d).† From the spectra it is clear that the binding energies of Mo 3d and S 2p of the recycled MoS2 showed no peak-shift compared to those of the fresh sample, inferring that the chemical states of Mo and S elements in MoS2 did not change during the reaction process.
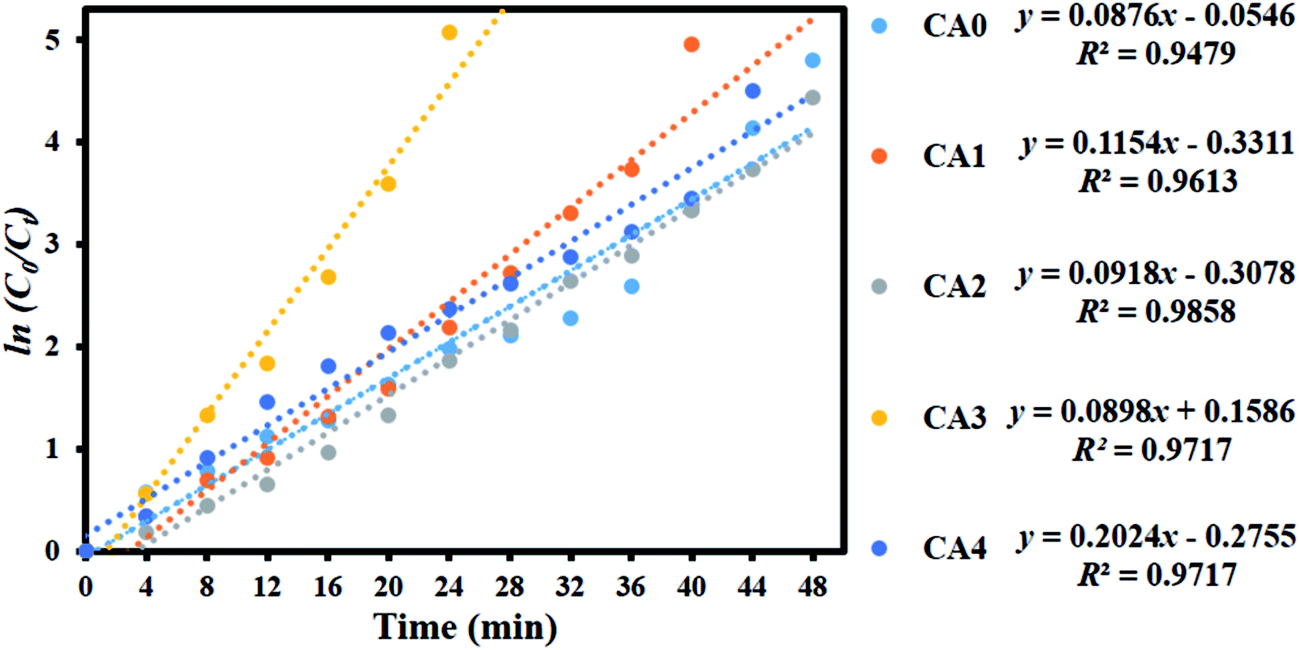
To examine whether the process was consistent with pseudo-first-order kinetics, ln(C0/Ct) was plotted versus irradiation time for the adsorption and degradation of MB on MoS2 (Fig. 12). A linear correlation was found between ln(C0/Ct) and irradiation time. The apparent rate constants Kapp obtained by the pseudo-first-order model were 0.0876, 0.1154, 0.0918, 0.2024 and 0.0898 min−1 for CA0, CA1, CA2, CA3 and CA4, respectively. The kinetic data obtained by the pseudo-first-order model, including the apparent rate constants, corresponding correlation coefficients (R2) and maximum dye degradation in the presence of the MoS2 nanostructures, are presented in Table 1. CA3 displayed a photocatalytic activity approximately twice that of the pure sample (CA0). A comparison was made between the photocatalytic performance of the materials developed in this work and those of other recently reported MoS2 nanostructures, as shown in Table 2. It can be seen that the MoS2 produced in this work showed enhanced activity, with a greater amount of dye loading (50 mg L−1). The layered MoS2 nanosheets achieved 99.37% degradation of MB in 24 min (CA3), which is higher than any other reported value, indicating the enhanced effectiveness of the nanosheets generated by our method.
 |
| | Fig. 12 Kinetic plot of ln(C0/Ct) as a function of time (min) for the degradation of MB. | |
Table 1 Observed pseudo-first-order rate constants, R2 values, maximum degradation (%) and time required for maximum degradation by MoS2 nanosheets
| Sample code |
Kapp (MoS2) |
R2 |
Maximum degradation (%) |
Time taken for maximum degradation (min) |
| CA0 |
0.0876 |
0.9479 |
99.17 |
48 |
| CA1 |
0.1154 |
0.9613 |
99.30 |
40 |
| CA2 |
0.0918 |
0.9858 |
98.82 |
48 |
| CA3 |
0.0898 |
0.9717 |
99.37 |
24 |
| CA4 |
0.2024 |
0.9717 |
98.89 |
44 |
Table 2 Comparison of photocatalytic performance of MoS2 in this research and the reported literature
| Material |
Morphology |
Dye concentration (mg L−1) |
Catalyst amount (mg) |
Light source |
Dye |
Dye degradation (%) |
Time taken for degradation (min) |
Ref. |
| MoS2 |
Flower-like spheres |
10 |
40 |
150 W xenon lamp |
MB |
95.6 |
90 |
14 |
| MoS2 |
Porous microspheres |
10 |
20 |
100 W xenon lamp |
MB |
89.2 |
150 |
15 |
| MoS2 |
Nano flowers |
30 |
20 |
175 W halogen lamp |
RhB |
97.2 |
70 |
24 |
| MoS2 |
Nano sheets |
20 |
15 |
N/A |
MO |
85 |
30 |
44 |
| MoS2/TiO2 |
Nano belts |
15 |
1 |
300 W xenon lamp |
RhB |
86.9 |
20 |
45 |
| MoS2/TiO2 |
Nano spheres |
5 |
10 |
500 W xenon lamp |
RhB |
81.8 |
180 |
46 |
| MoS2/C3N4 |
Nano sheets |
5 |
5 |
300 W xenon lamp |
RhB & MO |
N/A |
N/A |
47 |
| MoS2/GO |
Nano sheets |
1 |
10 |
500 W xenon lamp |
MB |
99 |
60 |
48 |
| MoS2 |
Nano sheets |
50 |
50 |
400 W Asahi spectra (xenon lamp) |
MB |
99.3 |
24 |
This work |
Based on the above results, we propose a possible photocatalytic mechanism of the degradation of MB under visible-light irradiation:39
| | |
MoS2 + hν → MoS2 (e−/h+)
| (2) |
| | |
˙O2− + 2H + e− → H2O2
| (5) |
| | |
H2O2 + e− → ˙OH + OH−
| (6) |
| | |
˙OH + MB → CO2 + H2O + NO3− + NH4+ + Cl−
| (8) |
MoS2 absorbs over a large fraction of the solar spectrum, as shown in Fig. 13. This process results in the excitation of electrons (e−) from the valence band (EVB = 2.3 eV) to the conduction band (ECB = 0.4 eV), subsequently generating holes (h+) in the valence band.40–42 The absorbed photons have a higher energy than the band gap of the catalyst. The photo-generated holes react with either water (H2O) or hydroxyl ions (OH−) adsorbed onto the catalyst surface to produce hydroxyl radicals (˙OH), and the photo-generated electrons react with oxygen (O2) to form superoxide radicals (˙O2−). Consequently, both ˙OH and ˙O2− radicals can decompose the organic compounds to form CO2, H2O and other inorganic molecules as harmless products.43
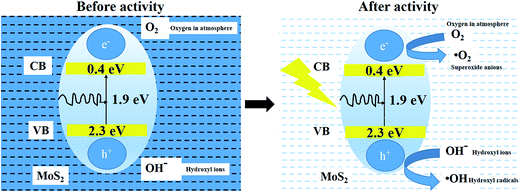 |
| | Fig. 13 Schematic representation of photocatalytic mechanism. | |
4. Conclusions
MoS2 layered nanostructures were synthesized by hydrothermal growth. The role of citric acid in the formation of the layered MoS2 nanostructures was studied. The obtained results confirmed that the citric acid played a determining role in the formation and functional properties of MoS2. The XRD patterns revealed the formation of hexagonal MoS2. The morphological analysis confirmed the presence of layered MoS2 nanostructures. The photocatalytic activity of MoS2 to degrade MB under visible-light irradiation was studied. The maximum degradation efficiency was observed within 24 min for MoS2 capped with 0.04 M citric acid. Moreover, this sample exhibited 96% degradation of the dye within 2 min at the optimum pH value, 12. This performance is superior to the commercial P25 photocatalyst.
References
- I. Song, C. Park and H. Cheul Choi, RSC Adv., 2015, 5, 7495–7514 RSC.
- S. Shang, G. Lindwall, Y. Wang, J. Redwing, T. Anderson and Z. Liu, Nano Lett., 2016, 16(9), 5742–5750 CrossRef CAS PubMed.
- X. Bokhimi, J. A. Toledo, J. Navarette, X. C. Sun and M. Portilla, Int. J. Hydrogen Energy, 2001, 26, 1271–1277 CrossRef CAS.
- A. Splendiani, L. Sun, Y. Zhang, T. Li, J. Kim, C. Yung, G. Galli and F. Wang, Nano Lett., 2010, 10, 1271–1275 CrossRef CAS PubMed.
- C. Song, K. Yu, H. Yin, H. Fu, Z. Zhang, N. Zhang and Z. Zhu, J. Mater. Chem. C, 2014, 2, 4196–4202 RSC.
- Y. Wang, S. Li, H. Shi and K. Yu, Nanoscale, 2012, 4, 7817–7824 RSC.
- H. Yin, K. Yu, C. Song, R. Huang and Z. Zhu, ACS Appl. Mater. Interfaces, 2014, 6, 14851–14860 CAS.
- H. Yin, K. Yu, C. Song, Z. Wang and Z. Zhu, Nanoscale, 2014, 6, 11820–11827 RSC.
- L. Lu-Lu, C. Jie-Jie, Z. Xing, Z. Ai-Yong, H. Yu-Xi, R. Qing and Y. Han-Qing, NPG Asia Mater., 2016, 8, 1–9 RSC.
- A. P. S. Gaur, S. Sahoo, M. Ahmadi, S. P. Dash, M. J. F. Guinel and R. S. Katiyar, Nano Lett., 2014, 14, 4314–4321 CrossRef CAS PubMed.
- A. O'Neill, U. Khan and J. N. Coleman, Chem. Mater., 2012, 24, 2414–2421 CrossRef.
- A. Jawaid, D. Nepal, K. Park, M. Jespersen, A. Qualley, P. Mirau, F. Drummy and R. Vaia, Chem. Mater., 2016, 28, 337–348 CrossRef CAS.
- X. Danyun, Z. Yuanzhi, L. Jiapeng, L. Yang, P. Wenchao, Z. Guoliang, Z. Fengbao and F. Xiaobin, Nanotechnology, 2016, 27, 1–7 Search PubMed.
- S. Beibei, L. Jinsong, L. Ziquan, W. Menghui, Z. Kongjun, Q. Jinhao and W. Jing, Mater. Lett., 2015, 144, 153–156 CrossRef.
- Z. Zhihua, L. Yuelai, Z. Pingan, A. Eric, S. Muhammad, L. Handong, W. Jiang and W. Zhiming, Mater. Lett., 2014, 131, 122–124 CrossRef.
- W. Weiyan, Z. Kun, Q. Zhiqiang, L. Lu, L. Pengli and Y. Yunquan, Ind. Eng. Chem. Res., 2014, 53, 10301–10309 CrossRef.
- G. Santillo, F. A. Deorsola, S. Bensaid, N. Russo and D. Fino, Chem. Eng. J., 2012, 207–208, 322–328 CrossRef CAS.
- X. Yue, X. Sichao, W. Shuan, Z. Yunxia and L. Guanghai, Dalton Trans., 2014, 43, 479–485 RSC.
- K. Zhang, j. Liang, S. Wang, J. Liu, K. Ren, X. Zheng, H. Luo, Y. Peng, X. Zou, X. Bo and X. Yu, Cryst. Growth Des., 2012, 12, 793–803 CAS.
- J. Sato, M. Kobayashi, H. Kato, T. Miyazaki and M. Kakihana, Journal of Asian Ceramic Societies, 2014, 2, 258–262 CrossRef.
- S. V. Prabhakar Vattikuti, C. Byon, C. Venkata Reddy and J. Shim, Appl. Phys. A, 2015, 119, 813–823 CrossRef.
- S. Harish, M. Navaneethan, J. Archana, A. Silambarasan, S. Ponnusamy, C. Muthamizhchelvan and Y. Hayakawa, Dalton Trans., 2015, 44, 10490–10498 RSC.
- S. V. Prabhakar Vattikuti, C. Byon, C. Venkata Reddy, B. Venkatesh and J. Shim, J. Mater. Sci., 2015, 50, 5024–5038 CrossRef CAS.
- L. Peitao, L. Yonggang, Y. Weichun, M. Ji and G. Daqiang, Nanotechnology, 2016, 27, 1–8 Search PubMed.
- W. Ho, J. C. Yu, J. Lin, J. G. Yu and P. S. Li, Langmuir, 2004, 20, 5865–5869 CrossRef CAS PubMed.
- X. Zong, H. J. Yan, G. P. Wu, G. J. Ma, F. Y. Wen, L. Wang and C. Li, J. Am. Chem. Soc., 2008, 130, 7176–7177 CrossRef CAS PubMed.
- F. A. Deorsola, N. Russo, G. A. Blengini and D. Fino, Chem. Eng. J., 2012, 1–6, 195–196 Search PubMed.
- T. C. Prathna, N. Chandrasekaran and A. Mukherjee, Colloids Surf., A, 2011, 390, 216–224 CrossRef CAS.
- Y. Huo, Y. Jin and Y. Zhang, J. Mol. Catal. A: Chem., 2010, 331, 15–20 CrossRef CAS.
- A. Parkinson, H. Sun and J. Sadler, Chem. Commun., 1998, 8, 881–882 RSC.
- W. Luo, L. Zhu, N. Wang, H. Tang, M. Cao and Y. She, Environ. Sci. Technol., 2010, 44, 1786–1791 CrossRef CAS PubMed.
- J. Liang, J. Liu, Q. Xie, S. Bai, W. Yu and Y. Qian, J. Phys. Chem. B, 2005, 109, 9463–9467 CrossRef CAS PubMed.
- A. Samotus, A. Kanas, M. Dudek, R. Grybos and E. Hodorowicz, Transition Met. Chem., 1991, 16, 495–499 CrossRef CAS.
- D. H. Killeffer and A. Linz, I. Publication, 1952, 95–109.
- J. Z. Kong, A. D. Li, X. Y. Li, H. F. Zhai, W. Q. Zhang, Y. P. Gong, H. Li and D. Wu, J. Solid State Chem., 2010, 183, 1359–1364 CrossRef CAS.
- M. M. Ali and K. Yesodha Sandhya, New J. Chem., 2016, 40, 8123–8130 RSC.
- S. Harish, J. Archana, M. Navaneethan, A. Silambarasan, K. D. Nisha, S. Ponnusamy, C. Muthamizhchelvan, H. Ikeda, D. K. Aswal and Y. Hayakawa, RSC Adv., 2016, 6, 89721–89731 RSC.
- R. Vinoth, P. Karthik, C. Muthamizhchelvan, B. Neppolian and M. Ashokkumar, Phys. Chem. Chem. Phys., 2016, 18, 5179–5191 RSC.
- A. Ajmal, I. Majeed, R. Naseem Malik, H. Idriss and M. Amtiaz Nadeem, RSC Adv., 2014, 4, 37003–37026 RSC.
- G. Zhou, X. Xu, J. Yu, B. Feng, Y. Zhang, J. Hu and Y. Zhou, CrystEngComm, 2014, 16, 9025–9032 RSC.
- Y. Liu, Y. X. Yu and W. D. Zhang, J. Phys. Chem. C, 2013, 117, 12949–12957 CAS.
- H. Liu, T. Lv, C. Zhu, X. Su and Z. Zhu, J. Mol. Catal. A: Chem., 2015, 396, 136–142 CrossRef CAS.
- N. Chinh Chien, V. Nhu Nang and D. Trong-On, J. Mater. Chem. A, 2015, 3, 18345–18359 Search PubMed.
- Y. Lijuan, X. Haiyan, Z. Dingke and C. Shijian, Mater. Res. Bull., 2014, 55, 221–228 CrossRef.
- D. Yong, Z. Yifeng, N. Wangyan and C. Pengpeng, Appl. Surf. Sci., 2015, 357, 1606–1612 CrossRef.
- Z. Weijia, Y. Zongyou, D. Yaping, H. Xiao, Z. Zhiyuan, F. Zhanxi, L. Hong, W. Jiyang and Z. Hua, Small, 2013, 9, 140–147 CrossRef PubMed.
- L. Qian, Z. Ning, Y. Yong, W. Guozhong and N. H. L. Dickon, Langmuir, 2014, 30, 8965–8972 CrossRef PubMed.
- W. Chuanxi, L. Huihui, L. Zhenyu, W. Jiapeng, X. Zhenzhu and Z. Chi, Part. Part. Syst. Charact., 2016, 33, 221–227 CrossRef.
Footnote |
| † Electronic supplementary information (ESI) available. See DOI: 10.1039/c6ra24355j |
|
| This journal is © The Royal Society of Chemistry 2016 |
Click here to see how this site uses Cookies. View our privacy policy here.