Novel incorporation of mesoporous NiCo2O4 into thermoplastic polyurethane for enhancing its fire safety

Junling Wanga, Bihe Yuanb, Xiaowei Mua, Wei Wanga, Weizhao Hu*a and Yuan Hu*a
aState Key Laboratory of Fire Science, University of Science and Technology of China, Hefei 230026, China. E-mail: yuanhu@ustc.edu.cn; hwz1988@ustc.edu.cn; Fax: +86-551-63601664; Tel: +86-551-63601664
bSchool of Resources and Environmental Engineering, Wuhan University of Technology, Wuhan 430070, China

Received 29th September 2016 , Accepted 1st November 2016

First published on 2nd November 2016


Abstract

In this work, two kinds of NiCo2O4 particles are synthesized and their structures are confirmed from X-ray diffraction patterns and Fourier transform infrared spectra. The excellent dispersion of the particles in thermoplastic polyurethane (TPU) is confirmed by transmission electron microscopy. Char residue yield of TPU is enhanced obviously after the incorporation of NiCo2O4, suggesting a catalyzing carbonization effect. Toxic gases released from decomposition of the polymer, such as HCN, are fatal to humans, so it is of great significance to evaluate the toxic gases from TPU composites by thermogravimetric analysis/infrared spectrometry. The release of HCN is inhibited effectively by NiCo2O4, and this can be attributed to the gas adsorbing and barrier effects of the mesoporous particles. In addition, the amount of flammable gases is also reduced markedly. Moreover, the peak heat release rate and total heat release of TPU are decreased appreciably by NiCo2O4 with a higher specific surface area.

1. Introduction

Thermoplastic polyurethane (TPU) is one of the most versatile thermoplastic polymers with elastomeric properties. Due to its desirable properties, such as excellent abrasive resistance, exceptional durability and high compressivity, TPU has been widely used in various fields.1 However, TPU is flammable with a high heat release rate and a large amount of toxic gases are released, such as CO, HCN and NOx,2–4 which are fatal to the human body. Therefore, it is of great importance to reduce the fire hazards of TPU.

Recently, nanomaterials with a two-dimensional layered structure, such as graphene, graphitic carbon nitride and molybdenum disulfide, have been employed to enhance the thermal stability and flame retardancy of combustible polymers, considering their excellent physical barrier effect on the transfer of mass and heat. For example, graphene or functionalized graphene oxide with high thermal stability and a large specific area is used as flame retardant additives. Han et al. have fabricated polystyrene (PS) nanocomposites with graphite oxide and graphene and they found an obvious decrease in the peak heat release rate (PHRR), which can be attributed to the barrier function of nanofillers on the mass and heat transport.5 Wang et al. have investigated the influence of flame retardants in combination with graphene on the mechanical properties and flammability of glass fiber-reinforced epoxy composites. The significant decrease in PHRR, total heat release and burning rate values of the epoxy sample is obtained by the incorporation of graphene.6 Yuan et al. have prepared functionalized graphene oxide/polypropylene (fGO/PP) nanocomposites and a significant improvement in the thermal stability of PP is observed, which can be attributed to several positive effects of the nanofillers, including barrier action.7 Besides, efficient suppression of toxic gases released from the burning polymer is also focused on by researchers. The synergistic effect between two-dimensional layered materials with the barrier effect and transition metal elements with catalytic action is exploited to further improve the fire safety of the polymer. Bao et al. have prepared composites of metal-loaded graphene and PS and investigated the risks of their combustion. They found that both PHRR and the released CO concentration during the combustion of PS decreased.8 Hong et al. have synthesized graphene supported Co3O4 and NiO nanomaterials and incorporated them into polyamide 6 (PA 6) to enhance its flame retardancy. The results showed that both PHRR and CO concentration are reduced obviously and gaseous products are significantly decreased by the addition of these metal-loaded graphene.9

Mesoporous nanomaterials with a high specific surface area have been applied in many areas, such as adsorption,10 catalysis,11 drug delivery,12 lithium-ion batteries13 and sensors.14 In addition, mesoporous materials are also employed as flame retardants for combustible polymers. Li et al. have reported that the polypropylene/intumescent flame retardant (PP/IFR) system can reach a UL-94 V-0 rating with loading of mesoporous silica (SBA-15) ranging from 0.5 to 3 wt%, while the sample without SBA-15 has no rating, and SBA-15 plays a catalytic role in the formation of char.15 Qian et al. have prepared composites of polylactic acid/aluminated mesoporous silica (PLA/Al-SBA-15). The results showed that the addition of 0.5 wt% of Al-SBA-15 increases the limiting oxygen index value of PLA to 30 vol% accompanied by the UL-94 V-0 rating. Moreover, the release of volatile gases and smoke is retarded due to the labyrinth effect and strong adsorption properties provided by Al-SBA-15.16 Wang et al. have found that the flame retardancy of intumescent flame retardant polypropylene composites (PP-IFR) is greatly enhanced after the addition of mesoporous silica, and only the systems containing both IFR and mesoporous silica can reach the UL-94 V-0 rating, suggesting the presence of a synergistic effect between them.17 Therefore, mesoporous materials can be regarded as efficient flame retardant additives to reduce the fire hazards of polymers. However, the application of nanomaterials with a lamellar structure, transition metal elements and mesoporous structure as flame retardant nanofillers is absent in the literature. Mesoporous nickel cobaltate (NiCo2O4) with a lamellar structure, a spinel-mixed metal oxide that is often used in applications for supercapacitors,18 electrocatalysts,19 and lithium-ion batteries,20 was selected as a flame retardant additive in this work. Here, the NiCo2O4 synthesized in this work is supposed to have the following effects on polymers: a barrier effect, which can be attributed to its lamellar structure; a catalytic effect arising from the presence of a transition metal element; a gas adsorbing effect caused by its mesoporous structure. As demonstrated above, these effects play a significant role in enhancing the fire safety of polymers. Therefore, mesoporous NiCo2O4 may be a novel and promising flame retardant nanofiller, which can suppress the release of toxic gases.

In this work, mesoporous NiCo2O4 with two different specific surface areas was synthesized to fabricate TPU/NiCo2O4 composites. The thermal stability, combustion behavior and flame retardant mechanism of TPU composites were investigated. Moreover, the release of HCN and flammable gases was inhibited markedly after the incorporation of NiCo2O4.

2. Experimental

2.1 Materials

Nickel nitrate hexahydrate (Ni(NO3)2·6H2O), cobalt nitrate hexahydrate (Co(NO3)2·6H2O), sodium dodecyl sulfate (SDS), tetrahydrofuran (THF) and ethanol were purchased from Sinopharm Chemical Reagent Co., Ltd. (China). Sodium hydroxide (NaOH) was obtained from Jiangsu Qiangsheng Chemical Reagent Co., Ltd. (China). All reagents were analytical grade and were used without further purification. TPU (polyester, 85E85) was provided by Baoding Bangtai Chemical Industry Co., Ltd. (China).

2.2 Preparation of mesoporous NiCo2O4 with two different specific surface areas

Mesoporous NiCo2O4 was synthesized through a two-step method in this work. The first step is the preparation of the NiCo2O4 precursor, and the second is an annealing treatment. For the preparation of the precursor, Ni(NO3)2·6H2O and Co(NO3)2·6H2O with a molar ratio of 1[thin space (1/6-em)]:[thin space (1/6-em)]2 were dissolved in deionized water. After addition of SDS, the mixture was maintained under vigorous stirring for 30 min. Then NaOH aqueous solution (0.3 M) was added into the mixture and stirred for 30 min. Subsequently, the mixture was transferred into a 500 mL Teflon-lined stainless steel autoclave, which was sealed and heated at 140 °C for 12 h. The precursor was separated by centrifugation, and was washed with water and ethanol until the pH of the supernatant liquor became neutral. Then the product was dried at 60 °C for 12 h. Finally, the precursor was annealed at 300 °C for 3 h to obtain mesoporous NiCo2O4 with a high specific surface area (H-NiCo2O4). For the preparation of NiCo2O4 with a low specific surface area (L-NiCo2O4), Ni(NO3)2·6H2O and Co(NO3)2·6H2O were dissolved in deionized water and stirred for 30 min without SDS. Then NaOH solution was quickly added to get a precipitate and the mixture was stirred for 30 min. The precursor was separated and treated using the same process as mentioned before to obtain the final product.

2.3 Fabrication of TPU/NiCo2O4 composites

TPU/NiCo2O4 composites were prepared using a master batch-based melt mixing method. The TPU master batch was fabricated using a solution blending approach. 4 g of NiCo2O4 was dispersed in 200 mL of THF with ultrasonication and stirring for 2 h. After heating to 35 °C, 6 g of TPU was added to the dispersion and the mixture was kept stirring for 4 h. Then the product was obtained by adding the mixture slowly to excess low temperature ethanol. The resulting master batch was dried at 80 °C for 24 h. TPU/H-NiCo2O4 composites with 1 wt%, 2 wt% and 3 wt% particles were prepared by melt mixing of TPU and the master batch in a twin roller mill at 180 °C for 10 min. The composites were denoted TPU/1% H-NiCo2O4, TPU/2% H-NiCo2O4 and TPU/3% H-NiCo2O4. A control composite (TPU/2% L-NiCo2O4) was prepared by the same process mentioned above. The mixed samples were hot-pressed at 185 °C and 10 MPa to obtain sheets with a suitable size.

2.4 Characterization

X-ray diffraction (XRD) patterns were collected using a Rigaku D = Max-Ra rotating anode X-ray diffractometer (Rigaku Co., Japan), using Cu Kα radiation (λ = 0.1542 nm) as the X-ray source. Fourier transform infrared (FTIR) spectra were recorded on a Nicolet 6700 FTIR spectrophotometer (Nicolet Instrument Co., U.S.). X-ray photoelectron spectroscopy (XPS) was employed to analyze the atomic composition of the product using a Thermo ESCALAB 250 electron spectrometer (Thermo VG Scientific Ltd., UK) with an Al Kα line ( = 1486.6 eV) as the excitation source. Transmission electron microscopy (TEM) was performed on a JEOL JEM-2100F microscope (JEOL Co., Ltd., Japan) with an acceleration voltage of 200 kV. Thermogravimetric analysis (TGA) was performed on a TA Q5000IR thermo-analyzer (TA Instruments Inc., U.S.) with a heating rate of 20 °C min−1. Raman spectra of the samples were recorded on a LABRAM-HR laser confocal Raman spectrometer (Jobin Yvon Co., Ltd., France) using a 514.5 nm argon laser line. Nitrogen adsorption and desorption tests were carried out on an ASAP2020 adsorption analyzer (Micromeritics instrument, Co., U.S.) at 77 K. The relative pressure range was 0–1.0. Thermogravimetric analysis/infrared spectrometry (TG-IR) was carried out on a TA Q5000IR thermo-analyzer coupled with a Nicolet 6700 FTIR spectrophotometer and the heating rate was 20 °C min−1. About 5.0 mg of the sample was placed in an alumina crucible and heated from 30 to 800 °C under a N2 atmosphere. Combustion tests were carried out on a cone calorimeter (FTT, Co., Ltd., UK). The specimen, with a size of 100 × 100 × 3 mm3 wrapped in aluminum foil, was exposed horizontally to a heat flux of 35 kW m−2.

3. Results and discussion

The crystal structure of particles is investigated by XRD tests and the corresponding patterns are shown in Fig. 1a. It is clear that the two kinds of NiCo2O4 exhibit similar diffraction peaks corresponding to the (111), (220), (311), (400), (422), (511), (440) and (533) planes. These diffraction peaks are indexed to a cubic and face centered spinel type NiCo2O4 structure (JCPDS-73-1702), indicating the successful preparation of NiCo2O4.
image file: c6ra24264b-f1.tif
Fig. 1 (a) XRD patterns and (b) FTIR spectra of particles. TEM images of (c) L-NiCo2O4 and (d) H-NiCo2O4.

The FTIR spectra of NiCo2O4 can be observed in Fig. 1b and similar spectra are displayed for the prepared NiCo2O4 particles. The bands at 3423 and 1625 cm−1 are attributed to water, adsorbed by the particles. The characteristic stretching band of NO3 is observed in the wavenumber range of 800–1500 cm−1. The strong bands at 653 and 565 cm−1 are ascribed to metal–oxygen bond vibrations, suggesting the formation of NiCo2O4.21,22

The morphology of the particles can be observed by TEM and the results are presented in Fig. 1c and d. It is clear that both L-NiCo2O4 and H-NiCo2O4 have a lamellar structure, which may show a barrier effect on the transfer of heat and mass during combustion of the polymer, just like graphene or molybdenum disulfide. Moreover, the pore channel structure can be seen inside H-NiCo2O4. The elimination of SDS, used in the preparation of H-NiCo2O4 during the annealing, leads to the pore channel structure and high porosity. Compared with L-NiCo2O4, H-NiCo2O4 may adsorb degraded products as well as trap the heat and mass more easily due to the pore channel structure.

Fig. 2 shows the nitrogen adsorption–desorption isotherms and the corresponding pore size distribution of NiCo2O4. The isotherm of L-NiCo2O4 exhibits a typical IV isotherm with a H1 hysteresis loop at high relative pressure.23 The isotherm of H-NiCo2O4 also shows similar curves. Moreover, the specific surface area of L-NiCo2O4 and H-NiCo2O4 is 47.3 and 82.9 m2 g−1, respectively, calculated using the BET method, while the pore diameter is 14.6 and 11.5 nm, respectively, calculated using the BJH method. Both L-NiCo2O4 and H-NiCo2O4 are mesoporous materials and the latter has a higher specific surface area than the former, indicating more sufficient contact between the nanoparticles and the polymer matrix. This nanoparticle can interact with the polymer more effectively upon increasing the contact area.24 Then, it is inferred that H-NiCo2O4 may have a stronger catalytic effect on TPU than L-NiCo2O4. Moreover, it is speculated that H-NiCo2O4 may have a more obvious adsorbing effect for HCN and flammable gases than L-NiCo2O4 due to its higher specific surface area and pore channel structure.


image file: c6ra24264b-f2.tif
Fig. 2 Nitrogen adsorption–desorption isotherm and the corresponding pore size distribution (inset) of (a) L-NiCo2O4 and (b) H-NiCo2O4.

The TGA and DTG curves of NiCo2O4 under nitrogen are shown in Fig. 3 and the corresponding thermal data are presented in Table 1. Both L-NiCo2O4 and H-NiCo2O4 show a high decomposition temperature and char residue during the thermal degradation. For instance, the initial decomposition temperatures (Tinitial) of the two particles are 635 and 371 °C, which is much higher than the processing temperature of the polymer. In addition, the char residues at 800 °C of the two particles are 90.8 and 78.3 wt%. Clearly, there are two decomposition steps for L-NiCo2O4: the evaporation of physically adsorbed water (50–200 °C) and the degradation of NiCo2O4 to form NiCo2O3 (600–800 °C).25 For H-NiCo2O4, three steps of decomposition can be seen: the elimination of physically adsorbed water (50–240 °C), the degradation of residual SDS (280–550 °C) and the decomposition of NiCo2O4 to generate NiCo2O3 (600–800 °C).25 Furthermore, H-NiCo2O4 decomposes sooner to form NiCo2O3 and has less char residue at 800 °C than L-NiCo2O4. This phenomenon can be explained as follows: firstly, organic compounds present inside H-NiCo2O4 easily decompose; secondly, H-NiCo2O4 has a higher specific surface area than L-NiCo2O4, leading to a larger contact area between the particle and heat. Thus, H-NiCo2O4 is heated more sufficiently than L-NiCo2O4.


image file: c6ra24264b-f3.tif
Fig. 3 (a) TGA and (b) DTG curves of NiCo2O4 under nitrogen.
Table 1 Summary of the thermal data of nanoparticles
Sample Tinitiala (°C) Tmax1b (°C) Tmax2b (°C) Tmax3b (°C) Solid residue at 800 °C (wt%)
a Temperature at 5 wt% weight loss.b Temperature at maximum weight loss rate.
L-NiCo2O4 635 99 730 90.8
H-NiCo2O4 371 101 375 722 78.3


The XPS spectra of L-NiCo2O4 and H-NiCo2O4 are shown in Fig. 4 and 5, respectively. The full-scan survey spectra of the samples, indicating the presence of C 1s, O 1s, Co 2p and Ni 2p, are shown in Fig. 4a and 5a. The Co 2p spectrum is exhibited in Fig. 4b and contains two spin–orbit doublets which are characteristic of Co2+, Co3+ and two shakeup satellites (indicated as “satellite”). The fitting peaks at binding energies of 795.9 and 780.7 eV are attributed to Co2+, while the other fitting peaks at 794.4 and 779.3 eV belong to Co3+.26,27 The Ni 2p spectra shown in Fig. 4c are composed of two spin–orbit doublets, characteristic of Ni2+, Ni3+ and two shakeup satellites (indicated as “satellite”). The fitting peaks at 853.9 and 871.8 eV are ascribed to Ni2+ while the other peaks at 855.7 and 873.7 eV are assigned to Ni3+.27,28 The O 1s spectrum exhibits three peaks at 529.5, 531.0 and 532.8 eV, as shown in Fig. 4d, which are associated with the typical metal–oxygen bond, oxygen ions in low coordination at the surface and hydroxyl species of the surface adsorbed water molecule, respectively.29 The H-NiCo2O4 exhibits similar XPS spectra to those of L-NiCo2O4 and the peak at 530.6 eV in the O 1s spectrum corresponds to the oxygen in hydroxyl groups.


image file: c6ra24264b-f4.tif
Fig. 4 (a) XPS survey spectrum and (b) Co 2p, (c) Ni 2p and (d) O 1s spectra of L-NiCo2O4.

image file: c6ra24264b-f5.tif
Fig. 5 (a) XPS survey spectrum and (b) Co 2p, (c) Ni 2p and (d) O 1s spectra of H-NiCo2O4.

The dispersion state of the nanoparticles is observed using TEM and the related images are shown in Fig. 6. Obviously, both H-NiCo2O4 and L-NiCo2O4 are well-dispersed in the TPU matrix and no evident agglomeration can be seen. The excellent dispersion state of NiCo2O4 can be attributed to the master batch-based melt mixing method for preparing the TPU composites. Moreover, it is possible that the labyrinth effect can be achieved through the uniform dispersion of particles, and the transfer of heat as well as mass can be further inhibited.


image file: c6ra24264b-f6.tif
Fig. 6 TEM images of (a) TPU/2% L-NiCo2O4 and (b) TPU/2% H-NiCo2O4.

The TGA and DTG curves of TPU and its composites under N2 and air are shown in Fig. 7 and 8, respectively, and the corresponding data are presented in Table 2. From the result obtained under N2, the Tinitial of pure TPU is 298 °C. Moreover, a two-stage decomposition process of TPU is observed with Tmax1 and Tmax2 values of 328 and 407 °C, respectively, and approximately 4.7 wt% char left at 700 °C. The first stage is responsible for the scission of principal TPU chains and the second one originates from further degradation of polyols and isocyanates.4 Similarly to TPU, TPU/NiCo2O4 composites undergo a two-stage decomposition process and have a lower Tinitial as well as Tmax. For example, Tinitial, Tmax1 and Tmax2 of TPU/3% H-NiCo2O4 is 284, 317 and 361 °C, respectively. However, char residues of the TPU/NiCo2O4 composites are increased in comparison to those of TPU. Compared with results collected under N2, TPU and its composites show a three-stage decomposition process in air. The first and second stage are assigned to the scission of principal TPU chains and degradation of polyols and isocyanates, respectively, and the third stage corresponds to the degradation of char residue. Moreover, char residues of the TPU composites are increased while their Tinitial and Tmax are decreased after the incorporation of NiCo2O4. Here, NiCo2O4 is supposed to promote catalytic decomposition as well as have a barrier effect on TPU, considering its chemical composition, and layered and mesoporous structure. The catalytic effect can be shown in the catalytic decomposition of TPU chains and volatiles. The catalytic decomposition effect on TPU chains results in a lower degradation temperature, while the catalytic charring effect on volatiles is beneficial to the formation of char residue, which can be a protective shield for the TPU matrix. However, the barrier action of mesoporous NiCo2O4 isn't reflected in the TGA test, which may be due to the strong catalytic effect of NiCo2O4. The char residue yield is improved significantly with the increase of H-NiCo2O4 and the sample with 2 wt% L-NiCo2O4 shows an unobvious increase in the char yield, suggesting that H-NiCo2O4 has a marked catalyzing charring effect while L-NiCo2O4 hardly shows the catalytic carbonization action. Char residue can be regarded as an efficient barrier for mass and heat. Therefore, the maximum thermal weight loss rate of samples with H-NiCo2O4 is lower than that of the sample containing L-NiCo2O4.


image file: c6ra24264b-f7.tif
Fig. 7 (a) TGA and (b) DTG curves of TPU and its composites under N2.

image file: c6ra24264b-f8.tif
Fig. 8 (a) TGA and (b) DTG curves of TPU and its composites under air.
Table 2 Summary of the thermal data of TPU and its composites
Sample Tinitial (°C) Tmax1 (°C) Tmax2 (°C) Tmax3 (°C) Char residue at 700 °C (wt%)
N2 Air N2 Air N2 Air N2 Air N2 Air
TPU 298 306 328 331 407 389 542 4.7 0.6
TPU/1% H-NiCo2O4 292 297 329 324 377 387 534 7.8 1.3
TPU/2% H-NiCo2O4 286 296 326 327 365 382 514 11.3 2.8
TPU/3% H-NiCo2O4 284 293 317 314 361 382 510 12.1 2.6
TPU/2% L-NiCo2O4 288 292 324 320 375 383 510 6.3 0.9


Cone calorimetry based on the oxygen consumption principle is employed to evaluate the combustion behavior of the materials. The heat release rate (HRR) and total heat release (THR) results are given in Fig. 9, and the corresponding combustion data are recorded in Table 3. It can be seen that a very sharp HRR peak appears in the curve of pure TPU with a peak heat release rate (PHRR) value of 1755 kW m−2 and its THR value is 81.8 MJ m−2. Obviously, the samples with H-NiCo2O4 show a dramatic decline in PHRR and THR. For instance, compared with pure TPU, the PHRR and THR of TPU/2% H-NiCo2O4 decreased by 38% and 15.5%, respectively. However, the incorporation of L-NiCo2O4 results in slight increases in PHRR and THR. The different influences on PHRR and THR can be attributed to the distinction in char residue formed and adsorption of combustible volatiles. The samples with H-NiCo2O4 can form higher and better char residue than the sample with L-NiCo2O4, which can be confirmed by the TGA and Raman results. In addition, H-NiCo2O4 with a higher specific surface area and pore channel structure has a stronger adsorption ability for volatiles, which are regarded as fuels for combustion. Moreover, the samples containing H-NiCo2O4 show earlier decomposition while the addition of L-NiCo2O4 delays the ignition of TPU. At early stages in the cone test, the ignition of TPU is accelerated by H-NiCo2O4 due to its stronger catalytic effect, which has been mentioned above. The barrier effect of particles is not shown here, suggesting that the main effect of H-NiCo2O4 is catalytic action at an early stage. However, the ignition of TPU is delayed after the addition of L-NiCo2O4. This can be explained by two reasons: firstly, L-NiCo2O4 shows lower catalytic action than H-NiCo2O4 at an early stage of thermal decomposition, which can be estimated by the values of the first peak in the DTG test; secondly, the diffusion of volatiles is inhibited by the lamellar structure of particles. It may be inferred that the main effect of L-NiCo2O4 is the barrier effect at an early stage. Moreover, it is clear that TPU containing L-NiCo2O4 shows the highest peak value of thermal weight loss rate from the DTG results, suggesting its strong catalytic decomposition effect. What's more, the char residue of the TPU composite with L-NiCo2O4 isn't improved obviously in comparison to that of pure TPU. Then, it is inferred that the main function of L-NiCo2O4 is the catalytic decomposition effect and more additional fuels are released in the whole combustion process, resulting in higher PHRR and THR.


image file: c6ra24264b-f9.tif
Fig. 9 (a) HRR and (b) THR curves of TPU and its composites.
Table 3 Results of the cone calorimetery measurements
Sample PHRR (kW m−2) THR (MJ m−2)
TPU 1755 81.8
TPU/1% H-NiCo2O4 1388 75.3
TPU/2% H-NiCo2O4 1087 69.1
TPU/3% H-NiCo2O4 1097 65.3
TPU/2% L-NiCo2O4 1781 84.7


Digital photos of the char residues are shown in Fig. 10. Compared with pure TPU, the aluminum foil containers of TPU/H-NiCo2O4 are covered by char residues completely from the vertical view. Moreover, it can be seen that the thickness of the char residues is elevated after the incorporation of H-NiCo2O4, from the front view. However, TPU/L-NiCo2O4 has more holes and cavities in the char surface and the thickness of char becomes smaller than in pure TPU, suggesting its adverse influence on char formation. Therefore, the formation of char residues can be facilitated by H-NiCo2O4.


image file: c6ra24264b-f10.tif
Fig. 10 Digital photos of char residues: the vertical view (top) and front view (bottom) of (a and b) TPU, (c and d) TPU/1% H-NiCo2O4, (e and f) TPU/2% H-NiCo2O4, (g and h) TPU/3% H-NiCo2O4 and (i and k) TPU/2% L-NiCo2O4.

TG-IR is selected to analyze the gaseous products of TPU and its composites during decomposition under nitrogen and the results are presented in Fig. 11. Obviously, the TPU composites show similar spectra to pure TPU and the main bands can be attributed to the functional groups with characteristic band positions, such as –CH3 and –CH2– (2966 cm−1), CO2 (2358 cm−1), –NCO (2310 cm−1), –C[double bond, length as m-dash]O (1762 cm−1), esters (1148 cm−1) and C–O–C groups (1051 cm−1).30,31 Moreover, the bands at 1172 cm−1, 750 cm−1 and 722 cm−1 can be ascribed to hydrocarbons,32 aromatic compounds31 and HCN,30,33 which can't be seen in Fig. 11. Investigation of the change of adsorption intensity of these decomposed products is necessary to explore the flame retardant mechanism.


image file: c6ra24264b-f11.tif
Fig. 11 FTIR spectra of pyrolysis products at maximum decomposition rate.

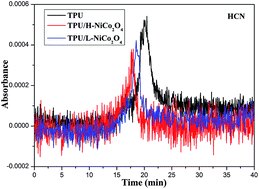
In order to explore the flame retardant mechanism, the absorbance of gaseous products for TPU and its composites is depicted in Fig. 12. The adsorption intensity and total adsorption intensity of hydrocarbons, aromatic compounds and HCN are shown in Fig. 12a–f. The TPU composites show earlier adsorption peaks than pure TPU, which can be attributed to the catalyzing degradation effect of NiCo2O4. Moreover, it is noted that the amount of organic volatiles can be reduced by NiCo2O4 and TPU, with H-NiCo2O4 showing the lowest adsorption intensity and total release of these volatiles, which may be due to its larger specific surface area. The adsorption intensity of hydrocarbons and aromatic compounds is decreased obviously, suggesting that more hydrocarbons and aromatic compounds are maintained in the condensed phase to form char residues rather than fuels for combustion. Moreover, char residues are enhanced after the incorporation of NiCo2O4 in the TGA test. It is possible that hydrocarbons and aromatic compounds are adsorbed in the nanoparticles and then catalyzed to form char residue because of the high specific surface area and catalyzing carbonization effect of NiCo2O4.


image file: c6ra24264b-f12.tif
Fig. 12 Comparison of the infrared adsorption intensity of (a) hydrocarbons, (c) aromatic compounds and (e) HCN and total infrared adsorption intensity of (b) hydrocarbons, (d) aromatic compounds and (f) HCN for TPU and its composites versus time.

HCN is regarded as one principal toxicant during the decomposition of PU. It is reported that HCN is absorbed quickly into the blood, resulting in a low oxygen concentration that causes a rapid toxic effect, probably preventing the normal process of tissue oxidation and paralyzing the respiratory center of the brain, thus resulting in death. Thus, it is necessary to reduce the amount of HCN during the decomposition. From Fig. 12e and f, it is clear that the adsorption intensity and total release of HCN are decreased after the incorporation of NiCo2O4, which can be ascribed to the adsorbing gases and barrier effect of mesoporous particles. What's more, the TPU/H-NiCo2O4 composite has a lower adsorption intensity than the sample with L-NiCo2O4. The higher specific surface area and pore channel structure of H-NiCo2O4 is beneficial for the sufficient adsorption of gaseous products. Therefore, the incorporation of NiCo2O4 can decrease the toxicity of degraded products for TPU.

Fig. 13 shows the IR spectra of pyrolysis products for the samples at different decomposition stages and it is evident that the TPU composites have similar spectra to pure TPU. For TPU, the strongest absorbance intensity peaks of pyrolysis products, such as hydrocarbons, carbonyl compounds, CO2, and esters, can be observed at 400 °C. However, these peaks can be seen at 350 °C after the incorporation of NiCo2O4, as seen in Fig. 13b and c. Therefore, this is consistent with the result that the addition of fillers facilitates the decomposition of TPU. What's more, the peak of hydrocarbons (2978 cm−1) can still be seen at elevated temperatures as in Fig. 13a and c, while that peak disappears after 450 °C in Fig. 13b, suggesting that the release of hydrocarbons is obviously hindered after the incorporation of H-NiCo2O4. The peak of esters (1145 cm−1), often considered as fuels for combustion, becomes indistinct after 450 °C as seen in Fig. 13b and c, suggesting the suppression effect of NiCo2O4 on the release of degraded products.


image file: c6ra24264b-f13.tif
Fig. 13 IR spectra of pyrolysis products for the samples at different decomposition stages: (a) pure TPU, (b) TPU/2% H-NiCo2O4 and (c) TPU/2% L-NiCo2O4.

Fig. 14 shows the Raman spectra and XRD patterns of char residues. The Raman spectra, presented in Fig. 14a–e, exhibit two strong peaks at approximately 1355 and 1583 cm−1, which are attributed to the vibration of carbon atoms with dangling bonds in the plane terminations of disordered graphite or glassy carbons (D band) and vibration of sp2-hybridized carbon atoms in a graphite layer (G band), respectively.32,34 The graphitization degree of char residue can be evaluated by the ratio of the intensity of D and G bands (ID/IG). A lower ratio of ID/IG indicates that more graphitic char residue is formed. The ID/IG values of TPU composites with H-NiCo2O4 are lower than those of pure TPU, indicating that the incorporation of H-NiCo2O4 can improve the graphitization degree of the char residue. However, the sample containing 2% L-NiCo2O4 has the highest value of ID/IG, corresponding to the lowest graphitization degree. It is apparent that H-NiCo2O4 fillers can enhance the graphitization degree of char residue to protect the underlying polymer from burning, while the graphitization degree is decreased after the incorporation of L-NiCo2O4.


image file: c6ra24264b-f14.tif
Fig. 14 (a–e) Raman spectra and (f) XRD patterns of the char residues.

The composition of char residues can be investigated by XRD tests and the relevant patterns are displayed in Fig. 14f. Similar XRD patterns can be observed for the char residues of TPU composites. Firstly, the peak at 24.4° is assigned to the (002) diffraction of graphitic materials.32,35 Then, the peaks that appeared at 36.8° and 42.8° were attributed to the (111) and (200) diffractions of CoNiO2, respectively.36,37 Moreover, the peaks at 44.4° and 51.8° are ascribed to the (111) and (200) diffractions of Ni, respectively.38 Therefore, it is speculated that redox reactions between NiCo2O4 and degraded products happened during the combustion. That is, trivalent metal ions can be reduced to metal in a lower valence state or pure metal. Additionally, the char residue of TPU/2% H-NiCo2O4 has a stronger diffraction peak intensity of graphitic materials than that of TPU/2% L-NiCo2O4, indicating that the former has more graphitic carbon than the latter. The conclusion is consistent with the Raman results.

XPS tests are employed to study the chemical composition of char residues and the corresponding results are shown in Fig. 15. The full-scan survey spectrum of the char with L-NiCo2O4 shows the presence of C 1s, O 1s, Co 2p and Ni 2p. The Co 2p spectrum exhibits two peaks located at 780.4 and 796.1 eV corresponding to Co2+ while the Ni 2p spectrum consists of two peaks located at 855.2 and 873.1 eV assigned to Ni2+.36,37 The full-scan survey spectrum of the char containing H-NiCo2O4 is similar to that of L-NiCo2O4. The Co 2p spectrum shows two peaks at 780.7 and 796.7 eV attributed to Co2+ while the Ni 2p spectrum contains two peaks at 855.3 and 872.3 eV assigned to Ni2+.39–41 The conclusion that the char residue contains CoNiO2 can be reached, indicating that Co3+ and Ni3+ are reduced to Co2+ and Ni2+, respectively. What's more, some metallic Ni3+ was reduced to Ni as demonstrated in the XRD results. It is easily understood that CoNiO2 and Ni are formed via the in situ reduction of Co3+ and Ni3+ by the degraded products of TPU, such as hydrocarbons and aromatic compounds.


image file: c6ra24264b-f15.tif
Fig. 15 XPS spectra of char residues: (a) XPS survey spectrum and (b) Co 2p and (c) Ni 2p spectra of the sample with 2% L-NiCo2O4; (d) XPS survey spectrum and (e) Co 2p and (f) Ni 2p spectra of the sample with 2% H-NiCo2O4.

4. Conclusions

As we know, HCN is one principal toxicant during the decomposition of PU, and the inhibition of its release is important to the survival of people in fires. From TGIR results, the amount of released HCN is decreased appreciably after the addition of NiCo2O4, which can be attributed to the adsorbing of gases and barrier effect of mesoporous materials. Besides, the TPU composite containing H-NiCo2O4 shows lower adsorption intensity than the sample with L-NiCo2O4, which can be attributed to its higher specific surface area and pore channel structure. Moreover, the incorporation of H-NiCo2O4 can decrease the PHRR and THR value of TPU, while the addition of L-NiCo2O4 increases heat release slightly. In this work, both H-NiCo2O4 and L-NiCo2O4 have a catalytic effect on TPU and the former shows a stronger catalytic effect than the latter. The catalytic effect can be exhibited in two ways: catalytic decomposition of TPU chains, resulting in lower thermal degradation temperature and a higher thermal degradation rate peak; catalytic charring of volatiles, leading to a higher char residue yield and less release of additional fuel. However, L-NiCo2O4 hardly shows a catalytic carbonization effect according to the unobvious increase in char residue, while H-NiCo2O4 has a marked catalyzing charring effect. Moreover, NiCo2O4 with a lamellar structure is supposed to have a barrier effect on the transfer of mass and heat, just like graphene. Besides, degraded products can be adsorbed by mesoporous particles and then catalyzed to form char, which can protect the underlying polymer from burning. The main effect of L-NiCo2O4 on TPU may be the catalyzing degradation effect in the whole combustion process, resulting in the slight increase in PHRR and THR. Based on the analysis above, H-NiCo2O4 can be regarded as an efficient flame retardant nanofiller for TPU.

Acknowledgements

The work was financially supported by the National Key Research and Development Program of China (2016YFB0302104), National Natural Science Foundation of China (51603200, 21411140231) and Fundamental Research Funds for the Central Universities (WK2320000032).

References

  1. T.-H. Ho and C.-S. Wang, Polymer, 1996, 37, 2733–2742 CrossRef CAS.
  2. D. K. Chattopadhyay and D. C. Webster, Prog. Polym. Sci., 2009, 34, 1068–1133 CrossRef CAS.
  3. X. Chen, L. Huo, C. Jiao and S. Li, J. Anal. Appl. Pyrolysis, 2013, 100, 186–191 CrossRef CAS.
  4. Y. Shi, B. Yu, K. Zhou, R. K. K. Yuen, Z. Gui, Y. Hu and S. Jiang, J. Hazard. Mater., 2015, 293, 87–96 CrossRef CAS PubMed.
  5. Y. Han, Y. Wu, M. Shen, X. Huang, J. Zhu and X. Zhang, J. Mater. Sci., 2013, 48, 4214–4222 CrossRef CAS.
  6. X. Wang, L. Song, W. Pornwannchai, Y. Hu and B. Kandola, Composites, Part A, 2013, 53, 88–96 CrossRef CAS.
  7. B. Yuan, C. Bao, L. Song, N. Hong, K. M. Liew and Y. Hu, Chem. Eng. J., 2014, 237, 411–420 CrossRef CAS.
  8. C. Bao, L. Song, C. A. Wilkie, B. Yuan, Y. Guo, Y. Hu and X. Gong, J. Mater. Chem., 2012, 22, 16399–16406 RSC.
  9. N. Hong, L. Song, T. R. Hull, A. A. Stec, B. Wang, Y. Pan and Y. Hu, Mater. Chem. Phys., 2013, 142, 531–538 CrossRef CAS.
  10. A. M. Liu, K. Hidajat, S. Kawi and D. Y. Zhao, Chem. Commun., 2000, 1145–1146 RSC.
  11. W. Van Rhijn, D. De Vos, B. Sels and W. Bossaert, Chem. Commun., 1998, 317–318 RSC.
  12. I. I. Slowing, B. G. Trewyn, S. Giri and V. S. Y. Lin, Adv. Funct. Mater., 2007, 17, 1225–1236 CrossRef CAS.
  13. X. Wang, L. Huang, Y. Zhao, Y. Zhang and G. Zhou, Nanoscale Res. Lett., 2016, 11, 37 CrossRef PubMed.
  14. V. K. Tomer, S. Devi, R. Malik, S. P. Nehra and S. Duhan, Sens. Actuators, B, 2016, 229, 321–330 CrossRef CAS.
  15. J. Li, P. Wei, L. Li, Y. Qian, C. Wang and N. H. Huang, Fire Mater., 2011, 35, 83–91 CrossRef CAS.
  16. Q. Yong, W. Ping, J. Pingkai, L. Zhi, Y. Yonggang and J. Kejian, Compos. Sci. Technol., 2013, 82, 1–7 CrossRef.
  17. N. Wang, J. Zhang, Q. Fang and D. Hui, Composites, Part B, 2013, 44, 467–471 CrossRef CAS.
  18. G. Chen, Y. Gao and H. Zhang, RSC Adv., 2016, 6, 30488–30497 RSC.
  19. R. Ding, L. Qi, M. Jia and H. Wang, Nanoscale, 2015, 7, 9946 RSC.
  20. S. Liu, J. Wu, J. Zhou, G. Fang and S. Liang, Electrochim. Acta, 2015, 176, 1–9 CrossRef CAS.
  21. H. Y. Guan, C. L. Shao, Y. C. Liu, N. Yu and X. H. Yang, Solid State Commun., 2004, 131, 107–109 CrossRef CAS.
  22. G. A. Babu, G. Ravi and Y. Hayakawa, Appl. Phys. A: Mater. Sci.Process., 2015, 119, 219–232 CrossRef.
  23. Z. Ju, G. Ma, Y. Zhao, Z. Xing, Y. Qiang and Y. Qian, Part. Part. Syst. Charact., 2015, 32, 1012–1019 CrossRef CAS.
  24. C.-C. Chu, K. L. White, P. Liu, X. Zhang and H.-J. Sue, Carbon, 2012, 50, 4711–4721 CrossRef CAS.
  25. O. Knop, K. Reid, Sutarno and Y. Nakagawa, Can. J. Chem., 1968, 46, 3463–3476 CrossRef CAS.
  26. Z. Ju, G. Ma, Y. Zhao, Z. Xing, Y. Qiang and Y. Qian, Part. Part. Syst. Charact., 2015, 32, 1012–1019 CrossRef CAS.
  27. N. Van Hoa, C. Lamiel and J.-J. Shim, Mater. Lett., 2016, 170, 105–109 CrossRef.
  28. J. Li, S. Xiong, Y. Liu, Z. Ju and Y. Qian, ACS Appl. Mater. Interfaces, 2013, 5, 981–988 CAS.
  29. S. Khalid, C. Cao, A. Ahmad, L. Wang, M. Tanveer, I. Aslam, M. Tahir, F. Idrees and Y. Zhu, RSC Adv., 2015, 5, 33146–33154 RSC.
  30. B. Wang, H. Sheng, Y. Shi, L. Song, Y. Zhang, Y. Hu and W. Hu, J. Hazard. Mater., 2016, 314, 260–269 CrossRef CAS PubMed.
  31. W. Wang, H. Pan, Y. Shi, Y. Pan, W. Yang, K. Liew, L. Song and Y. Hu, Composites, Part A, 2016, 80, 259–269 CrossRef CAS.
  32. F. Xiaming, X. Weiyi, S. Lei and H. Yuan, J. Mater. Chem. A, 2014, 2, 13299–13308 Search PubMed.
  33. S. Duquesne, M. Le Bras, S. Bourbigot, R. Delobel, F. Poutch, G. Camino, B. Eling, C. Lindsay and T. Roels, J. Fire Sci., 2000, 18, 456–482 CrossRef CAS.
  34. Z. Cao, Y. Zhang, L. Zhao, M. Peng, Z. Fang and M. Klatt, J. Anal. Appl. Pyrolysis, 2013, 102, 154–160 CrossRef CAS.
  35. X. Wen, J. Gong, H. Yu, Z. Liu, D. Wan, J. Liu, Z. Jiang and T. Tang, J. Mater. Chem., 2012, 22, 19974–19980 RSC.
  36. Y. Liu, Y. Zhao, Y. Yu, J. Li, M. Ahmad and H. Sun, New J. Chem., 2014, 38, 3084–3091 RSC.
  37. Y. Liu, Y. Zhao, Y. Yu, M. Ahmad and H. Sun, Electrochim. Acta, 2014, 132, 404–409 CrossRef CAS.
  38. D. Ping, C. Wang, X. Dong and Y. Dong, Appl. Surf. Sci., 2016, 369, 299–307 CrossRef CAS.
  39. Z. Zhang, Q. Li, Z. Li, J. Ma, C. Li, L. Yin and X. Gao, Electrochim. Acta, 2016, 203, 117–127 CrossRef CAS.
  40. A. B. Nawale, N. S. Kanhe, K. Patil, S. Bhoraskar, V. Mathe and A. Das, J. Alloys Compd., 2011, 509, 4404–4413 CrossRef CAS.
  41. A. Demchenko, Y. Chang, E. Chikoidze, B. Berini, C. Lefèvre, F. Roulland, C. Ulhaq-Bouillet, G. Versini, S. Barre and C. Leuvrey, RSC Adv., 2016, 6, 28248–28256 RSC.

This journal is © The Royal Society of Chemistry 2016