Gel electrophoretic analysis of differently shaped interacting and non-interacting bioconjugated nanoparticles

Suhee Kima, Alastair W. Warkb and Hye Jin Lee*a
aDepartment of Chemistry and Green-Nano Materials Research Center, Kyungpook National University, 80 Daehakro, Buk-gu, Daegu-city, 41566, Republic of Korea. E-mail: hyejinlee@knu.ac.kr; Fax: +82 053 950 6330; Tel: +82 053 950 5336
bCentre for Molecular Nanometrology, WestCHEM, Department of Pure and Applied Chemistry, Technology and Innovation Centre, University of Strathclyde, 99 George Street, Glasgow, G1 1RD, UK

Received 26th September 2016 , Accepted 6th November 2016

First published on 7th November 2016


Abstract

The use of a simple gel electrophoretic method to study mixtures of differently shaped biofunctionalized nanoparticles (NP's) that undergo bioaffinity interactions is demonstrated. Both gold nanorods (NR's) and quasi-spherical nanoparticles (qNS's) were functionalized with an interacting antigen and antibody pairing (alpha-1 antitrypsin (AAT) protein and antiAAT) or non-interacting antibody controls (antiBNP). Gel-based measurements were accompanied with transmission electron microscopy (TEM) and UV-vis spectroscopy analysis before and after separation. Initial measurements of NR and qNS bioconjugates suspended individually were applied to optimize the gel separation conditions and it was demonstrated that higher particle uniformities could be obtained relative to the initial stock solutions. A series of NR and qNS mixtures prepared at various stoichiometric ratios were then compared for both interacting (antiAAT–AAT) and non-interacting (antiAAT–antiBNP) particle conjugates. Both gel images and extinction measurements were utilized to demonstrate reduced NP concentrations transported along the gel due to bioaffinity-induced NP assembly. This confirmed that gel electrophoresis can be extended to identifying particle aggregation associated with protein bioaffinity interactions as well as being an established tool for separating particles based on size, shape and surface chemistry.

Introduction

Due to their excellent optical and electrochemical properties, biofunctionalized gold nanoparticles (NP's), including gold nanorods (NR's), quasi-spherical gold NPs (qNS's) and other shapes have attracted tremendous interest for use in a wide range of sensing,1,2 catalytic3 and medical applications,4–6 The advantages of different shapes lie primarily in their optical and catalytic properties, which vary significantly with size and shape. However, achieving both high yields and particle uniformity at the targeted geometry and desired surface functionalization continues to be a significant challenge. Many syntheses of nanoparticles produce polydisperse mixtures.

Producing nanoparticle shapes with controlled morphologies is readily achieved via a multi-step seed mediated growth7–10 with perhaps the most widely practiced example being that for gold nanorod synthesis7 along with established routes for other shapes such as nanocubes and polyhedral NP's.8,10 All of these routes will yield different percentages of the targeted shape. Thus, the development of methods to separate colloidal mixtures of nanoparticles based on properties such as shape, size and also surface functionalization has been an important research area for several years.2,11–13 This has led to development of several techniques including density gradient centrifugation,14,15 diafiltration,11 field-flow fractionation,16 and size-exclusion chromatography17 as well as a number of electrophoretic methods.18–21 Capillary electrophoresis (CE) has been successfully applied to the separation of a wide range of nanoparticles based on different migration times under an applied electric field through a narrow glass capillary in the presence of background electrolytes. High-resolution CE separation can be achieved for different NP sizes,22 materials and biomolecular surface modification23 though its application for both higher-throughput analysis and more complex sample matrices remains limited.

In particular, gel electrophoresis (GE) is a widely used and inexpensive separation technique that can be adapted for the characterization of nanoparticle-biomolecular conjugates. GE has been used to confirm bioconjugation of both DNA24,25 and protein molecules to metallic nanoparticles.26–28 Studies involving larger particles (>10 nm) have been restricted to agarose gel rather than polyacrylamide due to the larger pore sizes that can be achieved by lowering the % agarose during the gel preparation.29 Hanauer et al. reported the separation of mixtures of modified poly(ethylene glycol) (PEG) coated metal nanoparticles depending on their size, shape and the charged terminal functional group on the PEG.18 Distinguishable separation between different nanorod and spherical particles was obtained only in a narrow range of experimental conditions depending on the NP surface charge and a low 0.2% agarose gel concentration. Xu et al. utilized a column packed with 4% agarose gel to separate smaller alkanethiol functionalized particles from 5 to 20 nm in size and a 2% gel to separate larger sized rods, spheres and plate structures with the presence of the surfactant sodium dodecyl sulfate (SDS) improving the separation performance.19 Recently, a 2D GE platform (0.8% agarose) has been demonstrated for even higher throughput analysis of PEG-modified gold nanorod samples.30 Most gel-based studies have focused on individual nanoparticles. However, there have been a few studies involving the aggregation of relatively small nanoparticles to confirm the controlled assembly of DNA-functionalised nanoparticles into different aggregate sizes,24,31–33 and no studies that we are aware of for systems involving protein bioaffinity interactions.

In this paper, we demonstrate for the first time that a simple gel electrophoresis method can be used not only for separating inhomogeneous batches of antibody coated gold NPs of different shapes but also for distinguishing between specific interacting antibody and antigen functionalized NRs and qNSs from non-interacting nanoparticle mixtures. The characteristics of the separated NPs using gel electrophoresis were investigated using transmission electron microscopy (TEM) and UV-vis spectrophotometry and the presence of biomolecules conjugated to NP surfaces after electrophoretic separation was additionally verified using an instant blue staining method.

Methodology

Materials

Hydrogen tetrachloroaurate(III) hydrate (HAuCl4, Sigma-Aldrich), silver nitrate (AgNO3, Sigma-Aldrich), hexadecyltrimethylammonium bromide (CTAB, Tokyo Chemical Industry), sodium borohydride, (NaBH4, Sigma-Aldrich), L-ascorbic acid (Sigma-Aldrich), sodium hydroxide (Junsei), trisodium citrate (Sigma-Aldrich), sodium dodecyl sulfate (SDS, Sigma-Aldrich), dioctyl sulfosuccinate sodium salt (DSS, Sigma-Aldrich), sodium hexadecyl sulfate (SHS, Sigma-Aldrich), 1-ethyl-3-(3-dimethylaminopropyl)-carbodiimide hydrochloride (EDC, Thermo), N-hydroxysulfosuccinimide (NHSS, Sulfo-NHS, Thermo), 11-mercaptoundecanoic acid (MUA, Sigma-Aldrich), alpha-1 antitrypsin antibody (antiAAT, R&D systems), alpha-1 antitrypsin (AAT, R&D systems), brain natriuretic peptide (human) antibody (antiBNP, Phoenix Pharmaceuticals Inc.), phosphate buffered saline (PBS, pH 7.4, Life Technologies) solution, agarose (M. biotech), 10× Tris–borate–EDTA (TBE, M. biotech), instant blue (M. biotech) were all used as received.

Synthesis of gold nanorods (NR's) and of quasi-spherical gold nanospheres (qNS's)

Nanorods. Colloidal solutions of NRs were synthesized following the seed-growth method reported by Nikoobakht et al.7 Briefly, NR solutions were prepared by adding 0.5 mM HAuCl4 (5 mL) to 200 mM CTAB solution (5 mL) followed by adding 10 mM NaBH4 (0.6 mL) with vigorous stirring the solution for 2 min and stored at 29 °C for 1 h. The growth solution was prepared by the sequential addition of 4 mM AgNO3 (0.2 mL), 10 mM HAuCl4 (0.5 mL) and 78.8 mM L-ascorbic acid (0.07 mL) in 5 mL of 200 mM CTAB solution. The seed solution was then added to the growth solution and stored at 29 °C for 3 h. The excess reagents were washed by centrifuging (6000g, 20 min) and resuspending the NRs in DI water two times.
Quasi-spherical nanoparticles. Colloidal solutions of qNS's were synthesized using the seed-growth approach described by Murphy et al.8 Briefly, a seed solution was first prepared by the sequential addition of 10 mM sodium citrate (1 mL), 10 mM HAuCl4 (1 mL) and 100 mM NaBH4 (1 mL) into a 36 mL of DI water. The mixed solution was stirred vigorously for 1 min and left for a further 2 h. Three growth solutions were then prepared; the first growth solution was prepared by sequentially adding 100 mM NaOH (0.005 mL), 10 mM HAuCl4 (0.025 mL), 100 mM L-ascorbic acid (0.05 mL) and the seed solution (0.1 mL) into 200 mM CTAB solution (0.9 mL) for 2 min. The second growth solution was prepared by the sequential addition of 100 mM NaOH (0.005 mL), 10 mM HAuCl4 (0.025 mL), 100 mM L-ascorbic acid (0.05 mL) and the first growth solution (0.4 mL) into 200 mM CTAB solution (0.9 mL) and left for 3 min. The third growth solution was prepared by adding 100 mM NaOH (0.05 mL), 10 mM HAuCl4 (0.25 mL), 100 mM L-ascorbic acid (0.05 mL) and all of the second growth solution into the CTAB solution (9 mL). This solution was kept for 2 h at 29 °C and then centrifuged at 6000g for 20 min to remove excess reagents and was finally suspended in DI water. The qNSs were washed at least two times using DI water and stored at 29 °C prior to biofunctionalization. The colloidal solutions were characterized using UV-vis spectroscopy (Shimadzu UV-1800) and transmission electron microscopy (TEM) analysis (Hitachi H-7600). Nanoparticle concentrations were calculated for the qNS's using an extinction coefficient of 7.6 × 10⁹ M−1 at the LSPR λmax calculated by correlating with Nanosight LM20 particle counting analysis as described previously.34 For the NR's a value of 4.9 × 10⁹ M−1 was used, comparable with literature values.35 Before performing gel electrophoresis, the NP colloidal solutions were centrifuged at 6000g for 7 min and concentrated (in Fig. 2 the qNS's and NR's were 2.6 and 4 nM respectively, while both were 2 nM in Fig. 3 and 4).

Biofunctionalization of NR's and qNS's

Both NR and qNS colloids were biofunctionalized using EDC/NHSS linking chemistry as reported previously by us.34,36–38 In short, a 10 μL aliquot of 10 mM ethanolic MUA solution was added into 990 μL of each batch of the NRs or qNSs solution. The mixture was then sonicated for 30 min at 50 °C and for a further 2 h at 25 °C, which results in the formation of a carboxylic acid terminated alkanethiol layer on the colloidal surfaces. Next, a 10 μL aliquot of the mixture of 7.5 mM EDC and 1.5 mM sulfo-NHS in DI water was added to each colloidal solution and reacted for 30 min at 25 °C. A 1 μL aliquot of 100 μM biomolecular stock solution (e.g. antiAAT, antiBNP, AAT) in PBS (pH 7.4) buffer was then added to either the NRs or qNSs and left for 3 h at 29 °C resulting in the covalent linking of the biomolecule to the NP surface. The excess proteins concentrations present during this conjugation step (∼200 protein[thin space (1/6-em)]:[thin space (1/6-em)]1 NP ratio) was chosen to promote maximum surface coverage of the nanoparticles as this ratio is significantly greater than the theoretical maximum coverage (e.g. a ∼17 nm diameter area occupied by a single antibody equates to a maximum monolayer of ∼34 antibodies coating a 50 nm qNS particle39). The colloidal solution was then finally washed by centrifuging (6000g, 7 min) and resuspending into PBS buffer (pH 7.4) to remove excess unreacted biomolecules. The attachment of antibodies onto both NRs (red shift in λmax from 753 to 758 nm) and qNSs (red shift in λmax from 528 to 532 nm) was also confirmed using UV-vis spectroscopy. Prior to gel electrophoresis, the biofunctionalized NR and qNs solutions were centrifuged (6000g, 7 min) and resuspended into 1× TBE buffer and 0.1% SDS solution and kept for 3 h at 29 °C, which promotes the NR and qNS surfaces being negatively charged for separation. For bioaffinity interactions, experiments were performed where the NRs and qNSs were immediately mixed upon resuspension in buffer and SDS or first resuspended in buffer and SDS subsequently added.

Gel electrophoresis

A 1.5% agarose gel plate (6 × 10 cm2) with a thickness of 1 cm was placed in a horizontal electrophoresis system with the electrode spacing of 30 cm (M. biotech, MP300 V). Each NP solution was resuspended in 1× TBE buffer 0.1% SDS surfactant at particle concentrations ranging from ∼2 to 4 mM (stated in figure captions). A 40 μL aliquot is loaded into each gel lane reservoir followed by covering the whole gel with 1× TBE buffer. A voltage of 100 V was applied and after running the gel for 30 min, the power was turned off. Gel images were taken with a digital camera (Sony, DSC-QX10). The clear red or brown lines that appeared in the gel were assigned to differently shaped or sized NR's and qNS's. The gel region associated with each lane was cut out using a sharp knife and dried in 60 °C for 3 h. Characterization of the separated biofunctionalized NR's and qNS's from all gel lanes were performed using UV-vis spectrophotometry (Shimazu) and TEM (Hitachi, H-7600). Spectral measurements were performed in gel regions outlined in the data figures using a blank gel area as a background reference. In addition, the presence of proteins conjugated onto the surface of NR's and qNS's after the gel electrophoretic separation was confirmed by soaking the gel in an instant blue solution (M. biotech) for 30 minutes.

Results and discussion

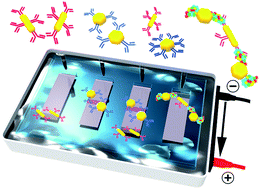
An overview of our approach is highlighted in Fig. 1 where different combinations of biofunctionalized and shaped nanoparticles are introduced to each lane of a 1.5% w/v agarose gel electrophoresis platform. Agarose gel is commonly used for the separation of nanometer sized DNA and protein molecules depending on their size and surface charge19,25 and has been previously applied for NP characterization.18,25,27,40,41 For the measurements reported here, we explored the preparation of gels with agarose percentages ranging from 0.5% to 2%. We found 1.5% to be optimal for the NP sizes used here as going lower resulted in a pore size that was too large for particle separation while a higher percentage hindered NP transport along the gel.
image file: c6ra23948j-f1.tif
Fig. 1 Schematic of the gel electrophoretic separation of either individual batches or mixtures of gold nanorods (NR's) and quasi-spherical gold nanoparticles (qNS's) biofunctionalized with antiAAT, AAT or antiBNP. Each lane highlights the presence of either bioaffinity interacting or non-interacting nanoparticles. Electrophoretic separation is performed in a 1.5% agarose gel run for 30 min at 100 V in 1× TBE buffer (pH 8.3). The gel is 6 × 10 cm2 with a thickness of ∼1 cm and run in a horizontal electrophoresis system.

Stock solutions of both nanorods (NR's) and quasi-spherical gold nanoparticles (qNS's) were both prepared using well-established seed-growth methods.7,8 The synthesis in both cases involves the formation of a CTAB surfactant which was then replaced with a carboxylic acid terminated alkanethiol (11-mercaptodecanoic acid, MUA) layer with repeated washing to remove excess CTAB and promote full MUA monolayer coverage. This was followed by the use of EDC/NHSS cross-linking chemistry to covalently attach AAT, antiAAT or antiBNP (the latter used as a control) to the different nanoparticle surfaces. In particular, AAT is an Alzheimer's disease biomarker with its affinity for the antiAAT used here recently described elsewhere.42 This pairing was selected as a model system for proof-of-principle with antiBNP a non-specific control. As well as being a proven route for surface bioconjugation, this approach was also an attempt to achieve comparable surface charge, biomolecular coverage, and non-specific interaction behaviors for each colloid sample and is the main reason that we used qNS's prepared using a variation of the CTAB chemistry used for the NR synthesis.34 Variation in surface chemistry parameters as well as NP size will affect gel electrophoretic mobility.43

Nanoparticle distributions both in solution and in different regions of gels were analyzed using TEM and extinction spectroscopy. Fig. 2 compares results for the analysis of colloidal solutions of qNS's (a) and NR's (b) before and after electrophoretic separation. In the gel measurements described here colloidal solutions at a concentration of (a) ∼2.6 nM and (b) ∼4 nM, respectively were resuspended in 1× TBE buffer containing 0.1% w/v of the negatively charged SDS surfactant for three hours prior to electrophoretic analysis to promote NP separation. SDS is commonly utilized in DNA and protein electrophoresis to minimize non-specific intermolecular interactions. Attempts involving no surfactant or instead utilizing alternative surfactants, namely DSS and SHS, were unsuccessful as these instead resulted in NP aggregation in the gel loading wells and thus inhibited the separation performance.


image file: c6ra23948j-f2.tif
Fig. 2 (a.i) UV-vis spectrum and representative TEM image (inset) of a bulk solution of qNSs conjugated to antiAAT, (a.ii) images of gel lanes before and after separation, and (a.iii) UV-vis spectrum and representative TEM image of the highlighted gel region. For (b.i)–(b.iii), a similar analysis for NR-antiAAT conjugates is repeated. The bulk particle concentrations loaded into the gel were 2.6 and 4 nM for qNS and NR, respectively. Both (c) and (d) are images of the gel lanes corresponding to (a) and (b) respectively following staining with Instant Blue to highlight the presence of antiAAT.

The qNS particles described in Fig. 2(a) synthesized typically have a lower yield and a more varied morphology than that associated with the established route for NR synthesis. Both involve CTAB in the growth solution but differ in the initial seed preparation and reactant concentrations. The qNS samples used here had a LSPR maximum at ca. 532 nm following bioconjugation of antiAAT (Fig. 2(a.i)). TEM analysis of the initial stock solution indicated an average size of 53 (±8) nm and a composition of ∼72% quasi-spherical, ∼11% rods, ∼11% triangular prisms and ∼6% of cube-shaped gold nanoparticles, with example images shown in the inset of Fig. 2(a.i and iii). Further TEM images are also shown in the ESI (Fig. S1). The images of the gel lanes comparing before and after the application of 100 V for 30 min clearly highlights the mobility of the qNS's under an applied potential. The corresponding UV-vis spectra and TEM analysis of the region of the gel lane outlined in Fig. 2(a.iii) both indicate an improvement in the homogeneity of the qNS colloid. In particular, there is a significant drop in extinction at longer wavelengths (>700 nm) that is associated with anisotropic structures and this is further supported by the TEM analysis where the percentage of qNS's rose from 72% to 82%, while other non-spherical shaped NP's also decreased from 28% to 18%.

The colloidal NR-antiAAT bioconjugates featured in Fig. 2(b) had LSPR λmax values at 513 nm and 760 nm for the bulk solution spectrum. A red shift of ∼5 nm was typically observed for the longitudinal LSPR peak following antibody conjugation while the shorter wavelength transverse LSPR peak position is relatively unchanged. From TEM image analysis (additional images are shown in Fig. S2), the average length and width of the NR's were 45 (±11) nm and 10 (±2) nm respectively. Comparison of the NR colloid before and after separation revealed significant changes. Initial bulk analysis indicated the percentage of rod shapes to be 72%, while the 84% obtained after separation is closer to that typically expected for a high-quality rod sample.7 This is also reflected in the extinction spectra (Fig. 2(b.i and iii)) with the longitudinal LSPR peak actually considerably narrower (full width at half maximum, FWHM, reduced from 192 to 140 nm) and also blue-shifted by 10 nm which, compared to the bulk solution measurement in water, may be due to the drying of the gels prior to spectral analysis as well as no significant NP aggregation. The ratio of longitudinal/transverse LSPR peak intensities is also higher (3.35 vs. 2.33) after separation, which also indicates a higher percentage and uniformity of the NR's within the sampled gel region.

The next experiment performed was to analyze the gel separation of a mixture of non-interacting NR's and qNS's each functionalized with different antibodies: antiAAT and antiBNP respectively. Fig. 3 compares three individual lanes featuring either each individual colloid or where the gel was loaded with a mixture of both NR's and qNS's at a 1[thin space (1/6-em)]:[thin space (1/6-em)]1 particle ratio. Spectra of the individual colloidal solutions used here and in the following figure are shown in the ESI (Fig. S3). Also, additional TEM images are shown in the ESI, Fig. S4 (qNS's) and S5 (NR's) which indicate an average diameter of 34 (±7) nm for the qNS's and an average length and width of 46 (±9) nm and 12 (±7) nm for the NR's used here.


image file: c6ra23948j-f3.tif
Fig. 3 Analysis of a mixture of non-interacting antiAAT-NR and antiBNP-qNS conjugates. (a) UV-vis spectrum of bulk mixture prepared at a 1[thin space (1/6-em)]:[thin space (1/6-em)]1 ratio prior to electrophoresis. (b) Images of individual gel lanes featuring (i) antiAAT-NRs and (ii) antiBNP-qNSs only while the mixture is in lane (iii). Each image was cropped from the same gel and placed side-by-side for clarity, (see also Fig. S7 and S9 in ESI). The bulk particle concentrations loaded into the gel for qNS's and NR's were 2 nM. (c) Spectra and (d) representative TEM images of colloids from the two regions labeled A and B are also shown.

Comparison of the extinction spectra of the initial mixture of NR's and qNS's in Fig. 3(a) with that in (c) for the separated regions labeled A and B show significant changes. The two different shapes in the non-interacting mixture accumulate in separate regions in the gel lane, (iii) with the smaller volume NR's traveling further. The distinct separation of the two particle shapes compares favorably with previous literature reports. For example, Hanauer et al.18 show almost overlapping GE bands following separation between spheres and rods similar in size to that applied here. Key differences are that in our case, the NP's had to be preincubated with 0.1% SDS for up to 3 hours prior to analysis to achieve good separation while the earlier work utilized PEG-COOH modified NP's. In addition performance optimization was obtained here with a 1.5% agarose gel compared previously to a 0.2% gel. These differences highlight the interplay between the surface functionalization of the NP surface, gel pore size and variable strength of the gel–NP interaction likely to occur at different pore sizes. The spectra of the gel regions in Fig. 3(c) also show the same trends as for Fig. 2 with both the NR's and qNS's showing a peak blue shift compared to the respective solution spectra prior to electrophoretic analysis.

Further control experiments are shown in the ESI focusing on the qNS's at different steps of the biofunctionalization process (Fig. S6) and also comparing a nanoparticle mixture against a molecular protein ladder (Fig. S7). In the absence of any surface modification, the NP's completely aggregate and remain within the lane loading well. This also applies to stock NR's with the original CTAB surface chemistry. As a result, no particle separation could be achieved reproducibly without further surface modification with alkanethiol/proteins. In the cases where the surrounding layer around the qNS's is MUA as well as after EDC/NHSS incubation, AAT or antiAAT conjugation, there is not a significant difference in the gel path length travelled. However, there are differences in the particle distribution along each lane looking at where the color indicates the highest concentration of particles. This supports that the changes in NP morphology lead to a larger difference in particle separation than each of the surface chemistries used here, which is expected as our measurements were performed in the presence of SDS. However, it has been previously shown that the particle surface charge is relatively more important for smaller NP's.18 The protein ladder (7 to 240 kDa) shown in lane (iv) in Fig. S7 also highlights that the gel conditions are unsuitable for molecular protein separation.

To investigate the application of gel electrophoresis for assessing interacting nanoparticle systems, a colloidal solution of qNS's functionalized with AAT protein was mixed with a solution of NR's conjugated to antiAAT. Fig. 4(a) shows the results where the interacting NR[thin space (1/6-em)]:[thin space (1/6-em)]qNS ratio was varied from 9[thin space (1/6-em)]:[thin space (1/6-em)]1 to 1[thin space (1/6-em)]:[thin space (1/6-em)]9, with Fig. 4(b) containing the results for a repeat set of measurements instead featuring non-interacting mixtures of NR-antiAAT and qNS-antiBNP conjugates prepared at the same ratios. In each case, the colloids were resuspended in 1× TBE buffer and 0.1% SDS and then immediately mixed in different ratios for a period of 3 hours prior to loading into each gel lane. Because the presence of SDS was found to be needed to promote good nanoparticle separation, additional control measurements were performed. Firstly, time-dependent changes in the extinction spectra of a 5[thin space (1/6-em)]:[thin space (1/6-em)]5 colloidal mixture in the absence of SDS clearly show (see Fig. S8, ESI) dampening and shifting of the two dominant LSPR peaks within the mixture as particle assembly occurs. Additional experiments in Fig. S9 demonstrate that the presence of SDS does not impede the bioaffinity interaction, with the data also indicating that the SDS adsorption kinetics onto the NP surface is significantly slower than the bioaffinity-induced nanoparticle assembly.


image file: c6ra23948j-f4.tif
Fig. 4 (a) Analysis of mixtures of interacting antiAAT-NR's and AAT-qNS's conjugates prepared at stoichiometric antiAAT-NR[thin space (1/6-em)]:[thin space (1/6-em)]AAT-qNS ratios ranging from 9[thin space (1/6-em)]:[thin space (1/6-em)]1 to 1[thin space (1/6-em)]:[thin space (1/6-em)]9. (a.i) Extinction spectra of solution mixtures immediately after mixing, (a.ii) images of gel lanes following separation, (a.iii) and (a.iv) extinction spectra of highlighted regions in each lane. For each measurement the colloidal solutions were mixed for 30 min before introducing to the gel with the total particle concentration fixed at 2 nM. (b.i–b.iv) A similar set of comparative measurements are shown for non-interacting antiAAT-NRs and antiBNP-qNSs.

The bulk solution spectra in Fig. 4(a.i) were acquired immediately after mixing colloidal mixtures at each NP ratio. Initial comparison of Fig. 4(b.i and ii) clearly show that for the 5[thin space (1/6-em)]:[thin space (1/6-em)]5 colloidal mixture significant NP aggregation means that there is negligible travel of particles along the middle gel lane. Further differences between (a) and (b) can be found by comparing the spectral analysis of the highlighted gel regions associated with qNS's (region A) and NR's (region B). Both the bulk and gel-based spectra follow the same general trends with the LSPR peaks at 532 nm and 757 nm changing expectedly with particle concentration ratio. For the 9[thin space (1/6-em)]:[thin space (1/6-em)]1 and 7[thin space (1/6-em)]:[thin space (1/6-em)]3 regions in (a), the NR LSPR peak intensities at 757 nm are ∼26% and ∼33% lower than the controls in (b). Similarly, for the qNS peak at 532 nm the 1[thin space (1/6-em)]:[thin space (1/6-em)]9 and 3[thin space (1/6-em)]:[thin space (1/6-em)]7 intensities are ∼20% and ∼28% lower in (a) than the controls in (b). These results are consistent with a drop in NP concentration in the highlighted regions associated with nanoparticle aggregation occurring. This simple methodology of utilizing different particle ratios and comparing against controls clearly demonstrates the presence of sub-populations of interacting nanoparticles that will be of value for future studies of more complicated mixtures featuring differently sized and surface functionalized particle systems.

Conclusions

In this article, we have explored the concept of utilizing gel electrophoresis to look at both interacting and non-interacting mixtures of differently shaped colloidal solutions of nanoparticle-biomolecular conjugates. Nanorod's and quasi-spherical nanoparticles were applied both individually and in mixtures with each having at least one dimension in the ∼40–50 nm range and separately biofunctionalized either with an interacting antibody-protein or with two different antibodies. For both NP colloids, significant improvement in the uniformity of the particle morphology was attained following gel-based separation for both individual shapes and non-interacting mixtures. This was confirmed using both TEM and UV-vis analysis of bulk solution and gel-immobilized colloid. By comparing different stoichiometric ratios of interacting NP's with non-interacting controls, further evidence can be obtained to support the presence of sub-populations of interacting nanoparticles. Gel electrophoresis is a ubiquitous tool for biomolecular analysis and, more recently, for nanoparticle characterization and there are future opportunities for integration into lab-on-a-chip devices and higher-throughput 2D gel analysis.30 Furthermore, improving both the modeling of nanoparticle transport44 along with exploring different combinations of NP shapes and sizes will further increase the utility of this platform for the analysis of even more complex mixtures of interacting NP-protein bioconjugates featuring different particle shapes and protein functionalizations.

Acknowledgements

This research was supported by the National Research Foundation (NRF) of Korea funded by the Ministry of Science, ICT, and Future Planning (grant number: NRF-2015R1A2A1A15052198).

References

  1. K. M. Mayer and J. H. Hafner, Chem. Rev., 2011, 111, 3828–3857 CrossRef CAS PubMed.
  2. K. Saha, S. S. Agasti, C. Kim, X. Li and V. M. Rotello, Chem. Rev., 2012, 112, 2739–2779 CrossRef CAS PubMed.
  3. C.-J. Jia and F. Schüth, Phys. Chem. Chem. Phys., 2011, 13, 2457–2487 RSC.
  4. E. C. Dreaden, A. M. Alkilany, X. Huang, C. J. Murphy and M. A. El-Sayed, Chem. Soc. Rev., 2012, 41, 2740–2779 RSC.
  5. N. Khlebtsov and L. Dykman, Chem. Soc. Rev., 2010, 40, 1647–1671 RSC.
  6. S. Zeng, D. Baillargeat, H. Ho and K. Yong, Chem. Soc. Rev., 2014, 43, 3426–3452 RSC.
  7. B. Nikoobakht and M. A. El-sayed, Chem. Mater., 2003, 15, 1957–1962 CrossRef CAS.
  8. T. K. Sau and C. J. Murphy, J. Am. Chem. Soc., 2004, 126, 8648–8649 CrossRef CAS PubMed.
  9. C. J. Murphy, A. M. Gole, J. W. Stone, P. N. Sisco, A. M. Alkilany, E. C. Goldsmith and S. C. Baxter, Acc. Chem. Res., 2008, 41, 1721–1730 CrossRef CAS PubMed.
  10. C. Ziegler and A. Eychmuller, J. Phys. Chem. C, 2011, 115, 4502–4506 CAS.
  11. S. F. Sweeney, G. H. Woehrle and J. E. Hutchison, J. Am. Chem. Soc., 2006, 128, 3190–3197 CrossRef CAS PubMed.
  12. B. Kowalczyk, I. Lagzi and B. A. Grzybowski, Curr. Opin. Colloid Interface Sci., 2011, 16, 135–148 CrossRef CAS.
  13. K. E. Sapsford, K. M. Tyner, B. J. Dair, J. R. Deschamps and I. L. Medintz, Anal. Chem., 2011, 83, 4453–4488 CrossRef CAS PubMed.
  14. D. Steinigeweg, M. Schutz, M. Salehi and S. Schlucker, Small, 2011, 7, 2443–2448 CrossRef CAS PubMed.
  15. O. Akbulut, C. R. Mace, R. V. Martinez, A. A. Kumar, Z. Nie, M. R. Patton and G. M. Whitesides, Nano Lett., 2012, 12, 4060–4064 CrossRef CAS PubMed.
  16. L. Calzolai, D. Gilliland, C. P. Garcia and F. Rossi, J. Chromatogr. A, 2011, 1218, 4234–4239 CrossRef CAS PubMed.
  17. L. Pitkänen and A. M. Striegel, Trends Anal. Chem., 2016, 80, 311–320 CrossRef PubMed.
  18. M. Hanauer, S. Pierrat, I. Zins, A. Lotz and C. Sönnichsen, Nano Lett., 2007, 7, 2881–2885 CrossRef CAS PubMed.
  19. X. Xu, K. K. Caswell, E. Tucker, S. Kabisatpathy, K. L. Brodhacker and W. A. Scrivens, J. Chromatogr. A, 2007, 1167, 35–41 CrossRef CAS PubMed.
  20. N. Surugau and P. L. Urban, J. Sep. Sci., 2009, 32, 1889–1906 CrossRef CAS PubMed.
  21. A. I. López-Lorente, B. M. Simonet and M. Valcárcel, Trends Anal. Chem., 2011, 30, 58–71 CrossRef.
  22. U. Pyell, Electrophoresis, 2010, 31, 814–831 CrossRef CAS PubMed.
  23. S. S. Aleksenko, A. Y. Shmykov, S. Oszwałdowski and A. R. Timerbaev, Metallomics, 2012, 4, 1141–1148 RSC.
  24. D. Zanchet, C. M. Micheel, W. J. Parak, D. Gerion, S. C. Williams and A. P. Alivisatos, J. Phys. Chem. B, 2002, 106, 11758–11763 CrossRef CAS.
  25. W. J. Parak, T. Pellegrino, C. M. Micheel, D. Gerion, S. C. Williams and A. P. Alivisatos, Nano Lett., 2003, 3, 33–36 CrossRef CAS.
  26. M. Aubin-Tam and K. Hamad-Schifferli, Langmuir, 2005, 21, 12080–12084 CrossRef CAS PubMed.
  27. B. D. Chithrani, A. A. Ghazani and W. C. W. Chan, Nano Lett., 2006, 6, 662–668 CrossRef CAS PubMed.
  28. D. Bartczak and A. G. Kanaras, Langmuir, 2011, 27, 10119–10123 CrossRef CAS PubMed.
  29. N. Pernodet, M. Maaloum and B. Tinland, Electrophoresis, 1997, 18, 55–58 CrossRef CAS PubMed.
  30. A. V. Beskorovaynyy, D. S. Kopitsyn, A. A. Novikov, M. Ziangirova, G. S. Skorikova, M. S. Kotelev, P. A. Gushchin, E. V. Ivanov, M. D. Getmansky, I. Itzkan, A. V. Muradov, V. A. Vinokurov and L. T. Perelman, ACS Nano, 2014, 8, 1449–1456 CrossRef CAS PubMed.
  31. A. J. Mastroianni, S. A. Claridge and A. P. Alivisatos, J. Am. Chem. Soc., 2009, 131, 8455–8459 CrossRef CAS PubMed.
  32. Y.-F. Cheng, G.-P. Yu, Y. Yan, J.-Y. Liu, C. Ye, X. Yu, X.-D. Lai and J.-Q. Hu, RSC Adv., 2014, 4, 31515–31520 RSC.
  33. L. Piantanida, D. Naumenko and M. Lazzarino, RSC Adv., 2014, 4, 15281–15287 RSC.
  34. M. J. Kwon, J. Lee, A. W. Wark and H. J. Lee, Anal. Chem., 2012, 84, 1702–1707 CrossRef CAS PubMed.
  35. M. R. K. Ali, B. Snyder and M. A. El-Sayed, Langmuir, 2012, 28, 9807–9815 CrossRef CAS PubMed.
  36. H. R. Sim, A. W. Wark and H. J. Lee, Analyst, 2010, 135, 2528–2532 RSC.
  37. S. H. Baek, A. W. Wark and H. J. Lee, Anal. Chem., 2014, 86, 9824–9829 CrossRef CAS PubMed.
  38. H. R. Jang, A. W. Wark, S. H. Baek, B. H. Chung and H. J. Lee, Anal. Chem., 2014, 86, 814–819 CrossRef CAS PubMed.
  39. L. L. Ma, J. O. Tam, B. W. Willsey, D. Rigdon, R. Ramesh, K. Sokolov and K. P. Johnston, Langmuir, 2011, 27, 7681–7690 CrossRef CAS PubMed.
  40. C.-W. Liu, C.-C. Huang and H.-T. Chang, Langmuir, 2008, 24, 8346–8350 CrossRef CAS PubMed.
  41. E. Oh, K. Susumu, R. Goswami and H. Mattoussi, Langmuir, 2010, 26, 7604–7613 CrossRef CAS PubMed.
  42. S. Kim and H. J. Lee, Anal. Chem., 2015, 87, 7235–7240 CrossRef CAS PubMed.
  43. J.-Y. Kim, H.-B. Kim and D.-J. Jang, Electrophoresis, 2013, 34, 911–916 CrossRef CAS PubMed.
  44. R. J. Hill, Soft Mater., 2016, 12, 8030–8048 RSC.

Footnote

Electronic supplementary information (ESI) available. See DOI: 10.1039/c6ra23948j

This journal is © The Royal Society of Chemistry 2016
Click here to see how this site uses Cookies. View our privacy policy here.