 Open Access Article
Creative Commons Attribution 3.0 Unported Licence
Chitosan as a rainfastness adjuvant for agrochemicals†
Brett L. Symondsa,
Christopher I. Lindsayb,
Niall R. Thomsonb and
Vitaliy V. Khutoryanskiy *a
*a
aReading School of Pharmacy, The University of Reading, Whiteknights, P. O. Box 224, Reading RG6 6AD, UK. E-mail: v.khutoryanskiy@reading.ac.uk
bSyngenta, Jealott's Hill International Research Centre, Bracknell, Berkshire RG42 6EY, UK
First published on 18th October 2016
Abstract
Chitosan has been identified as an excellent rainfastness aid for a model agrochemical. We use fluorescent labelling and microscopy to show that chitosan deposits on Vicia faba leaves are able to resist wash off by rain, both in a lab-scale test and via simulated rain. Furthermore, via the same methods it has been demonstrated that the rainfastness of azoxystrobin, a common fungicide which is fluorescently active, can be improved by formulating with chitosan. These findings via fluorescent microscopy were in agreement with a quantitative LC-MS/MS method in which the exact quantity of active ingredient on a leaf surface was determined before and after a rain wash. The potential of chitosan as a rainfastness aid is further supported by positive comparison with a commercial tank-mix standard, with almost 100% retention of the model active ingredient achieved in both cases after 1 hour of washing with 10 mm h−1 intensity rain.
1 Introduction
Food security is of great concern around the world. Establishing how to supply our growing population is an important and growing issue for society.1 The ability of an agrochemical formulation to have a protective effect on crops is ensured by preventing losses to a multitude of factors. These loss mechanisms range from photolytic,2 hydrolytic or microbial degradation3 to spray drift4 and poor retention5 of impacting droplets.6 However, the sole focus of this research is the ability of an agrochemical deposit to resist wash-off by rain and irrigation – commonly termed rainfastness.7–9 In a recent study, we presented a method for characterizing rainfastness of fluorescently labeled polymers, and discussed what properties made poly(vinyl alcohol) rainfast.10Chitosan is a biopolymer with a great range of commercial and biomedical uses. Produced via the deacetylation of chitin, a natural polysaccharide sourced principally from crustacean shells,11 chitosan is subject to an enormous amount of research. The reason for this level of interest is that chitosan is biocompatible,11–18 biodegradable,12,13,19–21 non-toxic,12,13,17,22 mucoadhesive14 and shows good compatibility with other polymers in composites.12,13,17,19,22,23 Not least in the list of possible and realized applications for chitosan is its potential for plant protection.24,25 For example, chitosan was shown to inhibit viral infection in 11 plant species and it inhibits growth of various soil borne fungi.26,27
In this contribution we further expand the repertoire of chitosan and to our best knowledge this is the first demonstration that chitosan is an excellent rainfastness adjuvant for agrochemicals. We examine the retention of chitosan on Vicia faba leaf surfaces via fluorescent labeling and the use of fluorescent microscopy. To further this method, we assess the adjuvancy of chitosan as a rainfastness aid by formulating the polymer with a model fungicide. Azoxystrobin, able to offer protection against a wide range of fungal diseases, was selected to act as the model compound as it is fluorescently active. In addition, poly(vinyl alcohol) and a commercially available adjuvant are examined and compared. We characterize the physical properties of the polymers in order to determine which enables the adjuvancy. Finally, we directly measure the retention of azoxystrobin formulated with polymer solutions on leaf surfaces using a spot and wash method to recover the model compound and LC/MS-MS for quantitative analysis.
In a previous study10 we used the fluorescent microscopy techniques to assess the ability of poly(vinyl alcohol) (PVA) as a rainfastness agent. We highlighted with fluorescent imaging that high molecular weight PVA was most successful at retaining on leaf surfaces after rain. Chitosan and PVA share some characteristic properties – such as being the product of deacetylation of a precursor – chitin and poly(vinyl acetate) respectively. Both polymers are semi-crystalline and depending on molecular weight, the polymers are insoluble at neutral and ambient conditions. This work significantly builds on the previous art by incorporating a model fluorescent agrochemical into our existing analysis method and via quantitative analysis of rainfastness adjuvancy using LC/MS-MS. Additionally we are able to draw comparisons between chitosan and PVA as rainfastness aids.
2 Experimental
2.1 Materials
Three samples of chitosan were purchased from Sigma Aldrich (UK). Samples were supplied as ‘low’, ‘medium’ and ‘high’ molecular weights. Fluorescein isothiocyanate, used to label chitosan, was also purchased from Sigma Aldrich (UK). Azoxystrobin was provided by Syngenta in the form of a milled formulation. As azoxystrobin is insoluble in water, it is provided as a 50% concentration of milled particles which are dispersed in water with an anionic surfactant. In addition, xanthan gum is present as an anti-settling agent. A sample of Bond, a commercial adjuvant containing ‘45% styrene butadiene copolymer and 10% alcohol alkoxylate’ was obtained from De Sangosse Ltd.2.2 Characterization of polymers
Chitosan is water-soluble only below pH 6.5.18,28 For 1H NMR and GPC, trifluoroacetic acid (TFA) was used to adjust the pH of solution. For all other methods requiring chitosan solutions, 0.2 M acetic acid was used. Chitosan can take many hours to fully dissolve and solutions were stirred for at least 24 hours before use. Poly(vinyl alcohol) (PVA) was dissolved in deionized water by heating and stirring at 90 °C for approximately 1 hour.
 | (1) |
 | (2) |
2.3 Fluorescent labelling of polymers
Chitosan was labelled using fluorescein isothiocyanate (FITC) according to the methodology described previously.20,28 Chitosan (1 g) was dissolved in 100 mL of acetic acid (0.2 M) and left to stir for 24 hours. FITC (100 mg) was dissolved in 50 mL of methanol and subsequently was added to the chitosan solution and stirred for 3 hours. The labelled chitosan was then precipitated in 1 L of sodium hydroxide (0.1 M) and filtered. The product was redissolved and dialyzed using cellulose dialysis membrane with a molecular weight cut-off of 7 kDa (Medicell Membranes Ltd) against deionized water to remove any unreacted FITC. Finally, the product was obtained via freeze drying of the dialyzed solution. PVA was labeled using 5-((4,6-dichlorotriazinyl)aminofluorescein) (5-DTAF) according to the procedure previously reported.102.4 Rainfastness methods
Assessing rainfastness inherently requires that the formulation being examined is in the form of a dry deposit on a surface. Vicia faba (field bean) plants used as the surface were provided by Syngenta. The plants were grown under controlled conditions and leaves used were from leaf position 3 (LP3) from plants of growth stage 18 (GS18) classified using the BBCH scale (Table S2 in the ESI†).29 Leaf position refers to the position of leaves on the plant, LP1 being the first set of leaves from the bottom of the plant, LP2 being the second set and so on. All treatments studied were either solutions of fluorescently labelled polymers or formulations of unlabeled polymer and fluorescently active azoxystrobin (Table 1). ‘Bond’ (De Sangosse), a commercially available ‘spray modifier’ and ‘sticker’ adjuvant, was used as a commercial control.| Treatment | Adjuvant/polymer details | Concentration of polymer (% w/w)* | Concentration of azoxystrobin (% w/w) | Fluorescent label |
|---|---|---|---|---|
| a *Unless indicated otherwise. **Concentration of the active ingredients in Bond. | ||||
| AZ | — | — | 1.0 | — |
| BOND-AZ | See Materials section | 0.15** | 1.0 | — |
| CSL-F | 62 kDa chitosan | 0.40 | — | FITC |
| CSM-F | 124 kDa chitosan | 0.40 | — | FITC |
| CSH-F | 370 kDa chitosan | 0.40 | — | FITC |
| CSL-AZ | 62 kDa chitosan | 0.40 | 1.0 | — |
| CSM-AZ | 124 kDa chitosan | 0.40 | 1.0 | — |
| CSH-AZ | 370 kDa chitosan | 0.40 | 1.0 | — |
| PVAL-F | 20 kDa poly(vinyl alcohol) | 0.40 | — | 5-DTAF |
| PVAVH-F | 93 kDa poly(vinyl alcohol) | 0.40 | — | 5-DTAF |
| PVAL-AZ | 20 kDa poly(vinyl alcohol) | 0.40 | 1.0 | — |
| PVAVH-AZ | 93 kDa poly(vinyl alcohol) | 0.40 | 1.0 | — |
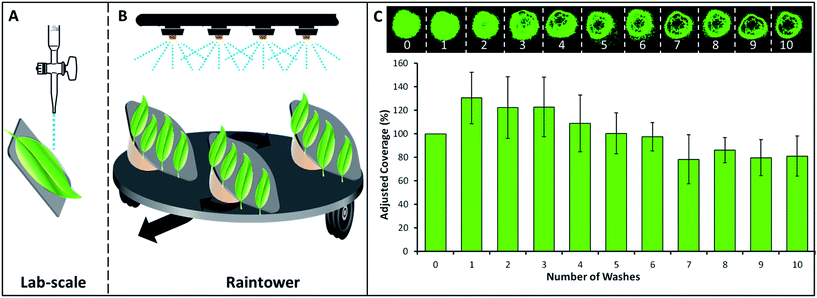
For analysis, dry deposits were first imaged under a fluorescent microscope (Leica MZ10 F, fitted with an ‘ET GFP’ filter and digital camera). The leaves were then sequentially washed and re-imaged until deposits were seen to be removed, or until no further change was likely to occur – resulting in a series of images which depict the wash-off behavior of each treatment. ImageJ software (v1.46r) was used to analyze the images by determining the coverage of the fluorescent polymer deposit. The first image was taken as the value for initial ‘100% coverage’ and the subsequent images were quantified as a percentage with regard to the initial dry deposit (Fig. 1C).
Ultra-high pressure liquid chromatography (UPLC) analysis was carried out using an Agilent Technologies 1290 Infinity instrument fitted with a Thermoscientific triple stage quadrupole Quantum Ultra tandem mass spectrometer detector (LC-MS/MS) available at Syngenta. The system was running with a pressure of 361 bar using an Acquity UPLC ethylene bridged hybrid C18 column and acetonitrile with 0.2% formic acid as mobile phase. The mass spectrometer detectors were able to analyze the parent ion (m/z = 404.2) and three fragments (m/z = 156.2, 172.2, 183.3). The daughter fragment of m/z = 156.2 was used for the actual quantitation of azoxystrobin. Samples were analysed in a random order to eliminate any potential error from drift in the detector. Further to this, several untreated leaves were washed with acetonitrile and analysed – this showed that no contaminants were detected as azoxystrobin fragments.
3 Results and discussion
3.1 Characterization of polymers
Proton NMR and GPC were used to determine fraction of acetylation and molecular weight, respectively, for both polymers. Weight average molecular weight as determined by GPC is reported in Table 1 and further parameters from GPC are provided in Table S1 in the ESI.† The fraction of acetylation was determined to be 29.7, 26.1 and 30.7% for CSL, CSM and CSH, respectively. Molecular weights of PVAL and PVAVH were determined previously10 and are reported in Table 1 and the degree of hydrolysis for both PVA samples was 99%.3.2 Fluorescent microscopy analysis of rainfastness of labeled polymers
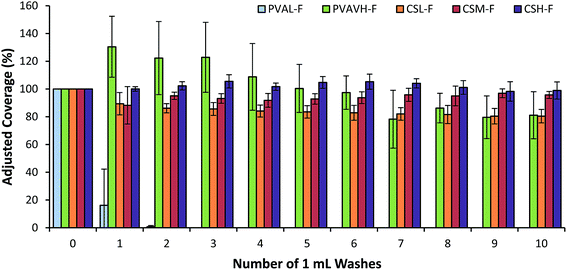
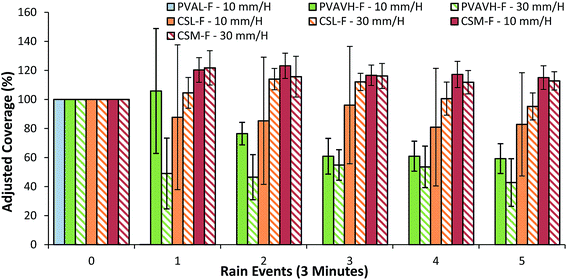
Lab-scale results for fluorescently labeled chitosan indicated that three grades of chitosan (CSL-F, CSM-F and CSH-F) resisted wash-off excellently (Fig. 3). Values retrieved for the pre-wash dry deposit were considered to represent 100% of coverage and subsequent values are adjusted accordingly. A decrease in coverage shows that a deposit is unable to resist wash-off and an increase occurs due to spreading of the deposit beyond the initial coverage boundary. Included in the presentation of results are a low (20 kDa) and a high (93 kDa) molecular weight sample of labeled PVA. High molecular weight PVA was proven to be much more resistant to wash-off than a low molecular weight PVA in a previous study.10 Regarding chitosan, after 10 washes the coverage of initial deposits changed very little, performing to the same level as high molecular weight PVA. To contrast this result, a poorly retaining low molecular weight PVA is completely removed after 2 washes. Previously, a molecular weight threshold for wash-off resistance was established to be around 35–50 kDa for PVA.10 Although supplied as ‘low’ molecular weight – at 62 kDa the lowest molecular weight chitosan sample tested still exceeds this PVA threshold. However, this PVA threshold cannot be considered to be particularly relevant to chitosan. Results suggest that the two higher molecular weight chitosan samples performed slightly better than low molecular weight grade but there is not a statistically significant difference between the three samples.The analysis of images from the raintower method (Fig. 4) follows the same procedure as at lab-scale except that simulated rain was used instead of a 1 mL wash. The chitosan samples both showed excellent ability to retain and exceed the coverage of the most resistant PVA grades. Chitosan with the lowest molecular weight (62 kDa) showed better performance than the best performing PVA sample. When PVA was examined, washing with a rain intensity of 10 mm h−1 was shown to be largely analogous to results generated in the lab, albeit with reduced coverage values for each sample. However, increasing the intensity of rain from 10 mm h−1 to 30 mm h−1 had a significant detrimental impact on the retention of all but the highest molecular weight PVA grades (92 kDa). Interestingly, the increase in intensity of rain does not make a significant difference in retention of chitosan samples. This highlights that chitosan deposits are significantly better at retaining on leaves than PVA.
3.3 Analysis of polymer adjuvancy on rainfastness of an agrochemical
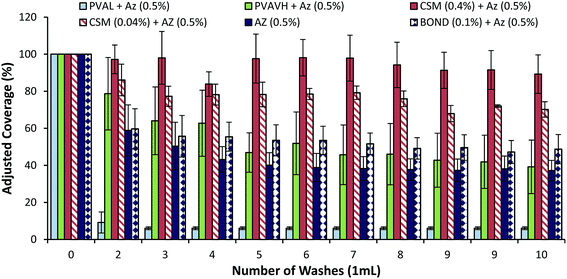
Until this point, analysis has been focused on the retention of polymer deposits on the leaf surface after washing. However, the aim is to identify and better understand these polymers as potential adjuvants for increasing the retention of an active ingredient. To this end, and instead of examining deposits of fluorescently labeled polymers, the following are results from analysis of a fluorescently active fungicide formulated with the unlabeled polymers. Both the lab-scale and raintower methods are deployed in the same way as already discussed.Lab scale results, presented in Fig. 5, highlight that chitosan successfully increased the coverage of azoxystrobin over an unformulated azoxystrobin control. Chitosan (CSM) was shown to be better at enhancing the retention than PVA – when formulated with 0.4% w/w chitosan, azoxystrobin coverage was almost unchanged after 10 washes. Additionally, chitosan still had an excellent effect on the retention of azoxystrobin even at a reduced concentration of 0.04% w/w. Non-rainfast PVAL (9–20 kDa) had a detrimental effect on azoxystrobin retention – the highly soluble character of this PVA grade likely means that it acts as a surfactant and helps the removal process of the formulated azoxystrobin. Surprisingly, high molecular weight PVA (92 kDa) and a commercial adjuvant, Bond, did not significantly increase the retention of azoxystrobin over an unformulated azoxystrobin control. This method is qualitative so it is not possible to conclude that CSM is twice as good at improving retention of Bond simply because the coverage of azoxystrobin formulated with CSM after 10 washes was double than that of azoxystrobin formulated with Bond. It may simply mean that CSM is better able to maintain an evenly distributed coverage of azoxystrobin than Bond.
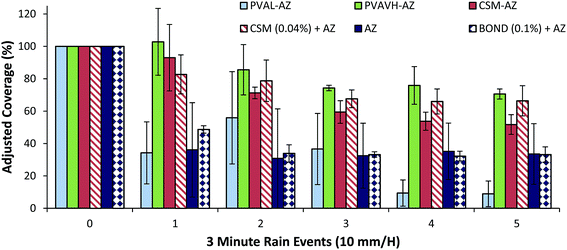
Raintower wash-off profiles of azoxystrobin formulated with polymers are largely analogous to lab-scale results (Fig. 6). Although PVAL-AZ showed some increased coverage in initial images, by the fifth wash the majority of azoxystrobin coverage was lost. Retention of azoxystrobin when formulated with PVAVH was improved and retention when formulated with CSM was reduced when compared to lab-scale results. However, Bond and an unformulated azoxystrobin showed similar performance as in the lab-scale analysis. Overall, the similarity of results between the two methods is a good sign that the rainfastness adjuvancy of unlabeled polymers can be examined by this method. Azoxystrobin may be aggregated in one particular area of the deposit and the detected coverage values will not indicate this. Therefore, coverage lost may not be equal to the actual loss of azoxystrobin, and equally, maintaining complete coverage may not represent complete retention of azoxystrobin. A lab-scale or raintower fluorescent microscopy method has potential to be used as a qualitative screening method for determining rainfastness potential of various adjuvants.
As in fluorescent microscopy analysis, a low molecular weight PVA (9–20 kDa) was unable to increase retention of the active ingredient and perhaps increased the solubility of azoxystrobin. The most surprising result was that the high molecular weight PVAVH (92 kDa) was unable to improve retention of azoxystrobin over the control. This result was repeated with three sets of leaves which were subjected to 10, 20 and 30 minutes of rain. The hypothesis was that the PVAVH would show a gradual loss of azoxystrobin recovery over time. However, results (Fig. 7B) showed a consistent level of recovery. It is possible that the first result is an anomaly or that between 30 and 60 minutes, significant losses occur.
3.4 Further discussion
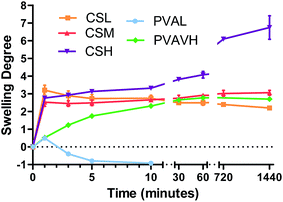
Results from fluorescent microscopy analysis of polymer retention correlated well with the swelling and solubility analysis of bulk polymer films. Polymers (CSL, CSM, CSH and PVAVH) that resist dissolution in water are able to resist being washed off of leaf surfaces. They also showed the ability to aid the retention of a formulated agrochemical. A PVAL film which dissolved in water after just 10 minutes also showed poor retention on leaf surfaces. Additionally it reduced the effectiveness of azoxystrobin at retaining on a leaf surface as shown in all analysis methods.In the azoxystrobin microscopy analysis, the coverage of azoxystrobin when formulated with Bond was reduced significantly after washing. This result was not corroborated via the spot and wash method, which showed that Bond was an excellent rainfastness adjuvant. This discrepancy and others like it are possibly due to the way in which the deposit forms. When a Bond and azoxystrobin formulation dry into a deposit it is possible that the fungicide is concentrated into certain regions. This means that losing significant fluorescent coverage is not a direct indication of significant azoxystrobin loss. In lab-scale analysis of azoxystrobin coverage, chitosan was significantly better at retaining coverage than Bond or PVA. Although in the spot and wash analysis it was shown the Bond and chitosan performed similarly well – the fact that chitosan was able to achieve this result with a larger area of coverage may be a useful property. It could be advantageous for an agrochemical adjuvant to have increased coverage as well as rainfastness. Additionally, chitosan and PVA are considered biodegradable and non-toxic substances – advantages over some conventional compounds which may be harmful when used in high doses.32
4 Conclusions
Via fluorescently labeling and microscopy, chitosan and PVA were proven to resist wash-off by rain on Vicia faba leaf surfaces in lab-scale and raintower tests. Formulations of the unlabeled polymer and a fluorescently active fungicide were also tested via the same methods to prove that the polymers could improve retention of a co-formulant. An optimized azoxystrobin control lost coverage after rain washing more easily than azoxystrobin formulated with chitosan or high molecular weight PVA (92 kDa). Finally, it was shown quantitatively that retention of a model agrochemical was improved when formulated with these polymers via a ‘spot and wash’ method. For chitosan, almost 100% retention of azoxystrobin on Vicia faba leaf surfaces was achieved which was comparable to a commercially available adjuvant. For the future, the method of testing a potential adjuvant with azoxystrobin, or a similarly fluorescently active ingredient, and measuring loss of coverage via fluorescent microscopy shows promise as a high throughput method for measuring these treatments on a variety of different surfaces. After promising adjuvants are identified the testing should move onto the more rigorous ‘spot and wash’ method.Acknowledgements
We acknowledge the BBSRC (CASE Studentship BB/J0124401/1) and Syngenta for funding the doctoral project of BLS. We also acknowledge the Chemical Analysis Facility (CAF) at the University of Reading for use of NMR and TGA equipment. Finally, we gratefully acknowledge our colleagues at the University of Reading and Syngenta for their useful input, in particular David Lomath, Stephanie Lucas, Anne Stalker and Jill Foundling.Notes and references
- FAO, IFAD and WFP, The state of food insecurity in the world, strengthening the enabling environment for food security and nutrition, Rome, 2014 Search PubMed.
- K. Scholz and F. Reinhard, Pestic. Sci., 1999, 55, 652–654 CrossRef CAS.
- F. Matsumura, in Biodegradation of Pesticides, ed. F. Matsumura, Plenum Press, New York, 1982, pp. 67–87 Search PubMed.
- R. Schulz, Chemosphere, 2001, 45, 543–551 CrossRef CAS PubMed.
- G. Pergher, R. Gubiani and G. Tonetto, Crop Prot., 1997, 16, 25–33 CrossRef.
- G. G. Briggs and R. H. Bromilow, in Interactions Between Adjuvants, Agrochemicals and Target Organisms, ed. P. J. Holloway, Springer-Verlag, Berlin, Heidelberg, 1994 Search PubMed.
- F. C. Roggenbuck, L. Rowe, D. Penner, L. Petroff and R. Burow, Weed Technol., 1990, 4, 576–580 CAS.
- P. Tamez-Guerra, M. R. McGuire, R. W. Behle, J. J. Hamm, H. R. Sumner and B. S. Shasha, J. Econ. Entomol., 2000, 93, 210–218 CrossRef CAS PubMed.
- J. V. Bariuan, K. N. Reddy and G. D. Wills, Weed Technol., 1999, 13, 112–119 CAS.
- B. Symonds, N. R. Thomson, C. I. Lindsay and V. V. Khutoryanskiy, ACS Appl. Mater. Interfaces, 2016, 8, 14220–14230 CAS.
- R. M. N. V. Kumar, R. A. A. Muzzarelli, H. Sashiwa and A. J. Domb, Chem. Rev., 2004, 104, 6017–6084 CrossRef PubMed.
- M. Z. Elsabee and E. S. Abdou, Mater. Sci. Eng., C, 2013, 33, 1819–1841 CrossRef CAS PubMed.
- S. K. Shukla, A. K. Mishra, O. A. Arotiba and B. B. Mamba, Int. J. Biol. Macromol., 2013, 59, 46–58 CrossRef CAS PubMed.
- I. A. Sogias, A. C. Williams and V. V. Khutoryanskiy, Biomacromolecules, 2008, 9, 1837–1842 CrossRef CAS PubMed.
- D. K. Singh and A. R. Ray, J. Macromol. Sci., Polym. Rev., 2000, 40, 69–83 CrossRef.
- M. Kong, X. G. Chen, K. Xing and H. J. Park, Int. J. Food Microbiol., 2010, 144, 51–63 CrossRef CAS PubMed.
- E. Khor and L. Y. Lim, Biomaterials, 2003, 24, 2339–2349 CrossRef CAS PubMed.
- I. A. Sogias, V. V. Khutoryanskiy and A. C. Williams, Macromol. Chem. Phys., 2010, 211, 426–433 CrossRef CAS.
- E. Guibal, Sep. Purif. Technol., 2004, 38, 43–74 CrossRef CAS.
- V. Dodane and V. D. Vilivalam, Pharm. Sci. Technol. Today, 1998, 1, 246–253 CrossRef CAS.
- A. Bhatnagar and M. Sillanpää, Adv. Colloid Interface Sci., 2009, 152, 26–38 CrossRef CAS PubMed.
- J. Yin, K. Luo, X. Chen and V. V. Khutoryanskiy, Carbohydr. Polym., 2006, 63, 238–244 CrossRef CAS.
- M. T. Cook, G. Tzortzis, V. V. Khutoryanskiy and D. Charalampopoulos, J. Mater. Chem. B, 2013, 1, 52–60 RSC.
- M. E. I. Badawy and E. I. Rabea, Int. J. Carbohydr. Chem., 2011, 2011, 1–29 CrossRef.
- A. El Hadrami, L. R. Adam, I. El Hadrami and F. Daayf, Mar. Drugs, 2010, 8, 968–987 CrossRef CAS PubMed.
- P. Stossel and J. L. Leuba, J. Phytopathol., 1984, 111, 82–90 CrossRef.
- S. N. Chirkov, Appl. Biochem. Microbiol., 2002, 38, 5–13 CAS.
- M. T. Cook, G. Tzortzis, D. Charalampopoulos and V. V. Khutoryanskiy, Biomacromolecules, 2011, 12, 2834–2840 CrossRef CAS PubMed.
- U. Meier, Growth Stages of Mono- and Dicotyledonous Plants. BBCH Monograph, German Federal Biological Research Centre for Agriculture and Forestry, Berlin, Germany, 2001 Search PubMed.
- S. Mathew, M. Brahmakumar and T. E. Abraham, Biopolymers, 2006, 82, 176–187 CrossRef CAS PubMed.
- D. Rohindra, A. Nand and J. Khurma, S. Pac. J. Nat. Appl. Sci., 2004, 22, 32–35 Search PubMed.
- P. J. G. Stevens, Pestic. Sci., 1993, 38, 103–122 CrossRef.
Footnote |
| † Electronic supplementary information (ESI) available: Exemplary proton NMR spectrum for chitosan, table of molecular weight data for polymers, table from the BBCH handbook of plant growth scales and figure detailing concentration of azoxystrobin as detected by LC-MS/MS. See DOI: 10.1039/c6ra23485b |
| This journal is © The Royal Society of Chemistry 2016 |

